

Quick-service restaurant demand is being shaped by several changes occurring at the same time. Urbanization is concentrating consumers around residential, commercial and transit hubs. Longer working hours are increasing demand for convenient meals. Price sensitivity is influencing where and how frequently consumers eat out, while delivery and digital ordering are extending the reach of restaurant formats beyond their physical locations.
For QSR operators, these shifts create a forecasting challenge. Market growth does not automatically translate into outlet-level demand. The critical question is how population growth, spending capacity, consumption frequency, pricing and channel access interact within specific markets.
India’s organized food services segment is projected to increase its share from approximately 47%–52% of the total food services market in FY2025 to 60%–65% by FY2030. The organized segment is also projected to expand from approximately ₹3.2–3.5 trillion in FY2025 to ₹6.6–7.8 trillion by FY2030. These shifts indicate increasing formalization and a larger addressable market for organized restaurant formats.
Urbanization Changes Where QSR Demand Concentrates
Urbanization does more than increase the number of potential customers. It changes the spatial distribution of demand.
High-density residential developments, office clusters, universities, transportation corridors and mixed-use districts can create recurring meal occasions within relatively concentrated catchments. The resulting demand profile can differ considerably by location.
A business district may generate strong weekday breakfast and lunch demand, while a residential catchment may be more dependent on evening meals, family occasions and weekend traffic. Student-heavy areas may have greater sensitivity to entry-level pricing and smaller portions.
This makes population alone an inadequate forecasting variable. QSR expansion models need to incorporate household density, employment concentration, income distribution, mobility patterns and existing restaurant supply.
Convenience Is Increasing Consumption Frequency
Convenience has become closely connected to the number of occasions for which consumers consider restaurant food viable.
Faster service, takeaway formats, drive-throughs, delivery, digital ordering and compact outlets allow QSR brands to serve customers across more parts of the day. Late-night consumption is one example. Swiggy and Kearney reported that late-night meals were growing at roughly three times the rate of dinner orders in India in 2025.
Delivery is relevant here, but it should be viewed as one part of a broader convenience system. The underlying demand question is whether reducing time and effort increases purchase frequency within the target catchment.
Pricing Determines Which Consumers Convert
QSR demand is closely tied to perceived value.
Inflation and household budget constraints can make consumers more responsive to meal pricing, portion size, promotions and bundled offerings. At the same time, higher-income consumers may remain willing to spend more where they perceive stronger quality, convenience or experience.
Demand forecasting therefore needs to model different price-response curves rather than applying a single elasticity assumption across the market.
A useful assessment can test entry, core and premium price points against customer segments, purchase occasions and competing alternatives. This helps determine whether a proposed format is likely to generate frequency, larger baskets, or both.
Delivery Expands Reach, but Not Without Constraints
Digital ordering can extend the effective catchment of a restaurant beyond its immediate walk-in population. However, additional delivery demand also introduces packaging, platform commissions, preparation capacity and fulfillment constraints.
Forecasting should therefore distinguish between dine-in, takeaway and delivery volumes. Each channel has different transaction economics and different capacity requirements.
The relevant question is not simply how many orders a market could generate. It is how many profitable orders an outlet can fulfil within its operating constraints.
Turning Market Growth Into Outlet-Level Demand
Nexdigm’s QSR demand forecasting and analysis can connect macro demand drivers with outlet-level commercial variables.
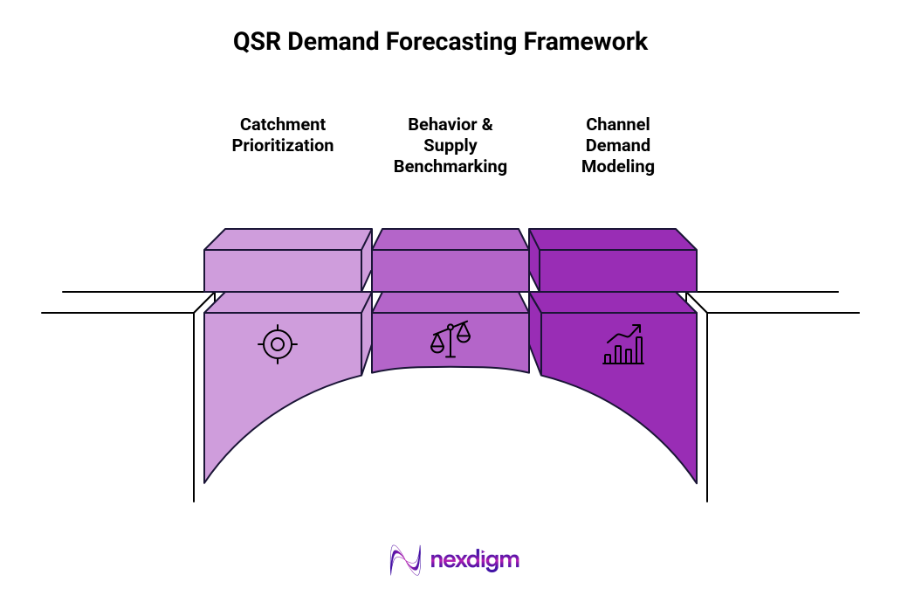
- Catchment Prioritization: Size macro market growth, then narrow to micro-catchments using population, income, mobility, footfall, and competitor density.
- Behavior & Supply Benchmarking: Map consumer visit cadence, daypart mix, price tolerance, and channel split against competitors’ menu architecture, price bands, and whitespace gaps.
- Channel Demand Modeling: Forecast transaction volumes and average order value (AOV) across dine-in, takeaway, and delivery against kitchen throughput, operating hours, and seating constraints.
This produces a more practical forecast of where demand is likely to emerge, which customer groups will generate it, and whether a particular QSR format can capture it profitably.
Nexdigm’s QSR Research in Practice
Nexdigm assessed a regional QSR chain across 36 outlets in 6 cities, combining 3,600 mystery evaluations, 2,400 customer responses, and 12 months of outlet data. The analysis identified service gaps and supported process changes that improve
To take the next step, simply visit our Request a Consultation page and share your requirements with us.
Harsh Mittal
+91-8422857704