

For a quick-service restaurant chain, procurement savings are rarely concentrated in one dramatic supplier negotiation. They tend to emerge across frequently purchased ingredients, packaging, delivery arrangements, and operating supplies. The challenge is deciding which categories deserve attention first.
A category with high annual expenditure may have little room for negotiation if supply is concentrated, or specifications are specialised. A smaller category may offer faster savings if multiple vendors provide equivalent products and outlets currently buy at inconsistent rates. QSR procurement teams therefore need to rank opportunities by both financial impact and implementation feasibility.
The Market Behind QSR Purchasing
India’s foodservice market was estimated at approximately ₹7.58 lakh crore in FY2024, according to industry figures reproduced in a 2025 SEBI-filed industry report. The organised segment accounted for approximately ₹3.71 lakh crore. Within organised foodservice, QSR revenue was estimated at ₹67,600 crore, with a projected annual growth rate of around 17% through FY2028.
These figures point to the scale of the purchasing challenge. As chains expand, demand for standardised ingredients, packaging, and distribution increases. Centralised buying can improve negotiating leverage, but the supplier network must still support individual outlet locations and delivery schedules.
Commodity conditions also vary. India’s wheat production reached 117.94 million tonnes in 2024-25, while oilseed production reached 42.99 million tonnes. However, edible-oil import dependence remained at 56.25% in 2023-24. This matters to QSR operators buying flour-based products and cooking oils: domestic agricultural output does not remove exposure to international prices, processing costs, or import-linked supply.
Ingredients: The Largest Operational Opportunity
Proteins, dairy, bakery products, produce, frozen ingredients, and edible oils should be ranked by annual spend and consumption frequency.
The most useful comparisons include:
- Cost per kilogram or litre, adjusted for grade and usable yield.
- Price variation between outlets buying equivalent products.
- Consumption per menu item or standard recipe.
- Rejection rates, spoilage, and preparation losses.
- Supplier capacity and availability of qualified alternatives.
Protein and fresh produce require particular attention to quality, yield, and delivery frequency. A lower quoted rate can become more expensive if trimming losses, inconsistent portion sizes, or spoilage increase.
Packaging: A High-Volume Category With Standardisation Potential
Takeaway containers, cups, lids, bags, cartons, and wrappers are repeat purchases across QSR networks. Differences in dimensions, material thickness, printing, and minimum order quantities can create unnecessary variation.
Benchmark packaging by cost per thousand units and per customer order. Also examine storage, freight, damage, and obsolete printed inventory. Standardising formats across outlets can improve volume leverage, provided the packaging still meets product-protection and food-contact requirements.
Logistics and Operating Supplies: The Less Visible Spend
Delivery charges, cold storage, cleaning products, kitchen consumables, and equipment maintenance can be distributed across multiple cost centres. This makes them easy to overlook.
Review delivery frequency, minimum order thresholds, emergency replenishment, supplier count, and route coverage. Consolidating orders may reduce freight, but excessive consolidation can increase inventory and waste, particularly for perishable products.
QSR Category Savings Prioritisation Framework
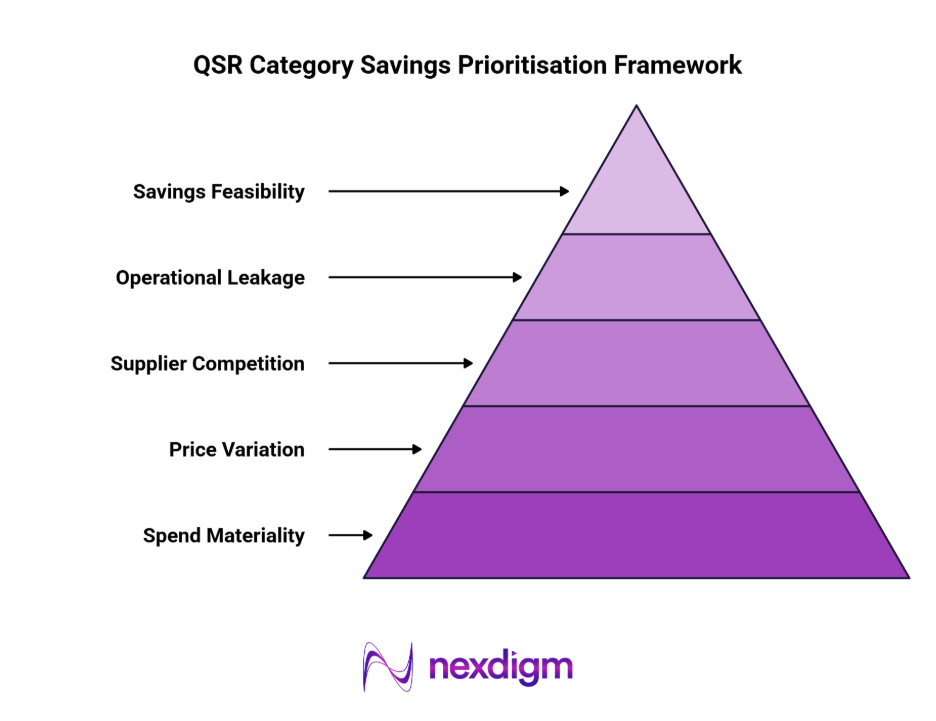
- Spend Materiality: Rank categories by annual expenditure, purchase frequency, and contribution to total procurement cost.
- Price Variation: Compare equivalent products across outlets and suppliers to identify unexplained differences in net delivered price.
- Supplier Competition: Assess qualified alternatives, market concentration, capacity, geographic coverage, and switching requirements.
- Operational Leakage: Examine waste, emergency orders, excess inventory, specification variation, and purchases outside negotiated agreements.
- Savings Feasibility: Prioritise opportunities by addressable spend, implementation time, quality impact, and continuity risk.
Where QSR Chains Should Start
Standard packaging, dry ingredients, and routine consumables may offer relatively accessible opportunities where specifications are consistent and several vendors can meet requirements. Fresh proteins and produce may need a more selective approach, combining central commercial agreements with approved regional suppliers.
The strongest procurement model does not simply move all purchases to the cheapest vendor. It establishes category-specific sourcing rules, common specifications, and measurable supplier performance.
Nexdigm’s Case Study
A leading QSR operator was facing inconsistent input costs across its 85 outlets, with limited visibility into regional supplier concentration and price variations. Nexdigm assessed 12 procurement categories across 6 markets, mapping supplier availability, production clusters and price movements. The analysis identified 4 categories with significant sourcing opportunities and helped prioritise markets offering an estimated 11–14% cost advantage.
To take the next step, simply visit our Request a Consultation page and share your requirements with us.
Harsh Mittal
+91-8422857704