

Quick-service restaurant procurement is a volume business with very little room for purchasing errors. Ingredient prices affect menu margins, delivery failures interrupt service, and inconsistent specifications create variation across outlets. For a chain operating dozen or hundreds of locations, even a small cost difference on a frequently purchased item can accumulate into a material annual expense.
A useful benchmark must answer three separate questions: which categories drive spend, which vendors provide competitive value, and whether the commercial terms support the operating model.
Category Benchmarking: Where Does the Money Go?
QSR purchasing typically spans proteins, produce, bakery products, dairy, frozen foods, edible oils, beverages, packaging, and kitchen consumables. These categories should not be measured against one common inflation assumption.
The FAO Food Price Index averaged 136.0 points in September 2026, up 5.8% year on year. Its component indices moved differently: cereals rose 17.2% year on year, vegetable oils 16%, and sugar declined 8.5%, while dairy fell 18.8%. These are international reference indices, not direct measures of Indian supplier prices, but they demonstrate why each category needs its own market baseline.
A category-level review should identify:
- Spend concentration: Which products and categories account for the largest share of annual purchasing?
- Price movement: Which inputs have changed most, and are supplier price adjustments consistent with relevant market signals?
- Usage intensity: How much of each input is consumed per order, menu item, or outlet?
- Specification flexibility: Can products be standardised without affecting food quality or menu consistency?
Vendor Benchmarking: Price Is Only One Measure
Two suppliers may quote different prices because they offer different grades, pack sizes, usable yields, delivery frequencies, or quality controls. A lower price per kilogram may not mean a lower cost per serving if trimming losses, product rejects, or preparation time are higher.
The vendor assessment should compare:
- Delivered cost, including freight and additional charges.
- On-time delivery, fill rates, and response during peak demand.
- Product consistency, rejection rates, and compliance with specifications.
- Production capacity, geographic coverage, and backup arrangements.
- Lead times and the ability to accommodate changes in demand.
For QSR procurement cost benchmarking research, purchase orders and invoices should be matched to standard product specifications and outlet-level consumption. This helps separate a true supplier price gap from differences in the products or services being purchased.
Commercial Terms: The Cost Beyond the Quote
Commercial terms can change the economics of a contract considerably. Volume rebates, minimum order quantities, credit periods, freight thresholds, price-validity periods, and emergency-delivery charges all affect the effective cost.
Buyers should calculate the net delivered price after rebates and charges, then assess whether order commitments are realistic. A volume discount can become expensive if it creates excess inventory, spoilage, or storage requirements. Likewise, a low unit price may be offset by frequent emergency orders caused by unreliable replenishment.
QSR Procurement Benchmarking Framework
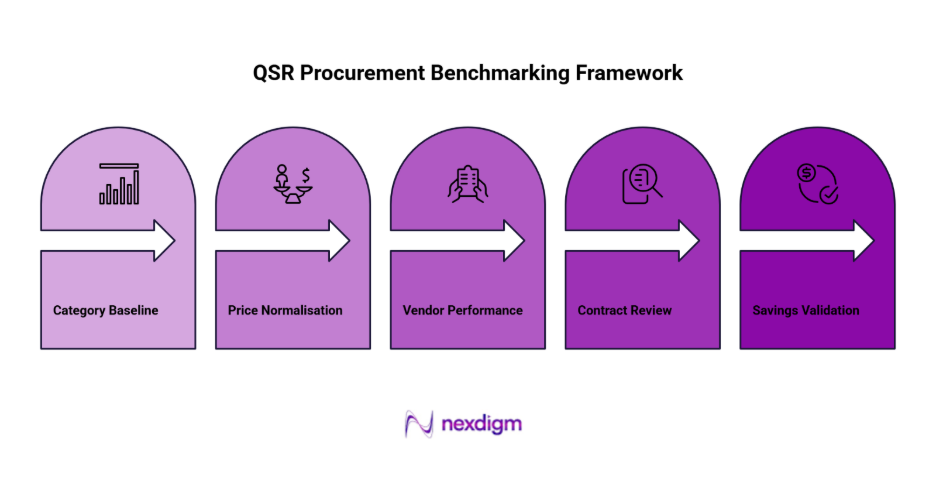
- Category Baseline: Rank spend by category, product, outlet, and supplier. Identify the highest-spend items and the categories with the greatest price variability.
- Price Normalisation: Compare equivalent specifications using cost per kilogram, litre, serving, or packaging unit. Adjust for usable yield, quality, and delivery conditions.
- Vendor Performance: Measure delivery reliability, fill rates, quality consistency, capacity, and responsiveness alongside price.
- Contract Review: Evaluate rebates, credit terms, minimum orders, freight, price adjustments, and purchasing compliance to calculate effective cost.
- Savings Validation: Prioritise negotiation, standardisation, consolidation, or alternative sourcing. Track savings against a baseline adjusted for volume and menu mix.
Market Outlook: Scale Requires Better Controls
India’s organised QSR market has been expanding, increasing the importance of repeatable purchasing processes across locations. As chains grow, central contracts can improve negotiating leverage, but regional supply constraints may still require local vendors. The practical model is often centralised standards and commercial governance combined with approved regional sourcing.
Nexdigm’s Case Study
In a QSR procurement assessment, invoice and outlet data were consolidated across six categories. The review identified inconsistent delivered prices, fragmented packaging orders, and weak visibility into emergency purchases. A programme combining rate-card standardisation, supplier reviews, and revised ordering rules targeted a 3% to 4% reduction in addressable spend, subject to validation against actual purchasing records.
To take the next step, simply visit our Request a Consultation page and share your requirements with us.
Harsh Mittal
+91-8422857704