

A refinery’s commercial potential depends on more than nameplate capacity. Product demand, crude access, processing configuration, utilization, transport and market access all affect whether capacity can generate sustained returns.
In the United States, operable atmospheric distillation capacity stood at 18.2 million barrels per calendar day on January 1, 2026, about 1% below the year-earlier level. Two refinery closures removed roughly 400,000 barrels per day of capacity. The reduction was especially significant on the West Coast, where capacity fell 5%.
A national total can conceal local opportunity. A closure in a region with limited pipeline connections can affect product availability differently from one in a well-connected market. Refinery assessments should therefore map supply and demand within the practical reach of each facility.
Start With the Product Deficit
Demand for refined products does not move as one market. The IEA estimates that global oil demand grew by 0.7% in 2025, but product trends varied: aviation fuel use rose 3.6%, while gasoline and diesel demand were virtually unchanged. A refinery’s product slate should be tested against demand for each product in its target market.
Measure local production, consumption, imports, exports and inventories for gasoline, diesel, jet fuel, LPG and other relevant products. Separate recurring deficits from seasonal shortages, stock changes and temporary refinery outages.
Then identify who buys the product and what alternatives they can use. A diesel shortfall may be met by imports or pipeline shipments from another region. Jet fuel demand may be rising, but airport storage or supply contracts could limit a new supplier’s access to customers.
Match Crude Access to Refinery Configuration
Crude availability means more than the volume produced nearby. Refineries need grades compatible with their units, sulfur-handling capability and target yields. A low-cost crude may not be advantageous if it requires process changes or produces an unsuitable mix of outputs.
Assess pipeline and terminal access, shipping costs, reliability and quality differentials. Include the risk of supply disruption and the time needed to switch between grades. A refinery with several viable sourcing routes may be more resilient than one dependent on a single crude stream, even if the latter has a lower headline feedstock cost.
Read Utilization and Margins Together
Utilization shows how much of a refinery’s operable capacity is being used, but it does not show whether the refinery is earning an attractive return. EIA data put average U.S. refinery utilization at 92.0% in 2025. High utilization can spread fixed costs over more output, but only if feedstock is available and the product slate can be sold at favorable netbacks.
Margin analysis should include crude costs, product values, operating expenses, freight, taxes, currency exposure and quality adjustments. It should also distinguish normalized margins from temporary spikes. In July 2026, the IEA reported all-time-high Atlantic Basin refining margins as product shortages and supply disruptions pushed up diesel, jet fuel and gasoline cracks. Those exceptional conditions should not be treated as a durable investment case.
Compare Upgrades With New Capacity
A market deficit does not automatically justify building a refinery. The opportunity may instead support a conversion unit, debottlenecking, product-quality improvements or a different crude slate. These options can address a specific product need with less capital than a new facility.
A refinery opportunity assessment services engagement can compare these choices against customer demand, existing configuration, construction timing and required returns. It should also account for planned competing capacity and the possibility that imports, new supply or changing consumption could narrow the deficit before a project comes online.
Framework: Crude-to-Cash Refinery Screen
Use this five-stage framework to determine whether the opportunity supports a commercial investment.
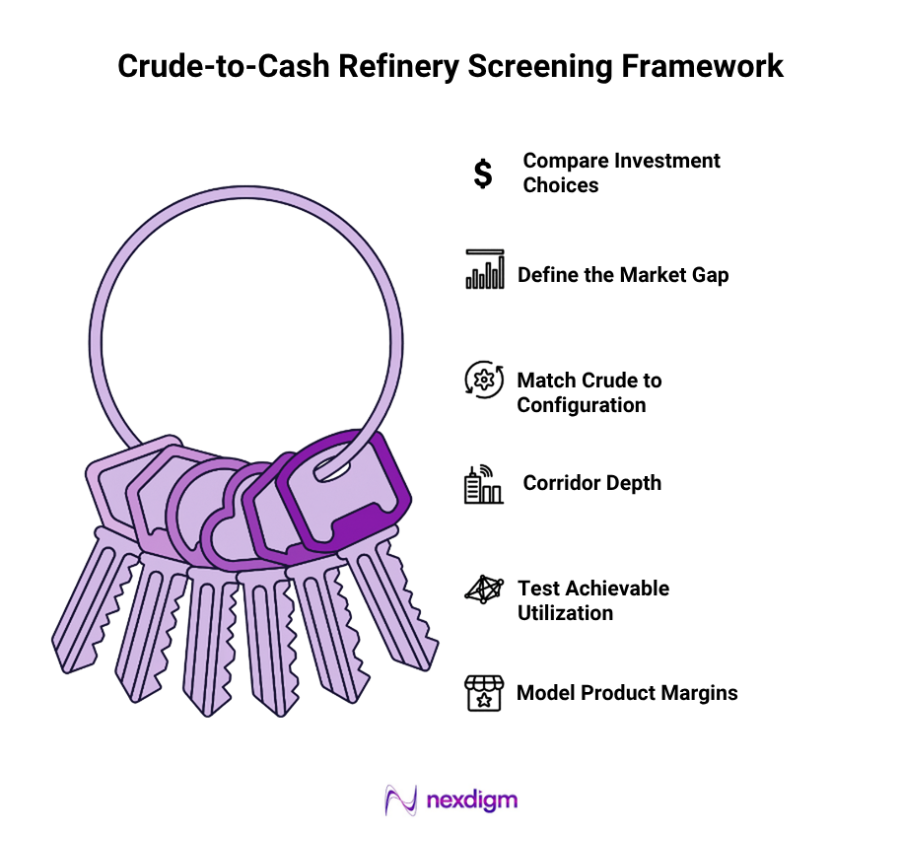
- Define the Market Gap
Map production, demand, imports, exports and inventories by product and region. Establish whether the deficit is structural, seasonal or temporary. - Match Crude to Configuration
Assess available crude grades, sourcing routes and compatibility with process units. Estimate product yields and identify operational constraints. - Test Achievable Utilization
Forecast throughput after maintenance, outages, feedstock limits and logistics constraints. Compare existing and planned capacity within the refinery’s supply radius. - Model Product Margins
Calculate netbacks for the target slate using crude costs, product prices, operating costs, freight, taxes and quality adjustments. Stress-test margins against lower utilization and changing differentials. - Compare Investment Choices
Evaluate new capacity, upgrades, debottlenecking and supply agreements against capital needs, schedule, returns and downside exposure. Prioritize the option that serves a durable product need with the strongest risk-adjusted economics.
Nexdigm Case Study
Nexdigm modelled refinery economics across four coastal markets, testing crude access, product deficits, utilization and margin sensitivity. The scenario found one market with a persistent diesel shortfall and viable returns at 82% utilization; a second required a major crude-terminal upgrade. We recommended evaluating a conversion-unit upgrade in the first market.
To take the next step, simply visit our Request a Consultation page and share your requirements with us.
Harsh Mittal
+91-8422857704