

Restaurant procurement affects food margins, service consistency, inventory, and day-to-day operating costs. A restaurant group may negotiate favourable rates centrally yet pay more than necessary because individual outlets place small orders, use different suppliers, or purchase outside negotiated agreements. Comparing invoice prices alone will not reveal these problems.
A useful procurement benchmark separates category expenditure, vendor performance, and contract economics, then connects them to the realities of restaurant operations.
Procurement Is Part of a Larger Food Economy
India’s food-processing sector recorded gross value added of ₹2.24 lakh crore in 2023-24, up from ₹1.34 lakh crore in 2014-15, according to government estimates. The sector’s average annual growth rate was 6.55% over the nine years ending in 2023-24. Processed food accounted for 20.4% of India’s agricultural exports in 2024-25, compared with 13.7% in 2014-15.
For restaurant operators, the expansion of processing and distribution can create sourcing opportunities across ingredients, prepared foods, bakery products, beverages, and packaging. But national sector growth does not guarantee local price competition. Freshness, delivery frequency, product specifications, and supplier coverage still determine which vendors are suitable for an individual outlet.
Category Benchmarking: Where Is Spend Concentrated?
Restaurant expenditure should be segmented across fresh ingredients, proteins, dairy, frozen products, beverages, packaging, cleaning supplies, equipment, and maintenance. Each category has different cost drivers and savings opportunities.
The FAO Food Price Index averaged 136.0 points in September 2026, 5.8% above the year-earlier level. Cereals were 17.2% higher year on year and vegetable oils 18.3% higher, while dairy was 18.8% lower. These international indicators are useful context, but they do not directly represent restaurant purchase prices in India.
Category analysis should identify:
- Annual expenditure by product, outlet, and supplier.
- Price differences for equivalent products.
- Consumption and waste relative to sales.
- Categories with limited supplier competition.
- Spend outside negotiated contracts.
Purchasing should also be linked to menu mix. A rise in average ingredient expenditure may reflect increased sales of premium dishes rather than supplier inflation.
Vendor Benchmarking: Price, Quality, and Delivery
Restaurant vendors should be compared using equivalent product specifications and service requirements. A supplier offering a lower rate may require larger orders, deliver less frequently, or provide products with a shorter usable life. A higher-priced vendor may reduce emergency purchases or wastage through more reliable replenishment.
Vendor scorecards should measure delivered price, fill rates, on-time delivery, quality consistency, rejection rates, lead times, and responsiveness. Fresh-food suppliers may need different weightings from equipment vendors or packaging manufacturers.
For restaurant procurement benchmarking reports, the data should be normalised for location, order volume, delivery frequency, and product grade before conclusions are drawn about competitiveness.
Commercial Terms: The Hidden Cost of Buying
Contract terms influence the actual cost of procurement. Minimum orders, freight, credit periods, rebates, delivery charges, and price-validity periods can materially change the economics of a purchase.
Restaurants should calculate net delivered cost after rebates and charges, then assess whether order commitments match demand. A bulk discount may be counterproductive when it increases spoilage or ties up working capital. Fragmented orders may also generate extra transport costs even when the underlying product price is competitive.
Central contracts can improve bargaining power, but a single national supplier may not provide the best coverage for every location. Approved regional suppliers can be useful where freshness and delivery speed matter more than uniform sourcing.
Restaurant Procurement Benchmarking Framework
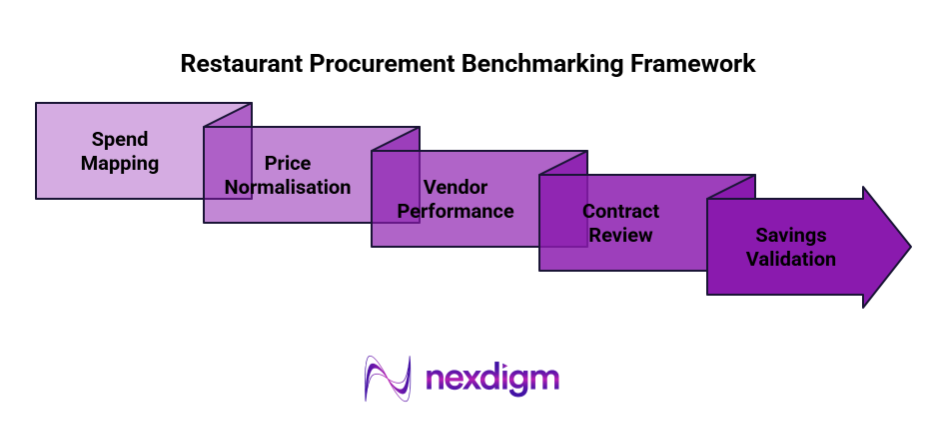
- Spend Mapping: Consolidate category expenditure by outlet, supplier, and period, using consistent product codes and units.
- Price Normalisation: Compare equivalent products and adjust for delivery, volume, quality, pack size, and commercial terms.
- Vendor Performance: Measure price, quality, availability, delivery reliability, and capacity to meet peak demand.
- Contract Review: Examine rebates, minimum orders, freight, payment terms, emergency purchases, and compliance with agreed rates.
- Savings Validation: Prioritise consolidation, negotiation, alternative sourcing, and waste reduction based on achievable savings and operational risk.
Central Standards, Local Execution
The most effective restaurant procurement models combine central visibility with local flexibility. Common specifications and rate cards can improve consistency, while regional sourcing supports fresh products and locations where national distribution is uneconomical. Procurement savings should be measured after accounting for sales volume, menu mix, wastage, and service performance.
Nexdigm’s Case Study
A restaurant group consolidated ₹21 crore in annual purchasing across 32 outlets. The review identified inconsistent delivered prices, fragmented packaging orders, and emergency buying. Standardised rate cards and revised supplier allocation were prioritised, with savings measured against actual purchasing volumes and outlet service requirements.
To take the next step, simply visit our Request a Consultation page and share your requirements with us.
Harsh Mittal
+91-8422857704