

Retail trade data is becoming increasingly useful for understanding how products, suppliers, and markets are changing. Global trade reached a record US$35 trillion in 2025, while the value of world merchandise trade increased 15% year-on-year in the first half of 2026, although trade volumes grew by a more moderate 3.5%, reflecting higher prices. The WTO has also revised its 2026 merchandise trade-volume growth forecast to 3.9%.
For retailers and consumer businesses, these movements create a need to understand more than overall market growth. Retail trade data analysis can reveal where product demand is strengthening, which suppliers are gaining share, how prices are moving, and where competitive activity is changing.
Demand Signals Can Appear in Trade Flows
Import volumes, shipment frequency, destination markets, and product-level trade values can provide useful indicators of changing demand. However, rising trade value does not always mean stronger underlying demand because prices can also influence the result. Separating volume, value, supplier participation, and pricing trends helps businesses develop a more accurate view of market momentum.
Supplier Activity Reveals Competitive Shifts
Trade records can show how supplier participation changes across countries and product categories. New exporters may enter established markets, while existing suppliers can gain or lose share. These movements can reveal competitive pressure, sourcing diversification, market entry, and changing procurement preferences.
- Supplier Signals: Changes in supplier shares, origins, shipment frequency, and buyer participation can reveal shifts in sourcing and competition.
- Pricing Signals: Changes in trade values and indicative unit prices can highlight differences in sourcing economics and competitive positioning.
Nexdigm’s Retail Trade Data Analysis Approach
Nexdigm combines trade intelligence with retail-sector knowledge, market research, competitive intelligence, pricing assessment, supplier research, and supply-chain analysis.
Our retail trade data analysis can examine product-level imports and exports, suppliers, buyers, countries, shipment activity, trade values, volumes, and indicative pricing.
This can help businesses understand which products are gaining demand, where supplier positions are changing, how pricing is evolving, and where new market or sourcing opportunities may be developing.
Understanding the Importance of Retail Trade Data
Trade data can provide several layers of intelligence when examined at product, supplier, market, and transaction levels. Nexdigm can use these signals to build a more detailed picture of retail-market movements.
- Product Demand: Import volumes and shipment activity can indicate changing demand across products and categories.
- Supplier Position: Supplier participation and market shares can reveal shifts in sourcing and competitive intensity.
- Pricing Movement: Indicative unit values can highlight differences in pricing across suppliers, products, and origins.
- Buyer Activity: Importer and buyer data can reveal active participants and emerging commercial relationships.
- Sourcing Shifts: Changes in country shares can indicate diversification, manufacturing shifts, or changing procurement strategies.
Taken together, these indicators help businesses move beyond headline trade figures and understand what is changing, where it is happening, and what those movements could mean commercially.
Nexdigm’s Retail Trade Data Analysis Framework
Nexdigm can structure retail trade data analysis through five connected steps, transforming fragmented trade information into focused business intelligence. This involves the following steps:
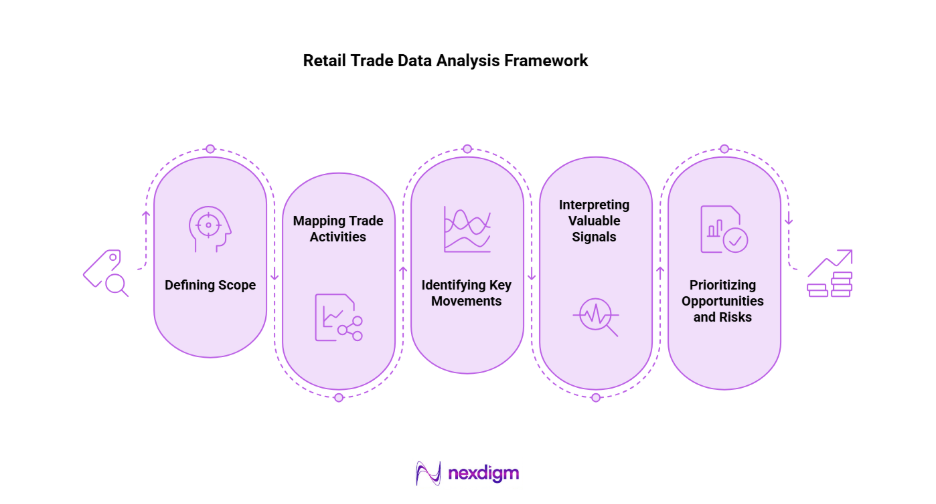
- Define the Scope: Identify the products, categories, countries, suppliers, buyers, and time periods relevant to the business question.
- Map Trade Activity: Analyze imports, exports, trade values, volumes, shipment activity, origins, destinations, suppliers, and buyers to establish the trade landscape.
- Identify Key Movements: Assess growth rates, supplier shares, pricing changes, shipment frequency, buyer participation, and sourcing shifts to identify significant market developments.
- Interpret the Signals: Connect trade findings with market research, company intelligence, competitive activity, consumer trends, pricing, and supply-chain conditions to understand the reasons behind observed movements.
- Prioritize Opportunities and Risks: Rank markets, products, suppliers, and trade relationships according to demand potential, competitive intensity, pricing, accessibility, sourcing attractiveness, and strategic relevance.
This framework enables businesses to progress from raw trade data to commercially relevant insights, creating a stronger basis for market expansion, sourcing, procurement, competitive positioning, and risk management.
Benefits of Nexdigm’s Retail Trade Data Analysis Framework
The framework can help businesses in the following areas:
- Spot Demand Changes: Identify products and markets showing stronger or weaker trade activity.
- Understand Supplier Movements: Track gaining, declining, emerging, and concentrated suppliers.
- Benchmark Pricing: Compare indicative trade prices across origins, suppliers, and markets.
- Identify New Buyers: Map active importers and emerging commercial participants.
- Find Sourcing Alternatives: Identify countries and suppliers that can reduce dependency.
By offering the following benefits is that Nexdigm’s framework helps businesses determine the changing and evolving trends within the trade data.
Nexdigm’s Case
Nexdigm used monthly trade-flow analysis to identify market shifts ahead of annual data. The approach helped a manufacturer achieve 18% export-volume growth, 24% higher distributor orders, and 15% fewer inventory gaps. By combining trade movements with market intelligence, Nexdigm enabled faster demand forecasting and more informed international market decisions.
To take the next step, simply visit our Request a Consultation page and share your requirements with us.
Harsh Mittal
+91-8422857704