

Container shipping is often compared through fleet size and freight rates. Those measures matter, but they reveal only part of the competitive picture. A carrier’s real position depends on how that fleet is deployed, how frequently it serves important ports, how much cargo can move without transshipment and how reliably the network performs when routes are disrupted.
The stakes are considerable. More than 80% of international goods trade by volume moves by sea, making liner shipping networks a critical component of global commerce. UNCTAD tracks fleet capacity, freight rates, liner connectivity and port traffic for precisely this reason. These variables determine how effectively carriers connect exporters and importers to major trade corridors.
Recent disruption has made the distinction between nominal and effective capacity particularly important. UNCTAD reported that global container shipping capacity grew by 10.1% in 2024, adding nearly 3 million TEUs. Yet much of that additional capacity was absorbed by longer voyages following Red Sea disruptions. Container demand itself increased 7.1% in 2024.
A carrier can therefore add ships without creating an equivalent increase in commercially available capacity on every route.
The route is the competitive unit
A shipping line’s global fleet is useful for benchmarking scale, but customers buy a service between particular origins and destinations.
Two carriers may both offer an Asia-Europe service while providing very different propositions. One may offer more direct port calls and weekly sailings. Another may rely more heavily on transshipment but compensate through broader feeder coverage or lower rates.
This becomes even more important when routes are disrupted. Rerouting around the Cape of Good Hope increased global ton-miles by roughly 6% in 2024, according to UNCTAD. Longer voyages consume vessel days, increase fuel and operating costs and alter the amount of capacity available to the network.
Consequently, competitive benchmarking has to examine the service architecture behind the quoted price.
Why the cheapest rate may not be the cheapest option
A freight rate is only one component of the shipper’s logistics cost. Additional transshipment, longer transit times, lower sailing frequency or greater schedule uncertainty can create costs elsewhere in the supply chain.
For example, a carrier offering a lower ocean rate may require an additional transshipment before the cargo reaches its destination. If that creates several extra days of transit and greater handling exposure, the apparent price advantage may disappear for a customer carrying time-sensitive inventory.
The same logic applies to port coverage. A carrier with direct access to a strategically important port can potentially offer a materially different service from one that reaches the same market through a feeder connection.
This is where shipping competitor market assessment services need to move beyond rate cards and fleet rankings. The objective is to understand the economics of the network that customers experience.
What a carrier benchmark should reveal
A useful competitive assessment can bring together five dimensions:
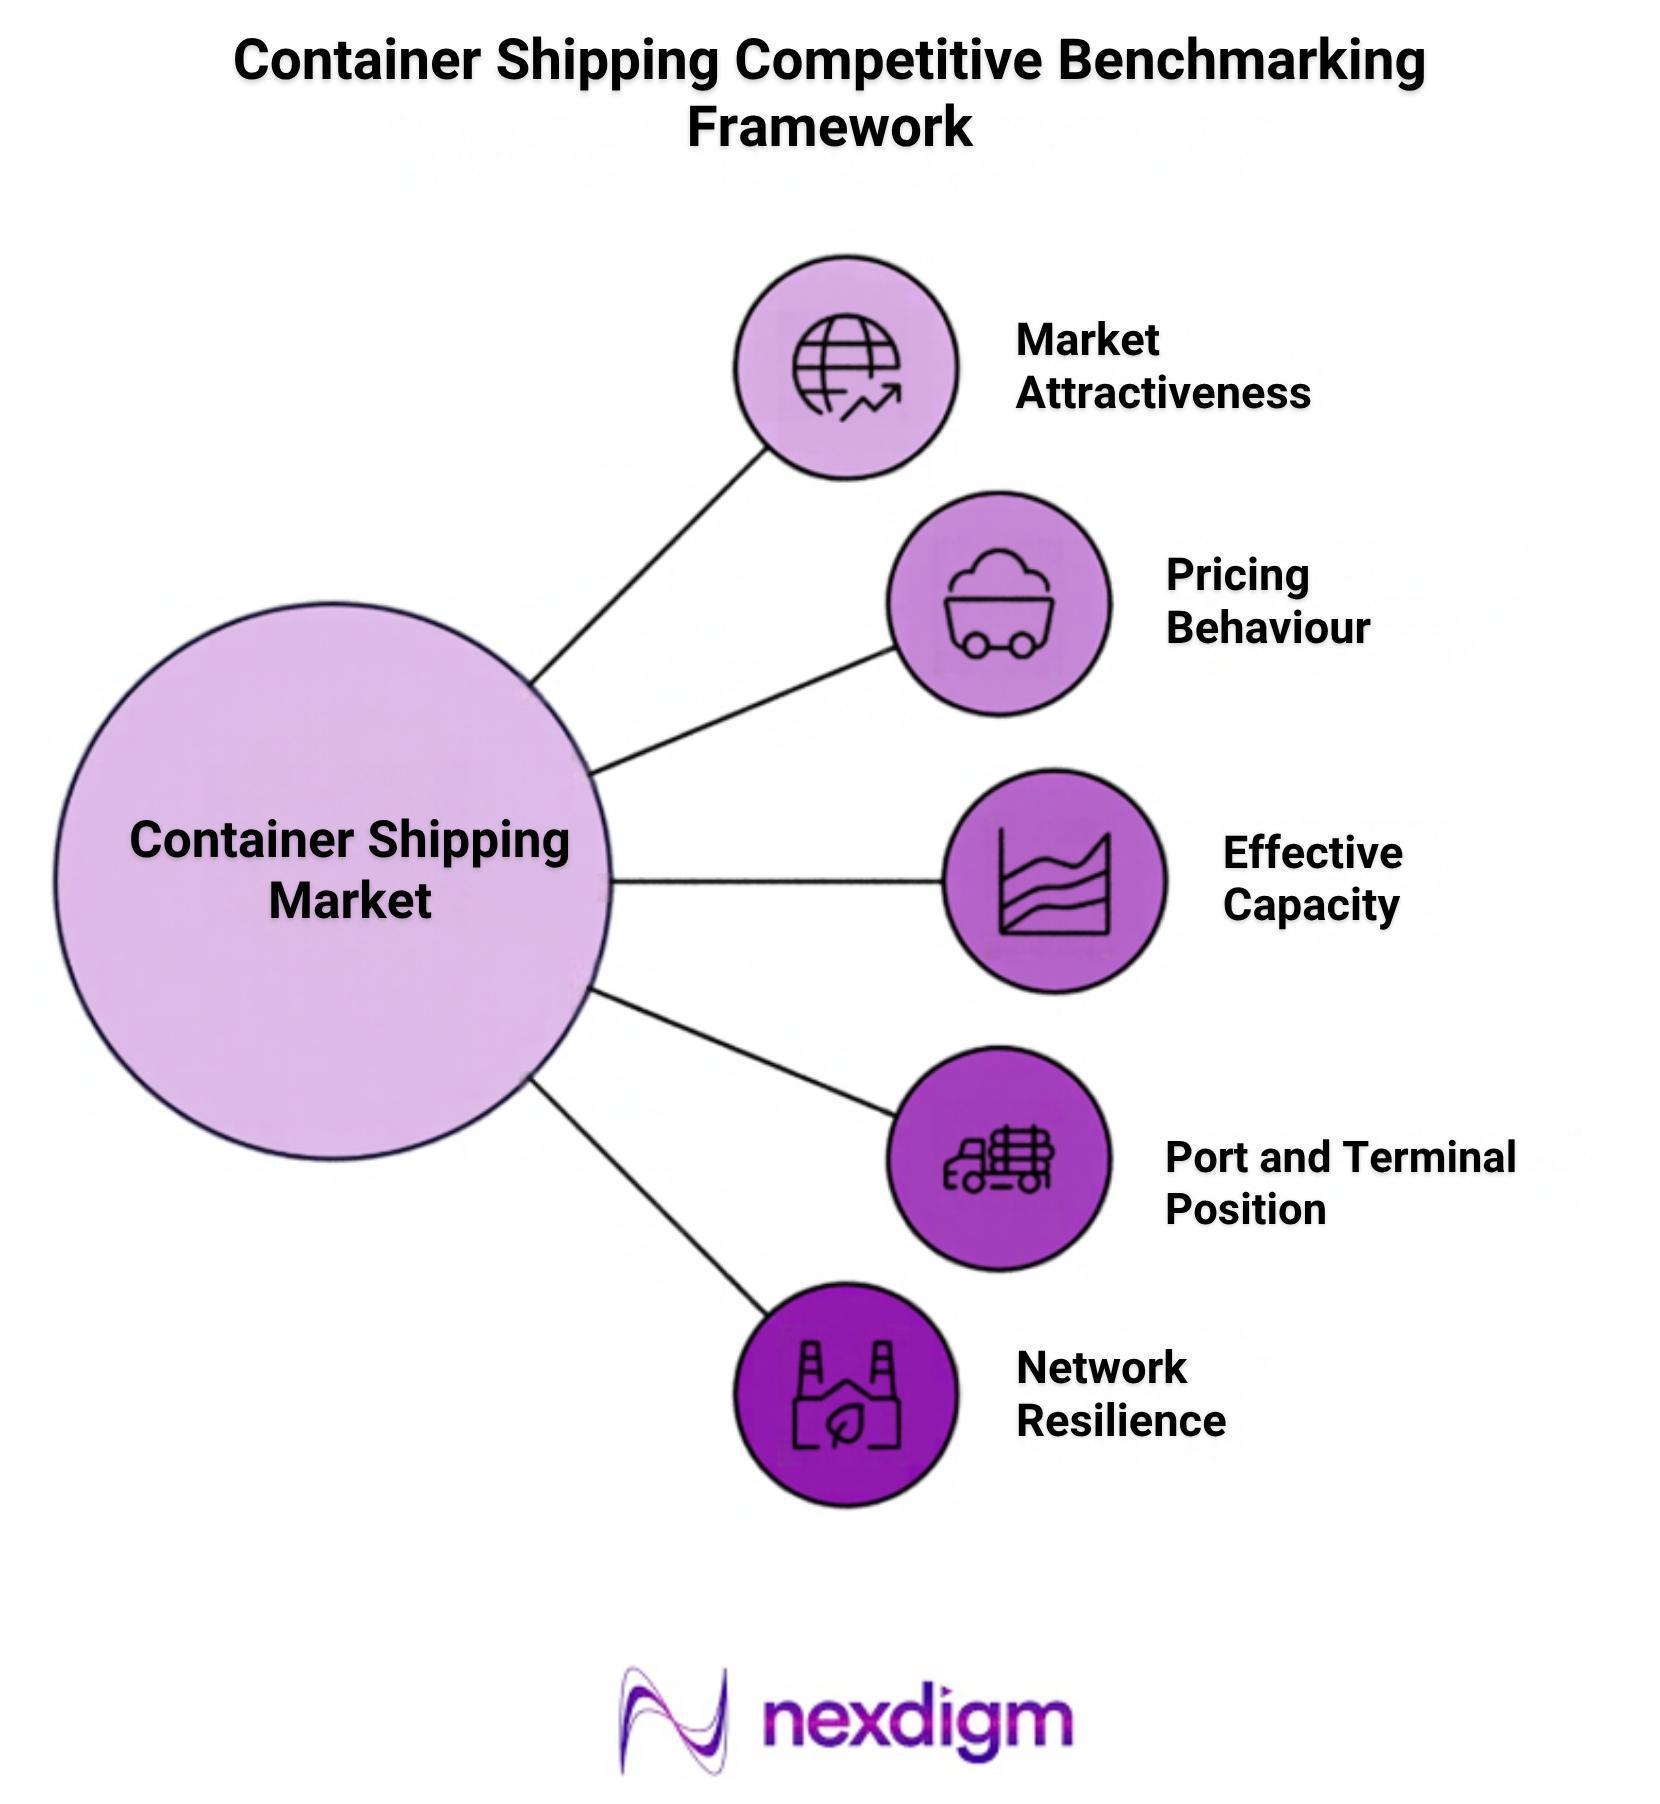
- Service architecture: Compare direct calls, transshipment patterns, sailing frequency, transit times and port pairs across priority lanes.
- Effective capacity: Track where vessels are deployed and how disruptions, longer voyages and blank sailings affect available capacity rather than relying only on total fleet size.
- Pricing behaviour: Compare spot and contract rates by corridor, season, equipment type and customer segment, while identifying how rates respond to changes in capacity.
- Port and terminal position: Examine terminal access, port connectivity, feeder networks and the ability to maintain service when individual gateways become constrained.
- Resilience under stress: Model how each carrier’s network performs when chokepoints close, ports become congested or vessel capacity is temporarily removed.
The resulting competitive picture can be quite different from a simple ranking by fleet size. A carrier with fewer vessels may have a stronger position on a particular corridor if its deployment is denser, its port coverage is better aligned with customer demand and its service requires fewer intermediate movements.
Nexdigm Case: Comparing Delivered Economics Across Trade Lanes
A Nexdigm competitive benchmark compared seven carriers across 18 trade lanes using freight rates, sailing frequency, transshipment, transit time and port coverage. The lowest quoted rate was also the lowest delivered-cost option on only seven lanes. On the remaining 11, network characteristics increased effective logistics costs by an estimated 6% to 13%.
To take the next step, simply visit our Request a Consultation page and share your requirements with us.
Harsh Mittal
+91-8422857704