

Forecasting specialty chemical demand through GDP growth or broad industry production can produce misleading results because specialty chemicals are often consumed according to application requirements rather than simply output volumes.
The amount of adhesive used per vehicle, additive used per tonne of polymer, coating applied per square meter and active ingredient used per hectare can all change even when the underlying end market remains stable.
That makes specialty chemical forecasting a bottom-up exercise.
Deloitte’s 2026 chemical outlook illustrates why. Chemical demand is expected to remain soft across several industrial end markets, while semiconductor demand provides a relative growth opportunity. Global semiconductor sales are projected to exceed $760 billion in 2026, and chemicals represent an estimated 9% to 14% of the bill of materials for electronic devices.
The chemical opportunity therefore depends on what happens inside the end market, not merely on its headline growth rate.
The forecast needs three moving parts
The supplied research proposes a three-variable forecasting architecture:
Specialty chemical demand = end-use growth × formulation intensity × customer adoption.
Each variable captures a different source of demand change.
- End-use growth determines how many units are being produced.
- Formulation intensity determines how much chemical is used per unit.
- Customer adoption determines how quickly the market moves from incumbent chemistry to the new formulation.
A forecast that ignores any one of these can materially misstate future demand.
End-use growth establishes the volume base
The first layer is the underlying production system.
For automotive chemicals, this could be vehicle production. For semiconductor chemicals, wafer starts and fab utilization may be more relevant. For construction chemicals, square meters built or tonnes of cement consumed can provide the underlying activity measure.
Deloitte expects semiconductor demand to remain one of the stronger chemical end-market opportunities in 2026, driven partly by AI-related data-center investment.
But even an attractive end market needs to be translated into chemical consumption.
A 10% increase in vehicle production does not necessarily create a 10% increase in every specialty chemical used in the vehicle.
Formulation intensity can change the forecast
The second variable is dosage.
EVs can require materially greater quantities of adhesives because of battery-pack bonding, potting and thermal-management applications. It also notes the opposite pattern in crop protection, where newer active ingredients can be used at dramatically lower application rates than older chemistries.
This creates two possible outcomes.
- A market can grow rapidly while chemical tonnage grows faster because formulation intensity is increasing.
- Or a market can grow while physical chemical demand stagnates because the product becomes more concentrated and dosage falls.
Revenue forecasting must therefore model both physical volume and price or value per unit.
Adoption determines when demand actually arrives
The third variable is customer adoption.
Industrial customers rarely switch formulations instantly. They may need laboratory testing, pilot production, certification, customer approval and equipment validation before a new chemical reaches full commercial use.
The supplied research describes this through S-curve adoption, with regulatory deadlines potentially accelerating adoption while industrial conservatism can delay switching for years.
This is particularly important for chemicals replacing regulated substances.
A new formulation may have a large theoretical addressable market, but the forecast needs to determine how many customers will actually requalify before the regulatory or commercial deadline.
Regulatory change needs scenario treatment
Regulation can create sharp demand changes, but it should not automatically be treated as immediate adoption.
The supplied research highlights regulatory slippage as a key forecasting risk. Legislative proposals can take years to become enforceable, while implementation may differ across jurisdictions.
A robust forecast should therefore model at least three possibilities:
- Accelerated transition, where regulation and customer economics push rapid adoption.
- Base transition, where customers migrate according to existing qualification cycles.
- Delayed transition, where regulatory implementation or customer approval takes longer than expected.
Demand forecasting must also control for inventory distortion
Distributor restocking can temporarily inflate apparent demand. Destocking can create the opposite effect.
This is particularly important in specialty chemicals because distributors and customers can hold significant inventories ahead of regulatory changes, supply disruptions or price movements.
A forecasting model should therefore distinguish structural end-use demand from channel inventory movement.
Where specialty demand can outperform the end market
The strongest opportunities arise when several variables move in the same direction.
A growing end market increases the number of units produced. A formulation transition increases chemical intensity. Customer adoption expands the addressable customer base. Together, these can create specialty chemical demand growth substantially above the underlying end market.
That is why a semiconductor chemical, EV adhesive or advanced coating may experience rapid growth even when the broader chemical industry is growing slowly.
Nexdigm’s demand forecasting architecture
A practical specialty chemicals demand forecasting consulting model can therefore be structured around a sequence of linked forecasts rather than one market CAGR.
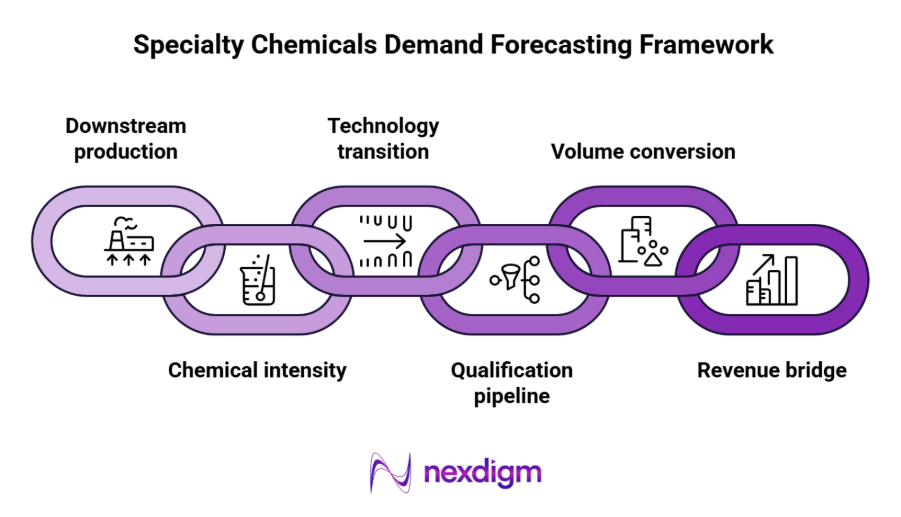
- Downstream production forecast
Project vehicles, buildings, electronics, packaging, agricultural output or other relevant end-use units. - Chemical intensity model
Calculate the amount of specialty chemicals required per unit and track expected changes in dosage. - Technology transition curve
Estimate substitution from incumbent formulations to new chemistries. - Qualification pipeline
Track customers through laboratory evaluation, pilot trials, certification and commercial approval. - Volume conversion
Translate adoption into actual tonnes, litres or units of chemical consumption. - Revenue bridge
Apply expected pricing, mix and premium assumptions to convert physical demand into revenue.
This approach makes the forecast traceable.
Nexdigm Case: Specialty Demand Forecast
A specialty additives producer with $72M revenue required a 2030 demand forecast. Nexdigm modelled 6 end markets, 19 formulations and 380 customer qualification paths, identifying a 13.6% CAGR versus 6.1% underlying end-market growth.
To take the next step, simply visit our Request a Consultation page and share your requirements with us.
Harsh Mittal
+91-8422857704