

Supply chain concentration is not automatically a vulnerability. A single supplier with multiple production sites, strong recovery capabilities, and adequate buffers may be more resilient than several suppliers operating in unstable conditions.
The real risk emerges when concentration is combined with long recovery times, limited substitutability, and poor visibility. For businesses operating complex, multi-tier networks, understanding where a disruption can actually stop production or customer fulfilment is becoming more important than simply counting suppliers.
Where Does Supply Chain Risk Actually Sit?
Supply chain disruptions can originate far beyond a company’s immediate suppliers. A Tier-2 manufacturer, transport corridor, port, or technology system can become a critical dependency without appearing in conventional supplier risk assessments.
Key disruption points include:
- Sub-tier supplier failures: Fires, insolvencies, equipment failures, or quality problems affecting critical inputs.
- Geopolitical disruption: Tariffs, sanctions, export restrictions, or border closures interrupting material flows.
- Ports and transport corridors: Choke-point closures, congestion, strikes, or infrastructure failures delaying critical shipments.
- Cyber incidents: Attacks on ERP, warehouse, or carrier systems disrupting physical operations.
- Climate and extreme weather: Floods, storms, and other events affecting facilities, roads, and energy infrastructure.
The important question is not simply whether a node can fail, but what happens to the rest of the network when it does.
A Supplier Failure Becomes Serious When Recovery Takes Too Long
Two measures provide a more useful view of this exposure: Time-to-Recover (TTR) and Time-to-Survive (TTS).
TTR measures how long it would take to restore a disrupted supplier, facility, or transport node. TTS measures how long the business can continue serving demand using available inventory and alternative capacity.
When TTR exceeds TTS, the network has a vulnerability. Inventory buffers run out before the affected capacity can be restored, creating the potential for production stoppages, lost sales, and contractual penalties.
This means risk needs to be evaluated at the level where disruption occurs, critical component SKUs, supplier nodes, distribution facilities, and transport corridors.
Resilience Comes with a Cost
There is no cost-free way to eliminate supply chain exposure. Businesses can reduce vulnerability through:
- Dual sourcing: Splitting volumes across independent suppliers to reduce single-source dependency.
- Strategic safety stock: Increasing inventory buffers for components with long recovery times.
- Alternative transport routes: pre-qualifying secondary carriers, ports, and freight corridors.
- Tooling redundancy: Maintaining transferable tooling or production capability at alternative facilities.
The commercial challenge is deciding where these investments are justified. Applying resilience measures across every supplier and SKU can create unnecessary inventory and operating costs. Concentrating them on the few dependencies capable of causing significant disruption can provide stronger protection with less capital.
Risk Needs to Be Prioritized, Not Just Documented
A conventional risk register can identify hundreds of potential disruption events without showing which ones actually threaten revenue.
A more useful assessment connects each critical dependency to its recovery profile, inventory coverage, financial exposure, and available mitigation options. This allows supply chain leaders to distinguish between risks that are inconvenient and those that could stop production.
Nexdigm’s supply chain risk assessment applies this approach by mapping multi-tier dependencies, evaluating TTR and TTS, and stress-testing disruption scenarios to identify where resilience investment can have the greatest impact.
How Nexdigm Maps and Prioritizes Supply Chain Vulnerabilities
Nexdigm evaluates network resilience through a structured diagnostic:
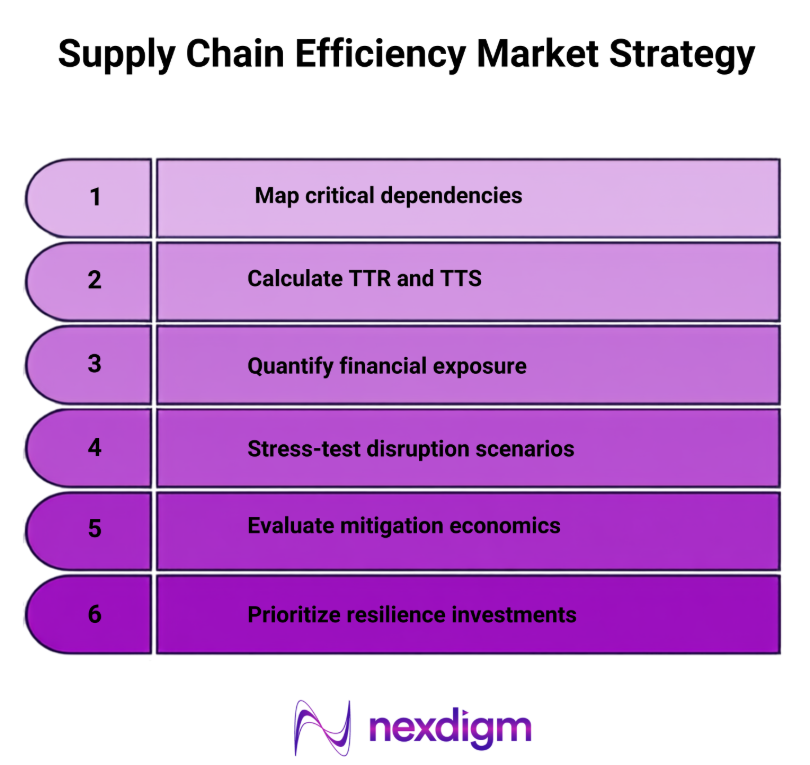
- Map critical dependencies: Trace bills of materials and transport flows beyond Tier-1 suppliers to identify hidden concentration.
- Calculate TTR and TTS: Establish recovery requirements and available inventory or capacity buffers for critical nodes.
- Quantify financial exposure: Estimate lost contribution, penalties, and other costs when recovery exceeds available survival time.
- Stress-test disruption scenarios: Model supplier failures, port closures, transport interruptions, and other high-impact events.
- Evaluate mitigation economics: Compare dual sourcing, safety stock, alternate routes, and redundancy against their cost.
- Prioritize resilience investments: Focus resources on dependencies where disruption exposure and financial consequences are highest.
How Nexdigm Reduced Critical Supply Chain Exposure by 72%
A heavy industrial equipment manufacturer relied on 210 Tier-1 suppliers and 4,200 component SKUs. Nexdigm identified 14 critical component families with an average TTR of 118 days against just 14 days of available inventory and introduced selective dual sourcing, targeted safety stocks, and alternate transport routes. The program reduced disruption vulnerability by 72%, while increasing overall working-capital holding costs by only 1.8%.
To take the next step, simply visit our Request a Consultation page and share your requirements with us.
Harsh Mittal
+91-8422857704