

Technology markets create an unusual economic problem: the fastest-growing part of an industry is not necessarily where the greatest value is captured.
Artificial intelligence provides a useful example. The expansion of AI applications is increasing demand across semiconductors, networking, memory, data centres, cloud infrastructure, software platforms and integration services. Gartner forecasts worldwide AI spending of $2.7 trillion in 2026, with infrastructure accounting for more than 45% of spending. Semiconductor revenue alone is forecast to reach $1.6 trillion in 2026.
This changes how investors, technology companies and corporate strategy teams need to examine the technology value chain.
Growth Does Not Tell You Where the Profit Sits
Revenue growth can occur at several layers simultaneously while economic returns remain concentrated in only a few.
Semiconductor equipment requires specialised intellectual property and manufacturing expertise. Foundries require enormous capital investment and process capabilities. Cloud infrastructure requires data centres, networking, energy and purchasing scale. Software platforms benefit from recurring revenue and switching costs. Systems integration remains more dependent on human delivery capacity.
The commercial characteristics of each layer are therefore different even when all benefit from the same technology cycle.
Scarcity Creates the First Value-Capture Point
The strongest positions tend to emerge where customers have limited alternatives.
A technology supplier with highly specialised intellectual property can command different economics from a services provider with many substitutable competitors. Similarly, semiconductor manufacturing capacity cannot be expanded as easily as software capacity because new fabrication facilities require significant capital, specialised equipment and years of process development.
AI is reinforcing some of these constraints. Gartner expects AI infrastructure demand to remain a major driver of spending as hyperscalers and service providers expand capacity for increasingly demanding workloads.
The question for investors is therefore not simply which market is growing fastest. It is which layer controls a constraint that customers cannot easily bypass.
Capital Intensity Changes the Return Profile
Capital intensity creates another dividing line.
Cloud infrastructure and semiconductor manufacturing require substantial investment before revenue can be generated. Software businesses generally have lower physical capital requirements, allowing incremental revenue to scale differently.
But lower capital intensity does not guarantee higher returns. Software providers can face rising infrastructure and inference costs when their products depend heavily on external compute.
AI introduces a particularly important cost interaction. Deloitte’s 2026 research describes token consumption as a new economic unit for AI spending and highlights the need to connect model routing, infrastructure choices and FinOps to enterprise economics.
A value-chain analysis therefore needs to track both revenue growth and the cost required to serve that revenue.
Switching Costs Can Be More Valuable Than Market Share
Economic value can also accumulate where customers find it difficult to leave.
Enterprise systems that become embedded in operational processes can create substantial migration costs. Data structures, integrations, employee familiarity, regulatory requirements and historical records can all increase switching friction.
This creates a different kind of moat from physical scarcity. A software platform may not control a manufacturing bottleneck, but it can control a critical operational relationship.
For investors and corporate strategists, customer switching costs therefore need to be evaluated alongside market share, margins and growth.
Value Can Move When the Architecture Changes
Technology value chains are not static.
AI can shift economics toward compute, networking, memory and data-centre infrastructure while simultaneously changing the economics of application software. Open-source technologies can weaken proprietary software advantages. New hardware architectures can create new component dependencies. Cloud abstraction can commoditise one infrastructure layer while increasing the importance of another.
A technology value chain market analysis therefore needs to examine where economic value is moving, not simply where it currently sits.
How Nexdigm Maps Value Capture
Nexdigm can assess technology value chains across five connected dimensions:
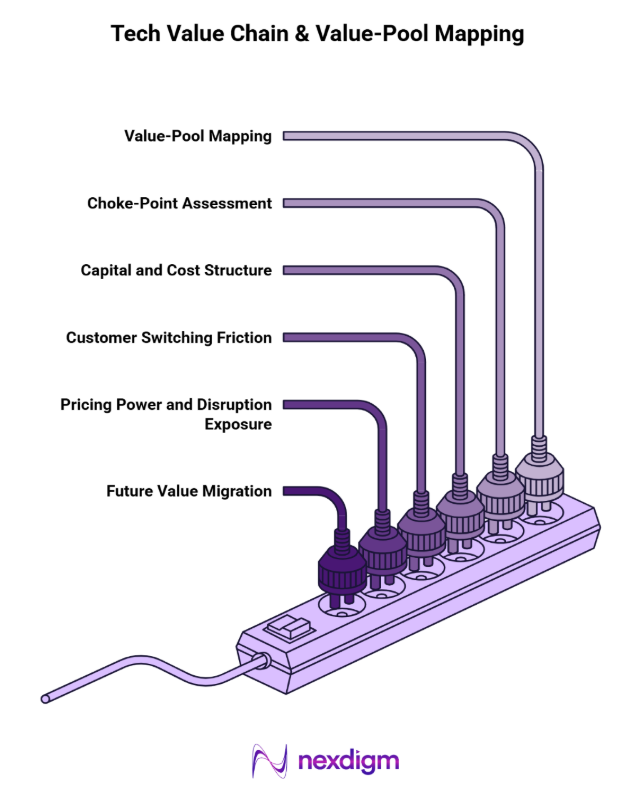
- Value-Pool Mapping: Quantifies revenue, growth and profitability across each layer of the ecosystem to identify where economic returns are concentrated.
- Choke-Point Assessment: Maps critical technologies, suppliers, components and capacity constraints to identify dependencies that create pricing power.
- Capital and Cost Structure: Compares capital expenditure, operating costs, R&D intensity and free-cash-flow characteristics across competing layers.
- Customer Switching Friction: Measures data gravity, integration depth, contractual dependency and operational disruption associated with changing suppliers.
- Pricing Power and Disruption Exposure: Tests the ability to sustain pricing against alternative technologies, new entrants, open-source solutions and architectural shifts.
- Future Value Migration: Models how changes in technology architecture, demand and infrastructure requirements could redistribute value across the chain.
The resulting analysis can support investment screening, acquisition strategy, supplier-risk assessment, portfolio positioning and technology-market entry decisions.
A 20% Valuation Gap Changed the Deal
Nexdigm advised an Indian financial institution evaluating a strategic investment in a Bangalore-based enterprise technology company serving banking, NBFC, microfinance and telecom clients. Nexdigm assessed the target’s valuation, including liquidity and control discounts and the impact of its ESOP pool. The resulting valuation was 20% below the target’s asking price, and the client ultimately closed the transaction at only 1% above Nexdigm’s recommended valuation.
To take the next step, simply visit our Request a Consultation page and share your requirements with us.
Harsh Mittal
+91-8422857704