

Import and export values are convenient measures of market activity, but they can conceal the changes that matter most to a business. A market may appear to expand because prices have risen, while physical volumes remain flat. Supplier concentration may increase even as the number of exporting countries grows. An exporter may gain share without improving its cost position because competitors are temporarily constrained.
A sound trade assessment uses several methods together to understand the underlying market structure and the implications for commercial performance.
Volume Analysis: Determine Whether Demand Is Actually Growing
Trade value should be examined alongside physical quantity wherever the data allow. Rising value and rising volume may indicate genuine expansion, while rising value with stable or falling volume can signal higher prices, a change in product mix or tighter supply.
Quantity data are not always directly comparable. Different reporting countries may use different supplementary units, and a product category may combine goods whose physical characteristics vary substantially. Analysts should check the unit of measurement and the scope of the product code before comparing shipments.
Time periods matter as well. Annual data can hide seasonal demand, inventory cycles, and temporary disruptions. Monthly or quarterly data can help identify turning points, although reporting delays and incomplete coverage may make the latest period less reliable than historical annual totals.
Pricing Analysis: Use Unit Values Carefully
Unit value is calculated by dividing reported trade value by quantity. It can help identify changes in the average value of traded products, but it should not be treated as a quoted market price. The calculation may combine different grades, quality specifications, shipment sizes, and contract arrangements.
The valuation basis also matters. Export values are commonly recorded on a free-on-board basis, while import values are often reported on a cost-insurance-freight basis. The inclusion of freight and insurance can create differences between partner-country records even when they refer to the same underlying trade flow.
For standardised commodities, recognised market benchmarks can help interpret unit-value changes. For manufactured goods, the analyst may need to combine trade data with product specifications, supplier quotations, and freight information. The aim is to establish whether a change reflects price, product mix, or logistics rather than assuming that all three represent the same commercial movement.
Concentration Analysis: Measure Dependence on Individual Suppliers
A market’s total imports reveal little about the risks created by its supplier structure. Two destinations may import the same value of a product, but one may rely on a single supplier country while the other sources from several competitive markets.
A concentration measure such as the Herfindahl-Hirschman Index can help quantify how trade shares are distributed. It is calculated by summing the squared market shares of suppliers. Higher concentration indicates that a larger proportion of trade is associated with fewer sources. The result should be interpreted alongside supplier reliability, substitutability, and the time required to qualify alternatives.
Concentration is not automatically negative. A dominant supplier may offer scale, consistent quality, or competitive prices. The commercial concern arises when dependence combines with disruption exposure, limited alternatives or weak negotiating leverage.
Competitiveness: Examine Market Share Alongside Cost and Capability
The trade analysis methods used to compare suppliers should explain more than which country exports the most. Analysts can compare changes in market share, unit values and shipment quantities, then investigate possible explanations through production costs, capacity additions, trade agreements, and customer relationships.
A supplier gaining share while maintaining stable unit values may be expanding its competitive position, but this remains a hypothesis until the underlying drivers are verified. A supplier gaining share because competitors face temporary restrictions may not retain the advantage once conditions normalise.
The World Trade Organization’s October 2026 outlook highlighted how AI-related investment and disruptions in energy and fertiliser markets were affecting trade differently across product categories. This is a reminder that aggregate trade growth can conceal sharply different sector-level conditions. Competitive analysis should therefore be conducted at the most useful product and destination level.
Combine the Methods into One Commercial Interpretation
The methods become more valuable when they are read together. Rising import volume, stable unit values, and a broadening supplier base may indicate growing demand and opportunities for additional vendors. Rising values, flat volume, and greater concentration may instead indicate price pressure and supply risk.
Analysts should document the explanation behind each conclusion and identify where the evidence is incomplete. Data quality, classification changes, reporting delays, and inconsistent units can materially affect the result. A confident recommendation requires checking those issues before interpreting the pattern.
Nexdigm’s Trade Analysis Methods Framework
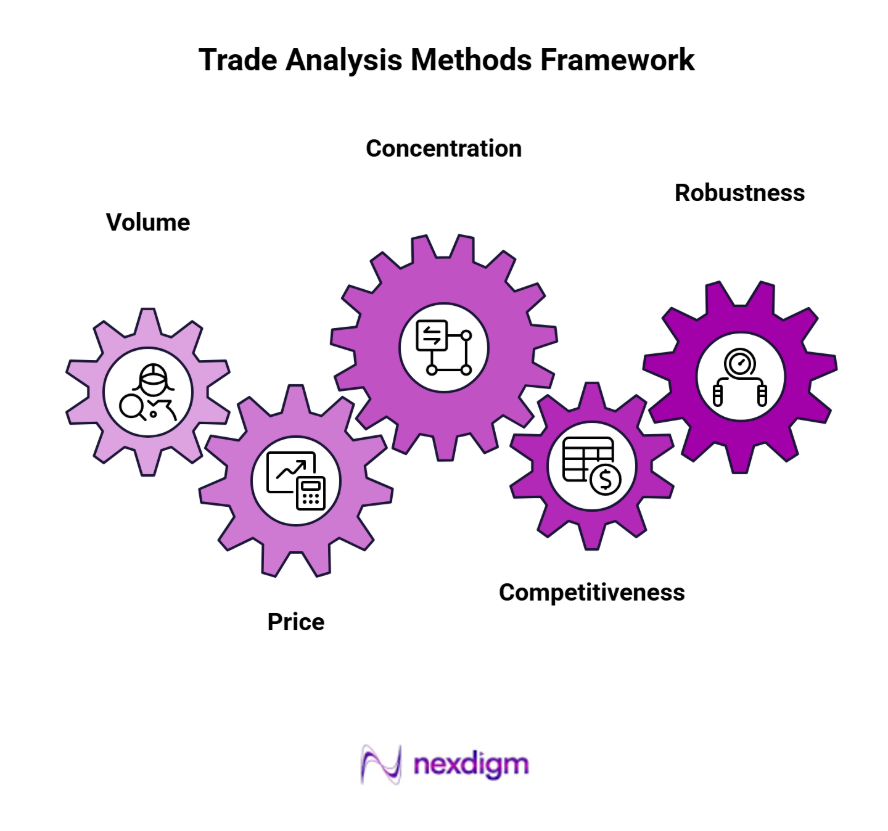
- Volume: Measure physical movement over time and check for seasonal or inventory effects.
- Price: Interpret unit values against product mix, valuation basis, and relevant benchmarks.
- Concentration: Quantify supplier dependence and assess the availability of credible alternatives.
- Competitiveness: Compare market share changes with costs, capabilities, and evidence of structural advantage.
- Robustness: Test whether the conclusion survives alternative periods, data sources, and plausible market scenarios.
Nexdigm’s Case Study
A procurement team evaluating specialised metal components compared supplier quotations from 3 countries across 12 product specifications. An initial review showed price differences of up to 20%, raising concerns about the competitiveness of certain sources. Nexdigm’s trade assessment examined unit values, product classifications, shipment volumes and transport costs, revealing that differences in product mix and delivery terms accounted for part of the apparent gap.
After standardising specifications and comparing delivered costs, the team established a more consistent basis for supplier negotiations and sourcing decisions, reducing the risk of choosing suppliers on headline prices alone.
To take the next step, simply visit our Request a Consultation page and share your requirements with us.
Harsh Mittal
+91-8422857704