

Trade data can show where products are being purchased, how supplier positions are changing, and which routes are becoming more important to international commerce. It can also mislead companies that interpret higher export values as stronger demand or assume that a country gaining market share has developed a durable competitive advantage.
The commercial value lies in reading trade values alongside quantities, unit values, supplier concentration, and changes in sourcing relationships. Together, these indicators help businesses distinguish genuine demand growth from price effects and identify supply-chain changes that may affect market entry, procurement, or investment.
Demand Must Be Separated From Price and Volume
An increase in import value can result from higher quantities, higher prices, or a combination of both. The distinction is especially important for commodities and products exposed to volatile input costs. A market purchasing the same volume at a higher price may generate more trade value without creating additional demand for suppliers.
The World Trade Organization’s global trade statistics illustrate this issue. In the first half of 2026, world merchandise trade value rose 15% year on year, while trade volume increased by 3.5%. The gap reflected price movements in areas including fuels and electronic components used in data centres. For companies assessing market growth, the figures show why nominal values need to be checked against volume trends.
Analysts should also examine the time period. Imports may rise temporarily when buyers build inventory ahead of tariff changes, anticipated shortages or expected price increases. Comparing monthly and quarterly movements with multi-year patterns helps identify whether a change is persistent or driven by timing.
Unit Values Offer Clues, Not Definitive Market Prices
Dividing trade value by quantity produces a unit value that can help identify changes in the average value of traded products. However, it should not be treated as a quoted transaction price. The calculation may combine different grades, product specifications, shipment sizes, contract terms, and reporting conventions.
Export and import valuations can also differ. Export statistics are commonly reported on a free-on-board basis, while imports are often reported on a cost-insurance-freight basis. Transport and insurance can therefore contribute to differences between a country’s reported exports and its partner’s reported imports.
The World Bank’s commodity data provide a useful complementary source for tracking price movements in standardised commodities. Its October 2026 update reported that the energy price index rose 25.7% in September, led by crude oil and natural gas, while the non-energy index increased by 1.3%. These broad movements can help companies interpret trade-value changes, but product-specific contracts and grades still require separate analysis.
Supplier Share Changes Can Reveal Competitive Pressure
Trade data can show whether a market is becoming more dependent on one source or diversifying across suppliers. Rising concentration may strengthen established exporters but create exposure for buyers if supply is disrupted. A more diverse supplier base can indicate opportunities for entrants, although it may also intensify price competition.
Companies should investigate the reasons behind share changes. A supplier gaining ground may have improved its cost position, secured better logistics, benefited from a trade agreement or moved production closer to customers. It may also have gained temporarily because competing suppliers faced shipping delays or production interruptions.
A trade data analysis should therefore compare market shares with unit values, quantities, trade policy changes, and evidence of production capacity. This helps determine whether a supplier’s advantage is structural and whether a new entrant can realistically compete.
Supply Chain Shifts Affect More Than the Final Product
Trade flows include intermediate goods that move between countries before becoming part of a finished product. Changes in these flows can reveal where production networks are being reorganised and which countries are gaining a larger role in manufacturing.
The OECD’s 2026 report on global value chains found that imported goods and services used in world production remained near their historical peak in real terms in 2024. It also found that recent changes reflected shifts across sectors and sourcing structures more than a broad retreat from global supply chains. This challenges the assumption that companies are simply bringing production home. In many cases, supply chains are being reconfigured rather than shortened.
For suppliers, the implication is to look beyond final-product imports. Rising trade in components, machinery and industrial inputs may signal emerging production clusters that could require additional suppliers, technical services, and logistics capacity.
What Trade Data Can and Cannot Establish
Trade statistics are strongest when identifying patterns across products, countries, and time periods. They are less suited to explaining buyer intent, contract terms or the exact cause of a sourcing decision without supporting evidence.
Before acting on a signal, companies should validate it through customer research, competitor disclosures, industry capacity data, regulatory changes and logistics assessments. The objective is to establish whether a pattern represents a commercial opportunity, a temporary disturbance, or a risk that requires contingency planning.
A Trade Signal-to-Action Framework
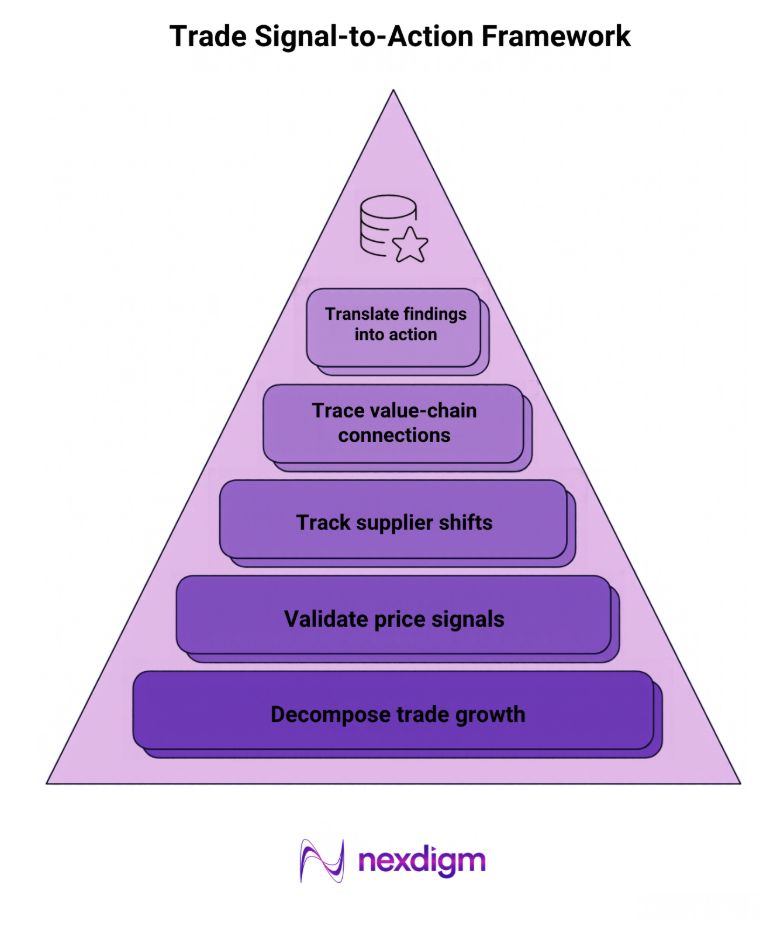
- Decompose trade growth: Separate changes in value, volume, and unit value to identify the main source of movement.
- Validate price signals: Compare unit values with relevant commodity benchmarks, product specifications, and freight costs.
- Track supplier shifts: Measure market-share changes and investigate their operational, policy or competitive drivers.
- Trace value-chain connections: Examine intermediate-goods flows and related imports to identify changing production locations.
- Translate findings into action: Adjust market priorities, sourcing strategies, or pricing assumptions only after commercial validation.
Nexdigm Case Study
An exporter reviewed three years of trade data across five destination markets. Volume and unit-value analysis showed that one market’s apparent growth was largely price-driven, while another had sustained quantity growth and a more diversified supplier base. The company prioritised the second market for customer validation and entry planning.
To take the next step, simply visit our Request a Consultation page and share your requirements with us.
Harsh Mittal
+91-8422857704