
Consumer preference reveals how travelers choose, compare, and experience hospitality offerings across destinations. Without structured surveys, decisions rely on assumptions rather than verified guest motivations and expectations. Gaps in demand intelligence weaken tourism positioning, product design, and service delivery consistency.
-
Misaligned Market Positioning
Brands target segments inaccurately, diluting destination identity and confusing value propositions for international and domestic travelers across channels and touchpoints over time.
-
Ineffective Product Development
Amenities and experiences are designed without validated preferences, leading to underused facilities and poor return on investment across property portfolios and seasons mix.
-
Weak Pricing Strategy
Rates are set without willingness-to-pay insights, causing discount dependence, revenue leakage, and unstable demand patterns across segments and booking windows over cycles periods.
-
Service Experience Gaps
Operational standards miss priority touchpoints, reducing satisfaction, reviews, and repeat visitation across guest journeys from arrival to departure and post-stay engagement phases loops.
-
Inefficient Marketing Spend
Campaigns ignore channel and message preferences, lowering conversion, wasting budgets, and weakening brand recall in source markets and travel cycles and cohorts segments.
-
Poor Destination Planning
Infrastructure and capacity decisions lack visitor intent data, creating congestion in peaks and underutilization off-season across attractions, transport, and accommodation nodes areas zones.
-
Limited Competitive Intelligence
Benchmarking against rivals misses perception drivers, obscuring differentiation opportunities and partnership alignment across regions, segments, and experience clusters over time and channels platforms.
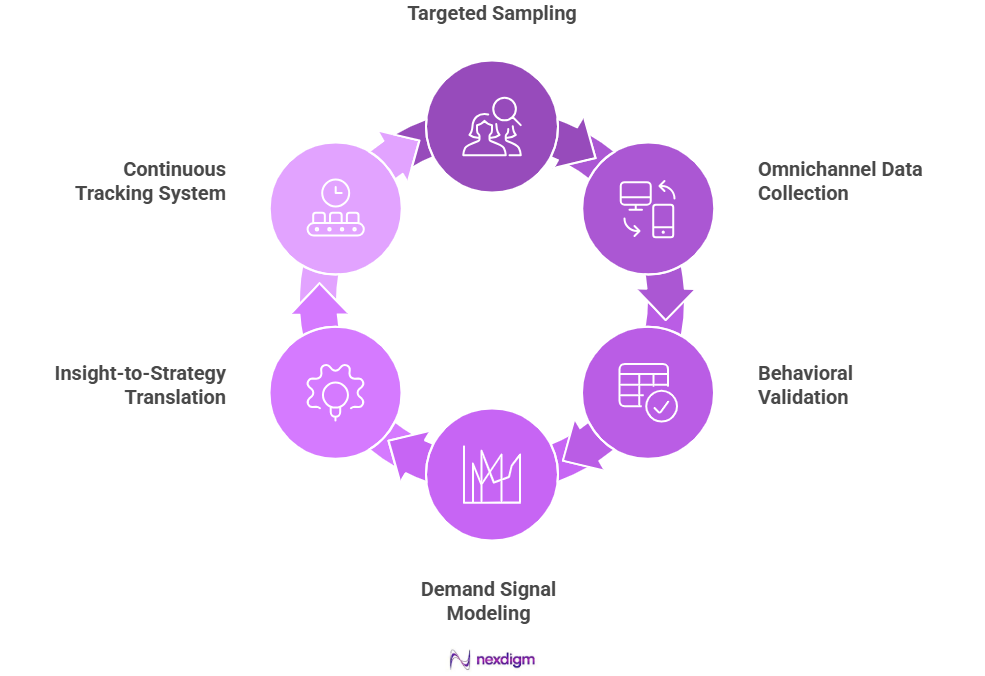
How Nexdigm Streamlines Consumer Preference Survey Analytics
Nexdigm applies structured hospitality consumer research to capture authentic traveler preferences across markets and segments. Integrated analytics convert survey responses into actionable demand signals for pricing, product, and experience design.
Methods combine field collection, behavioral validation, and interpretation frameworks tailored to tourism strategy needs.
-
Targeted Sampling Architecture
Defines source markets, traveler cohorts, and trip purposes, ensuring representative coverage across leisure, business, and domestic segments for reliable insights at property and destination levels scales.
-
Omnichannel Data Collection
Deploys multilingual surveys via online panels, intercepts, QR touchpoints, and partner databases to capture pre, in, and post-stay feedback comprehensively with traveler identifiers and sampling controls.
-
Behavioral Validation Layer
Matches stated preferences with booking, spend, and review data to correct bias and reveal true drivers of choice and satisfaction across channels and stay contexts segments.
-
Demand Signal Modeling
Translates preference scores into segment demand curves, willingness-to-pay bands, and feature priorities supporting pricing, packaging, and capacity decisions by market, season, and property tier levels types.
-
Insight-to-Strategy Translation
Outputs map segments, journeys, and expectations into product roadmaps, experience standards, and go-to-market plans aligned with tourism growth objectives for brands, clusters, and destinations authorities stakeholders.
-
Continuous Tracking System
Establishes periodic waves and dashboards to monitor preference shifts, campaign impact, and service performance, enabling timely course correction across markets, segments, and properties and partners networks.
Nexdigm Case
A coastal resort cluster in central Vietnam engaged Nexdigm to decode shifting traveler preferences after occupancy plateaued despite rising arrivals. Surveys across five source markets showed 62% guests prioritized cultural immersion over beach amenities. Repositioned experiences and targeted campaigns lifted direct bookings 28% and RevPAR 18% within two seasons. Satisfaction scores improved from 4.1 to 4.6, and repeat visitation rose 22%, validating data-led tourism strategy realignment.
To take the next step, simply visit our Request a Consultation page and share your requirements with us.
Harsh Mittal
+91-8422857704