

Warehouse competition is increasingly about where capacity sits, who occupies it and how difficult it would be for another operator to replicate. A large portfolio can provide scale, but a smaller footprint concentrated around high-demand corridors may produce better utilisation, stronger rents and more durable customer relationships.
India’s Grade A industrial and warehousing stock has expanded sharply, reaching around 300 million sq. ft. across the broader market, almost twice the inventory recorded in 2021. Yet activity remains concentrated. Colliers identified 13 high-activity clusters that have accounted for roughly three-quarters of industrial and warehousing demand and new supply over the past five years.
That concentration changes the meaning of market share. Owning or controlling space in a high-velocity logistics cluster can matter more than simply accumulating square footage across multiple weaker markets.
The most valuable capacity is difficult to reproduce
Warehouse competition has several layers. Physical ownership is the most obvious, but access to development land, relationships with occupiers, proximity to highways and ports, building specifications and the ability to add capacity all influence competitive strength.
H1 2026 provides a useful illustration. Around 22 million sq. ft. of Grade A industrial and warehousing space was absorbed across India’s top eight cities, up 12% year on year. Delhi NCR and Chennai alone accounted for more than 45% of leasing. At the same time, approximately 25 million sq. ft. of new Grade A supply was completed.
The implication is important for competitor analysis. New supply can weaken occupancy in some locations while leaving strategically positioned facilities relatively protected. In Q1 2026, for example, vacancy across the top eight cities increased to 16.7% as supply outpaced demand, while average rents remained broadly stable across most major cities.
A warehouse operator’s position therefore depends on the quality of its capacity, not simply the amount.
Customer mix can reveal who really has pricing power
Tenant composition is another useful way to compare warehouse operators.
A portfolio dominated by a single large e-commerce customer may generate strong occupancy but also create concentration risk. A diversified portfolio across 3PL, manufacturing, retail and consumer businesses may have more stable demand, particularly where leases expire at different times.
The customer mix is also changing. CBRE reported that 3PL and engineering and manufacturing occupiers accounted for 31% and 26% of H1 2026 absorption respectively, while Delhi NCR, Chennai and Bengaluru together represented around 60% of total leasing. Institutional investors backed 33% of new warehousing supply during the period.
This makes tenant relationships a competitive asset. Operators with established relationships in high-growth customer segments can potentially lease new capacity faster and defend occupancy better than providers entering those markets without an existing account base.
What Nexdigm would examine before calling a portfolio “dominant”
A warehousing competitor market assessment research exercise should distinguish between capacity that exists and capacity that creates competitive advantage.
Five measures provide a more useful picture:
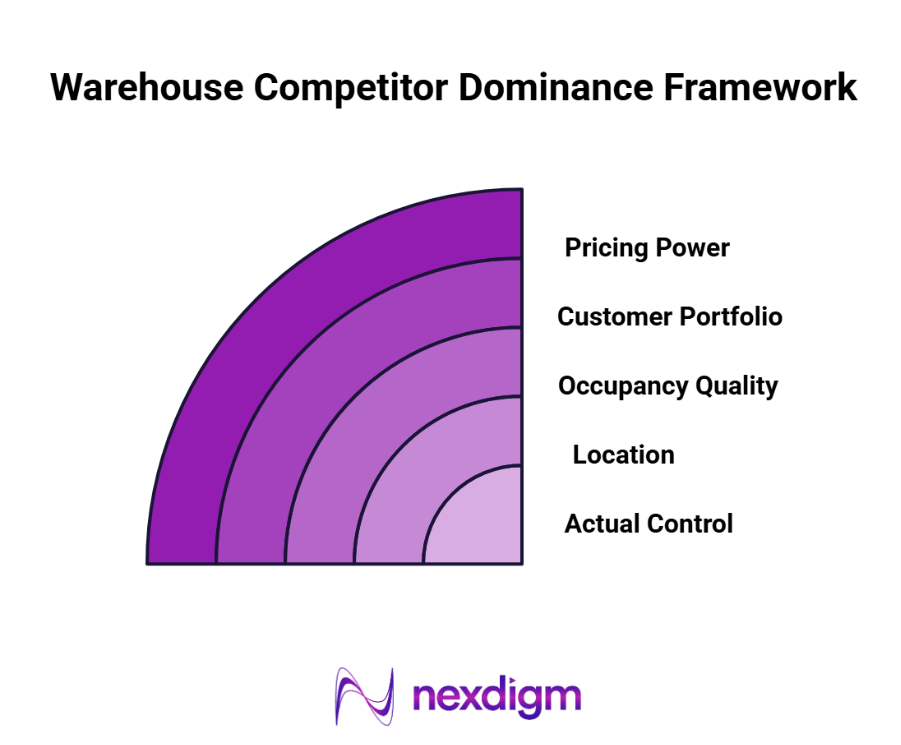
- Establish actual control. Separate owned, leased, managed and pipeline capacity so that portfolio comparisons do not treat fundamentally different positions as equivalent.
- Grade the location. Evaluate proximity to consumption centres, manufacturing clusters, ports, airports, highways, labour and competing logistics hubs.
- Test occupancy quality. Look beyond headline occupancy to lease tenure, rollover exposure, vacancy duration and the concentration of major tenants.
- Understand the customer portfolio. Compare sectors, account concentration, shipment intensity and the potential for customers to expand within the operator’s network.
- Measure pricing power. Benchmark achieved rents, rental premiums, incentives and vacancy resilience against competing facilities in the same micro-market.
This can produce a very different competitive ranking from a simple square-footage league table. A smaller operator may have less total capacity but stronger economics if its buildings sit in constrained corridors and serve customers with fewer alternatives.
Nexdigm Case: Testing Warehouse Market Control
A Nexdigm competitive assessment benchmarked 26 warehouse operators across four major logistics markets, combining controlled capacity, occupancy, tenant concentration, achieved rents and development pipelines. The five largest operators controlled 58% of Grade A capacity, but three mid-sized providers achieved higher rents per sq. ft. because of stronger micro-market positioning and a more diversified customer base.
To take the next step, simply visit our Request a Consultation page and share your requirements with us.
Harsh Mittal
+91-8422857704