 Download PDF
Market Overview
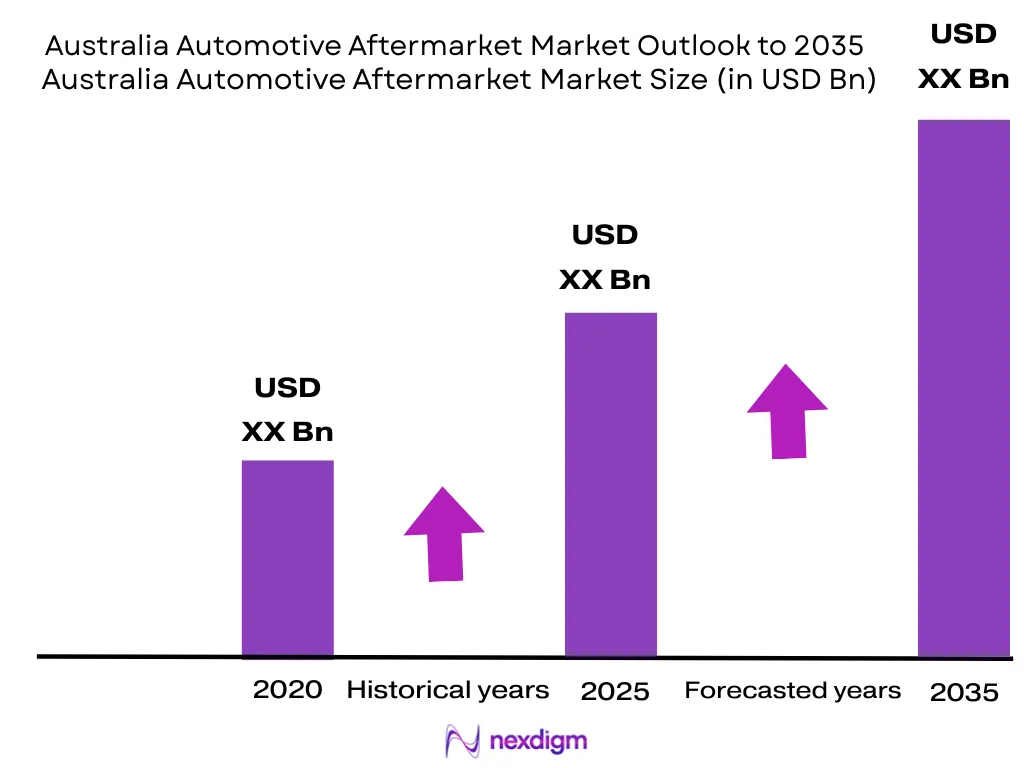
The Australia Automotive Aftermarket Market is valued at approximately ~ billion, compared with ~ billion in the preceding reporting cycle. Demand is supported by an increase in registered motor vehicles from 21.20 million to 21.74 million, alongside new-vehicle deliveries rising from 1,216,780 units to 1,220,607 units. An average fleet age of 11.40 years sustains recurring requirements for replacement parts, tires, batteries, lubricants, diagnostics and mechanical repairs.
New South Wales, Victoria and Queensland dominate the Australia Automotive Aftermarket Market because they contain the country’s largest registered vehicle populations, major freight corridors and dense workshop and parts-distribution networks. Together, the three states account for more than 16 million registered vehicles and over three-quarters of the national fleet. Sydney, Melbourne and Brisbane also concentrate corporate fleets, automotive retailers, import warehouses, dealership groups and independent repair businesses, supporting faster parts fulfilment and higher workshop utilization.
Market Segmentation
By Aftermarket Offering
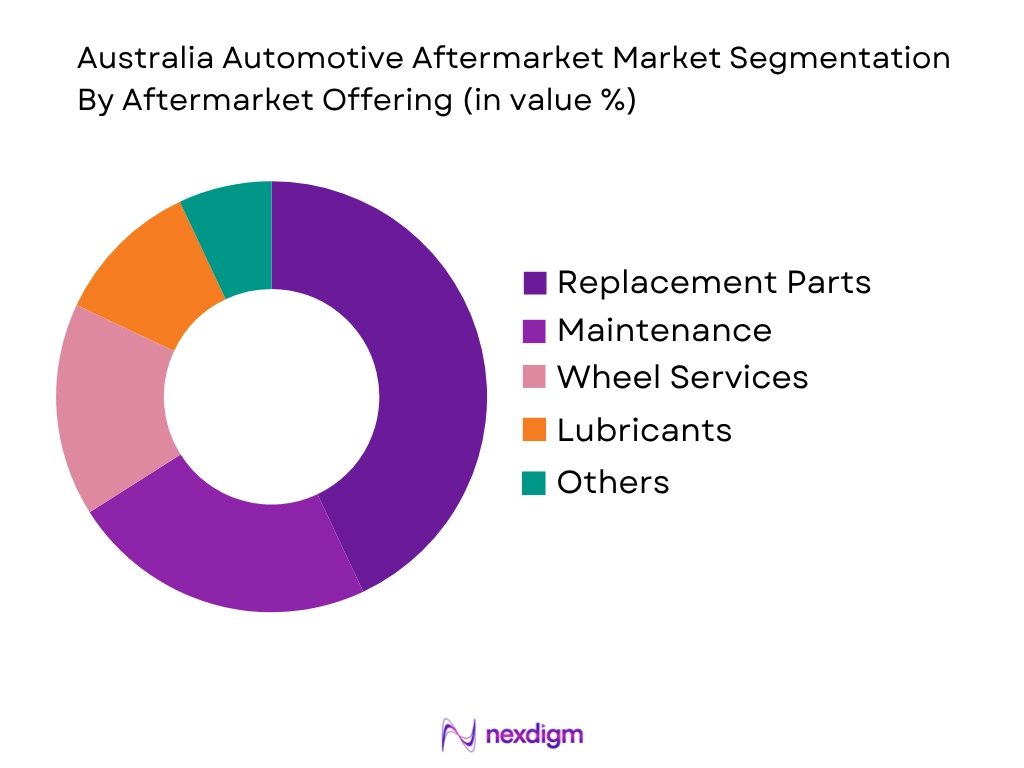
By aftermarket offering, the Australia Automotive Aftermarket Market is segmented into replacement parts, maintenance and mechanical repair, tires and wheel services, lubricants and automotive fluids, batteries and electrical services, collision repair, accessories and four-wheel-drive modifications, and car-care services. Replacement parts hold the dominant market share because almost every maintenance or repair transaction requires a component, consumable or wear item. Australia’s comparatively mature vehicle fleet generates repeat demand for filters, braking components, suspension parts, belts, hoses, cooling-system components, electrical parts and drivetrain products. A national average vehicle age above 11 years increases the likelihood of component failure and encourages motorists to select aftermarket alternatives rather than dealership-supplied genuine parts. The segment is also supported by nearly 28,000 automotive service and repair workshops, creating a broad trade-customer base for distributors. Strong SUV, utility, four-wheel-drive, commercial and caravan ownership further widens the required SKU range.
By Service Provider Type
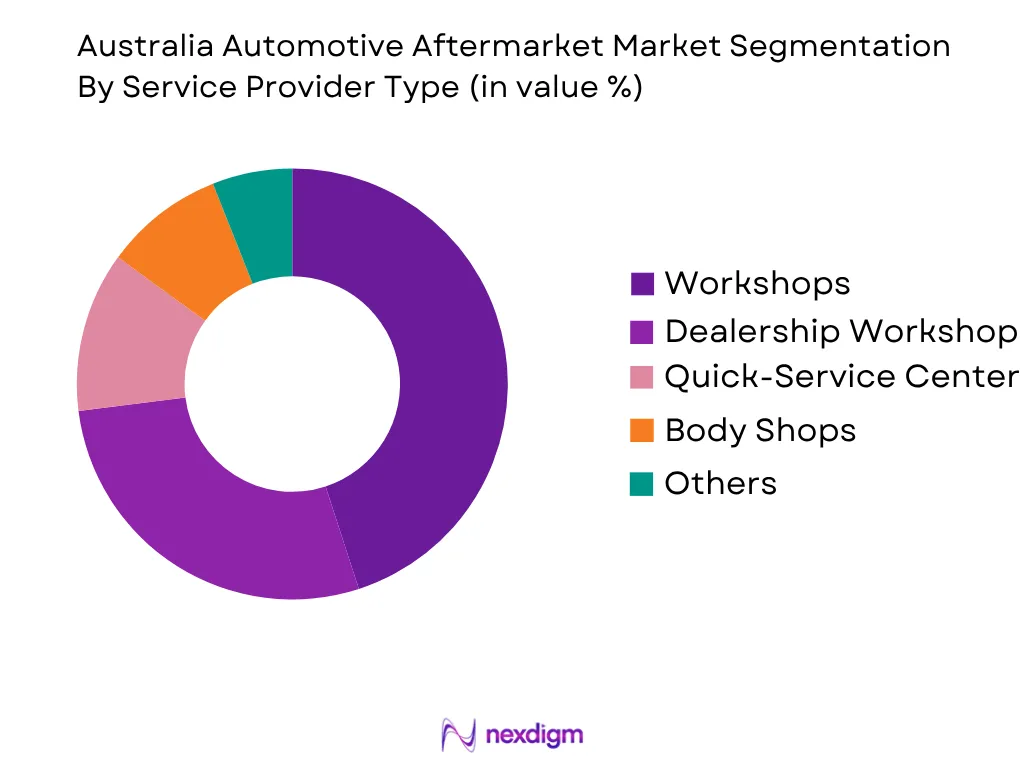
The Australia Automotive Aftermarket Market is segmented into independent standalone workshops, authorized dealership workshops, independent workshop chains, tire and fast-fit networks, collision repairers, mobile mechanics, fleet-owned workshops and specialist diagnostic centers. Independent standalone workshops represent the dominant sub-segment, supported by their broad geographic coverage, multi-brand capability and strong position among owners of older and out-of-warranty vehicles.
Independent repairers undertake approximately 60% of consumer vehicle service and repair activity, reflecting the importance of competitive labor rates, local customer relationships and access to multiple replacement-parts tiers. The mandatory Motor Vehicle Information Scheme strengthens their position by allowing Australian repairers to obtain service information, diagnostic material and software updates from vehicle manufacturers at a fair market price. Organized chains are nevertheless gaining relevance through national warranties, digital inspection reports, online booking, fleet servicing and standardized operating procedures.
Competitive Landscape
The Australia Automotive Aftermarket Market combines several large national groups with thousands of independent businesses. GPC Asia Pacific and Bapcor maintain significant positions in trade-parts distribution, while Supercheap Auto leads consumer-oriented automotive retail. mycar Tyre & Auto and Ultra Tune operate extensive service networks. Competitive advantage is increasingly determined by branch density, workshop coverage, SKU availability, same-day delivery, private-label portfolios, digital booking and the ability to support fleets, advanced diagnostics and electrified vehicles.
| Company | Establishment Year | Headquarters | Primary Business Model | Core Offering | Network Scale | Main Customer Base | Digital Capability | Market-Specific Strength |
| GPC Asia Pacific / Repco | 1922 | Melbourne, Victoria | ~ | ~ | ~ | ~ | ~ | ~ |
| Bapcor Limited | 1971 origins | Melbourne, Victoria | ~ | ~ | ~ | ~ | ~ | ~ |
| Supercheap Auto | 1972 | Brisbane, Queensland | ~ | ~ | ~ | ~ | ~ | ~ |
| mycar Tyre & Auto | Kmart Tyre & Auto heritage | Melbourne, Victoria | ~ | ~ | ~ | ~ | ~ | ~ |
| Ultra Tune Australia | 1979 | Melbourne, Victoria | ~ | ~ | ~ | ~ | ~ | ~ |

Australia Automotive Aftermarket Market Analysis
Growth Drivers
Aging Vehicle Parc and High Road-Use Intensity
Australia’s aging and intensively used vehicle population is a fundamental growth driver for the automotive aftermarket because older vehicles require more frequent replacement of brakes, filters, suspension components, batteries, cooling-system parts, belts, hoses, ignition products and drivetrain components. The Bureau of Infrastructure and Transport Research Economics recorded approximately 21.74 million registered vehicles in 2024, increasing to about 22.31 million vehicles in 2025. Over the same period, the average age of the registered fleet increased from 11.40 years to 11.54 years. Passenger vehicles averaged approximately 11.2 years in 2024 and 11.3 years in 2025, while light commercial vehicles increased from about 11.4 years to 11.6 years. This simultaneous expansion and aging of the parc enlarges the number of vehicles entering high-maintenance stages rather than merely replacing older units with newer vehicles. Australia’s geographic structure intensifies the resulting wear. Vehicles travelled an estimated 264 billion vehicle kilometres on national roads during 2024–25, supported by 476,000 kilometres of paved roads and approximately 900,000 kilometres of unpaved roads. Long-distance commuting, interstate freight, regional travel and operation on unsealed roads increase tire wear, stone damage, suspension fatigue, wheel-alignment requirements and dust exposure. The aftermarket also benefits from the composition of vehicle demand. Sports utility vehicles accounted for 59% of new motor-vehicle sales during 2024–25, while the country maintained large populations of utilities, pickups and light commercial vehicles. These vehicles typically require larger tires, heavier-duty braking components, suspension products, towing equipment and four-wheel-drive accessories. Macroeconomic activity provides an additional operating base: Australian GDP increased by 1.3% through December 2024, while the IMF subsequently projected economic growth of 1.9% in 2025 and 2.1% in 2026. Continued household mobility, construction, mining, tourism and logistics activity therefore supports recurring workshop visits and parts replacement across metropolitan, regional and remote markets.
Expansion of Freight, Commercial Fleets and Utility-Vehicle Applications
Growth in road freight, construction, mining, agriculture and last-mile delivery is strengthening demand for commercial-vehicle aftermarket products and services. Commercial fleets generally operate for longer hours and accumulate kilometres more rapidly than privately owned vehicles, creating predictable requirements for preventive maintenance, tires, brake systems, diesel-engine components, driveline parts, cooling systems, batteries and lubricants. Australia’s domestic road-freight activity reached approximately 253 billion tonne-kilometres during 2024–25, demonstrating the scale of vehicle utilization associated with moving goods between ports, warehouses, cities, mines, farms and retail centers. New South Wales alone recorded approximately 87.6 billion tonne-kilometres of road freight, while metropolitan Melbourne generated about 18.2 billion tonne-kilometres. These freight flows support heavy trucks, articulated vehicles, rigid trucks, trailers and light-commercial delivery vans, each with distinct component replacement cycles and downtime requirements. Australia’s registered fleet included approximately 4.2 million light commercial vehicles in 2025, in addition to a substantial heavy-vehicle population. Light commercial vehicles are used extensively by tradespeople, construction contractors, couriers, utilities and service businesses. Their loading patterns and stop-start operation create higher wear on brakes, clutches, tires, suspension parts and electrical systems. Regional industry also contributes to aftermarket activity because mining and agricultural fleets operate across harsh terrain and long distances, often beyond immediate access to metropolitan parts warehouses. Australia had approximately 900,000 kilometres of unpaved roads in 2024, reinforcing demand for all-terrain tires, shock absorbers, wheel bearings, filters, underbody protection and mobile repair support. The broader economy provides a stable base for fleet utilization. Australian GDP rose by 1.3% through December 2024, private investment increased by 0.3% during the quarter, and the IMF expected growth to strengthen to 2.1% in 2026. These indicators support continued transport demand from construction, infrastructure, retail and industrial activity. For aftermarket suppliers, commercial fleets are particularly attractive because purchasing can be consolidated into scheduled service contracts, centralized parts procurement and multi-site maintenance agreements. Providers capable of minimizing downtime through telematics, preventive servicing, mobile technicians and reserved inventory can therefore capture recurring demand that is less discretionary than household repair expenditure.
Market Challenges
Increasing Technical Complexity and Electrified-Vehicle Service Requirements
The technical complexity of Australia’s vehicle fleet is creating a major capability challenge for independent workshops and conventional parts businesses. New vehicles increasingly combine advanced driver-assistance systems, electronic control units, cameras, radar, networked sensors, digital service functions and software-dependent diagnostics. Battery electric and hybrid vehicles add high-voltage batteries, power electronics, electric drive units, regenerative braking and specialized thermal-management systems. Registered hybrid vehicles reached approximately 709,100 units in 2025, while battery-electric and plug-in hybrid registrations continued to expand. This creates aftermarket demand, but it changes the equipment, training and safety procedures required to capture that demand. Workshops servicing electrified vehicles need insulated tools, high-voltage personal protective equipment, secure isolation areas, battery diagnostic systems and model-specific technical information. Collision repairers must identify battery locations and safely isolate electrical systems before welding, structural repair or paint-curing activities. The New Vehicle Efficiency Standard commenced on 1 January 2025, with regulated compliance beginning on 1 July 2025 for new passenger and light-commercial vehicles supplied in Australia. During the first reporting period, approximately 12 vehicles out of every 100 covered vehicles were fully electric, while the remaining 88 used internal-combustion or hybrid powertrains. This indicates that workshops must support new technologies while retaining conventional repair capability for a much larger legacy fleet. The same complexity affects non-electric vehicles because windshield replacement, wheel alignment, suspension repairs and collision work can require camera or radar recalibration. Failure to complete these procedures can leave warning systems inaccurate even when the mechanical repair has been performed correctly. Macroeconomic recovery may increase vehicle activity and workshop demand, with the IMF forecasting Australian real GDP growth of 2.1% in 2026, but the opportunity will favor businesses able to finance current diagnostic subscriptions, scan tools, calibration equipment and technician development. Smaller workshops may struggle to justify investment across a fragmented vehicle parc containing Japanese, European, Korean, American and rapidly expanding Chinese models. Technical complexity therefore raises the risk of repair outsourcing, longer turnaround times and increasing concentration of advanced work among dealership groups and organized specialist networks.
Shortage of Motor Mechanics, Automotive Electricians and Diesel Technicians
Australia’s shortage of qualified automotive technicians restricts workshop capacity and creates longer repair lead times, particularly for complex electrical, diesel, heavy-vehicle and regional work. Jobs and Skills Australia identified continuing shortages across motor mechanics, automotive electricians and diesel mechanics. Employer recruitment evidence for 2024 showed that only 38 vacancies out of every 100 were filled for motor mechanics, 33 out of every 100 for automotive electricians and 27 out of every 100 for diesel mechanics. These outcomes are materially below the wider vacancy fill rate of 41 out of every 100, indicating that automotive businesses face unusually persistent difficulty securing appropriately skilled workers. The pressure is amplified by the size and aging profile of the vehicle parc. Australia had approximately 21.74 million registered vehicles in 2024, rising to about 22.31 million in 2025, while average vehicle age increased from 11.40 years to 11.54 years. More vehicles therefore require servicing at the same time as the technical labor base remains constrained. Approximately 264 billion vehicle kilometres were travelled during 2024–25, adding significant service workload across passenger cars, utilities, delivery vans, trucks and buses. Regional and remote businesses face the greatest challenge because technicians must support a wide mix of passenger, agricultural, mining and heavy-commercial vehicles without the specialization available in metropolitan workshops. Recruitment alone does not resolve the gap. New entrants require apprenticeships, supervised experience and training in diagnostics, electronics, refrigerants, ADAS and high-voltage safety. Existing mechanics also need continuing education because servicing modern vehicles increasingly involves data interpretation and electronic testing rather than only mechanical disassembly. The macroeconomic environment sustains competition for skilled trades. Australian GDP increased by 1.3% through December 2024, while the IMF projected growth of 1.9% in 2025 and 2.1% in 2026, supporting employment demand across construction, resources, infrastructure and transport. These industries compete for technicians with transferable mechanical and electrical capabilities. Workshop operators may respond through higher technician productivity, digital inspection systems, centralized diagnostics, mobile specialist teams and greater use of remanufactured assemblies. Nevertheless, insufficient labor capacity could constrain service volumes, delay fleet repairs and discourage smaller operators from investing in EV and ADAS capabilities.
Market Opportunities
Advanced Diagnostics, EV Repair and Digital Workshop Services
Technological change creates an opportunity for Australian aftermarket businesses to develop higher-value services in EV diagnostics, battery assessment, ADAS calibration, remote programming and connected workshop management. The current fleet already provides a commercial base for investment. Australia had approximately 709,100 registered hybrid vehicles in 2025, alongside a growing battery-electric and plug-in hybrid population. The New Vehicle Efficiency Standard began on 1 January 2025, and approximately 12 out of every 100 vehicles covered during the first performance period were electric. These vehicles will progressively require independent servicing as warranties expire, creating demand for high-voltage battery testing, low-voltage electrical repair, cooling-system maintenance, tires, suspension, air-conditioning, charging-system diagnostics and collision repair. The opportunity also extends to conventional vehicles because modern petrol and diesel models increasingly use radar, cameras, electronic steering, digital dashboards and interconnected control modules. Independent workshops can differentiate through comprehensive scan reports, digital inspection photographs, electronic repair authorization, software updating and documented ADAS calibration. The mandatory Motor Vehicle Information Scheme supports this development by requiring vehicle manufacturers to make eligible diagnostic, service, repair and software information available to independent repairers. The scheme commenced on 1 July 2022 and remained subject to active ACCC oversight through 2024–26, providing a regulatory basis for more equitable access to manufacturer information. Workshop groups can combine this access with centralized diagnostic support, allowing technicians at multiple locations to obtain specialist programming and fault-analysis assistance. The scale of national road use supports the business case: vehicles travelled approximately 264 billion kilometres during 2024–25, and around 20 million Australians held vehicle licences. Macroeconomic recovery also improves the operating context, with IMF projections indicating real GDP growth of 2.1% in 2026. Businesses investing in accredited high-voltage training, battery-health reporting, calibration equipment and digital customer interfaces can create new revenue streams without depending solely on traditional oil-change and mechanical work. The strongest opportunity lies in becoming a trusted multi-technology provider capable of servicing petrol, diesel, hybrid and battery-electric vehicles through one integrated network.
Regional Parts Fulfilment, Mobile Repair and Fleet-Service Expansion
Australia’s geographic scale creates an opportunity for aftermarket businesses to expand regional distribution, mobile servicing and fleet-maintenance coverage. The national road network included approximately 476,000 kilometres of paved roads and 900,000 kilometres of unpaved roads in 2024, while vehicles travelled an estimated 264 billion kilometres during 2024–25. Rural communities, mining regions, agricultural areas and long-distance freight corridors often have fewer workshops, smaller parts inventories and longer delivery times than Sydney, Melbourne or Brisbane. This creates unmet demand for overnight parts distribution, mobile mechanics, roadside tire services, battery replacement, remote diagnostics and scheduled fleet-maintenance visits. The opportunity is reinforced by regional vehicle characteristics. Utilities, four-wheel drives, light-commercial vehicles, trucks and agricultural vehicles encounter dust, corrugation, heavy loads and extended operating distances. These conditions create recurring requirements for tires, suspension components, filters, wheel bearings, cooling-system parts, batteries and underbody protection. Australia’s registered light-commercial vehicle population reached approximately 4.2 million units in 2025, giving distributors and service networks a large base of trade, delivery, construction and fleet vehicles. Road freight accounted for approximately 253 billion tonne-kilometres during 2024–25, with New South Wales alone recording 87.6 billion tonne-kilometres. Fleet downtime in these sectors can delay deliveries, construction work or resource operations, making rapid servicing more valuable than conventional retail workshop availability. Current government infrastructure activity also supports future mobility demand. The 2025–26 federal budget allocated AUD 17.1 billion over 10 years to identified road and rail infrastructure initiatives, including AUD 7.2 billion for Queensland’s Bruce Highway and AUD 2.3 billion for Western Sydney transport projects. These investments support construction fleets and improve freight corridors, creating additional maintenance requirements for contractors and commercial operators. Australia’s economy grew by 1.3% through December 2024, while the IMF projected a strengthening to 2.1% in 2026, supporting transport and industrial activity. Aftermarket companies can capture this opportunity through regional warehouse hubs, consignment inventory, van-based technicians, scheduled fleet servicing and partnerships with local independent workshops. A hybrid model combining national procurement with local installation can overcome the limitations of establishing full-scale branches in every remote location.
Future Outlook
The Australia Automotive Aftermarket Market is forecast to expand at approximately % CAGR during the forecast period. Growth will be supported by an expanding registered vehicle parc, continued vehicle aging, high road usage and migration from authorized dealerships to independent repair channels.
Future revenue growth will increasingly come from diagnostics, electronic components, ADAS calibration, hybrid servicing and electric-vehicle maintenance. Conventional wear categories—including tires, brakes, suspension, low-voltage batteries and body parts—will remain essential across all propulsion types. Australia’s registered fleet increased further to approximately 22.31 million vehicles, including around 16.1 million passenger vehicles and 4.2 million light commercial vehicles. The average age of all registered vehicles increased from 11.24 years to 11.40 years and subsequently to 11.54 years, demonstrating that fleet expansion is occurring alongside aging rather than replacing the older vehicle population. This structure will sustain conventional replacement demand. Older petrol and diesel vehicles require increasing expenditure on cooling systems, suspension, transmissions, ignition systems and electrical components. At the same time, the electrified fleet is becoming commercially relevant: registered hybrid vehicles reached approximately 709,100 units, while battery-electric registrations continued to expand. Independent operators will require investment in insulated equipment, diagnostic subscriptions, battery-health analysis and technician certification. The market will also be influenced by the increasing importance of SUVs and four-wheel-drive vehicles. SUVs represented 59% of new motor-vehicle sales in the latest reported period, while more than 5.5 million four-wheel-drive vehicles were already operating on Australian roads. This supports future demand for all-terrain tires, suspension upgrades, bull bars, roof systems, towing products, recovery equipment and vehicle-specific accessories.
Major Players
- GPC Asia Pacific
- Repco
- NAPA Auto Parts Australia
- Bapcor Limited
- Burson Auto Parts
- Autobarn
- Supercheap Auto
- mycar Tyre & Auto
- Bridgestone Select Tyre & Auto
- Bob Jane T-Marts
- JAX Tyres & Auto
- Ultra Tune Australia
- Pedders Suspension & Brakes
- Auto One Australia
- Capricorn Society
Key Target Audience
- Automotive parts and component manufacturers
- Automotive parts importers, wholesalers and trade distributors
- Independent workshop chains and automotive franchise operators
- Tire, battery and automotive specialty retailers
- Fleet, leasing, mining, logistics and rental-vehicle operators
- Automotive e-commerce and workshop-technology providers
- Investments and venture capitalist firms
- Government and regulatory bodies
Research Methodology
Step 1: Identification of Key Variables
The first phase constructs an ecosystem map covering component manufacturers, importers, distributors, automotive retailers, workshops, dealership service centers, fleets, insurers and online platforms. Critical variables include registered vehicle parc, average vehicle age, annual kilometres travelled, component replacement intervals, repair frequency, workshop utilization, labor rates and channel margins.
Step 2: Market Analysis and Construction
Historical registration, vehicle-sales, road-usage and parts-trade information is compiled to establish the demand base. Top-down analysis evaluates total service and parts expenditure, while bottom-up analysis calculates revenue from vehicle categories, replacement rates, service visits, average repair orders and parts values.
Step 3: Supply-Side Assessment
Major distributors, retailers, workshop chains and tire networks are evaluated according to branch count, store footprint, service bays, SKU coverage, trade delivery capability, private-label participation and customer mix. Company revenues are reconstructed where segment-level aftermarket information is not publicly disclosed.
Step 4: Demand-Side Assessment
Vehicle owners and fleet operators are assessed by vehicle type, age, propulsion, annual usage, warranty status and geographic location. The analysis examines authorized-versus-independent workshop preferences, DIY behavior, parts-quality selection, service frequency, channel preference and demand for mobile or digital services.

- Executive Summary
- Research Methodology (Market Definitions and Assumptions, Abbreviations, Automotive Aftermarket Boundary, Vehicle Parc–Based Market Modeling, Top-Down Analysis, Bottom-Up Analysis, Demand-Side Assessment, Supply-Side Assessment, Replacement-Rate Modeling, Workshop Throughput Assessment, Parts Import Analysis, Distributor Revenue Reconstruction, Primary Industry Interviews, Data Triangulation, Scenario Forecasting Framework, Limitations and Future Conclusions)

- Definition and Scope
- Market Evolution and Industry Genesis
- Timeline of Major Industry Developments
- Automotive Aftermarket Business Cycle
- Australian Vehicle Parc and Replacement Demand Ecosystem
- Automotive Parts and Service Value Chain Analysis
- Automotive Aftermarket Supply Chain Analysis

- Growth Drivers (Aging Vehicle Parc, High Vehicle Ownership, Long Driving Distances, Commercial Fleet Expansion, Four-Wheel-Drive Popularity, Used-Vehicle Retention)
- Market Challenges (Skilled Technician Shortage, Parts Inflation, Workshop Fragmentation, Model Proliferation, Technology Complexity, Inventory Risk)
- Market Opportunities (EV Servicing, Regional Workshop Networks, Fleet Contracts, Digital Procurement, Remanufacturing, Mobile Services)
- Market Trends (Digitalization, Workshop Consolidation, Vehicle Electrification, Service Transparency, Omnichannel Retailing, Parts Traceability)
- Government Regulations (Australian Design Rules, Road Vehicle Standards, Consumer Guarantees, Repair Information Sharing, Environmental Compliance)
- SWOT Analysis
- Porter’s Five Forces Analysis
- PESTLE Analysis

- By Market Value (2020-2025)
- By Replacement Parts Revenue (2020-2025)
- By Maintenance and Repair Service Revenue (2020-2025)

- By Aftermarket Offering (In Value %)
Replacement Parts
Scheduled Maintenance Services
Mechanical Repair Services
Tires and Wheel Services
Batteries and Automotive Electrical Services
Lubricants and Fluid Replacement - By Vehicle Type (In Value %)
Passenger Cars
Sports Utility Vehicles
Utilities and Pickup Vehicles
Light Commercial Vehicles
Heavy Rigid Trucks
Articulated Trucks and Prime Movers
Buses and Coaches - By Service Provider Type (In Value %)
Authorized Dealer Workshops
Independent Multi-Brand Workshop Chains
Independent Standalone Workshops
Vehicle Brand–Specialist Workshops
Fast-Fit and Quick-Service Centers - By State and Territory (In Value %)
New South Wales
Victoria
Queensland
Western Australia
South Australia
Tasmania
Australian Capital Territory
Northern Territory

- Market Share of Major Players (By Aftermarket Revenue, Parts Revenue, Retail Revenue, Service Revenue, Distribution Reach)
- Cross Comparison Parameters (Trade and Retail Parts Portfolio Breadth, Store and Workshop Network Coverage, Automotive SKU Availability and Inventory Fill Rate, Trade Delivery Frequency and Regional Fulfilment Capability, DIY–DIFM–Fleet Customer Channel Mix, Mechanical–Tire–Electrical–ADAS–EV Service Capability, Private-Label and Exclusive Brand Portfolio, Workshop Throughput and Parts-to-Labour Revenue Mix)
- SWOT Analysis of Major Players
- Pricing Analysis by SKU and Service Category
- Detailed Profiles of Major Companies
GPC Asia Pacific
Bapcor Limited
Super Retail Group
mycar Tyre & Auto
Bridgestone Australia
Bob Jane Corporation
JAX Tyres & Auto
Ultra Tune Australia
Pedders Suspension & Brakes
Auto One Australia
Capricorn Society
Motorserve
Tyrepower
Bosch Car Service Australia
Tyreright

- Individual Vehicle Owner Demand Analysis
- Passenger Car Owner Maintenance Behaviour
- SUV and Crossover Owner Analysis
- Utility and Pickup Vehicle Owner Analysis
- Four-Wheel-Drive Vehicle Owner Analysis

- By Market Value (2026-2035)
- By Replacement Parts Revenue (2026-2035)
- By Maintenance and Repair Service Revenue (2026-2035)


 Request a Sample
 Ask for Customization
 Get a Quote
 Enquire Now