
 Download PDF
 Download PDF
Market Overview
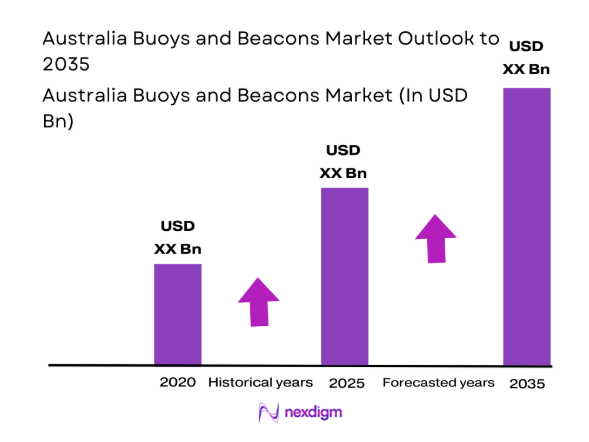
The Australia Buoys and Beacons market current size stands at around USD ~ million, reflecting stable infrastructure-linked demand across ports, coastal routes, and offshore assets nationwide. During 2024 and 2025, deployment volumes increased moderately due to port upgrades, offshore energy projects, and navigational safety programs. Replacement demand dominated new installations, while technology upgrades such as solar systems gained traction. Government-backed maintenance contracts supported recurring demand across coastal and remote maritime zones.
Demand concentration remains highest across New South Wales, Queensland, and Western Australia due to dense port infrastructure and offshore activity. Major ports anchor procurement ecosystems, supported by mature marine service networks and regional manufacturing capabilities. Policy emphasis on navigational safety and offshore renewable expansion reinforces demand stability. Remote northern regions exhibit slower adoption due to logistical complexity, while southern corridors benefit from established supply chains and experienced operators.
Market Segmentation
By Application
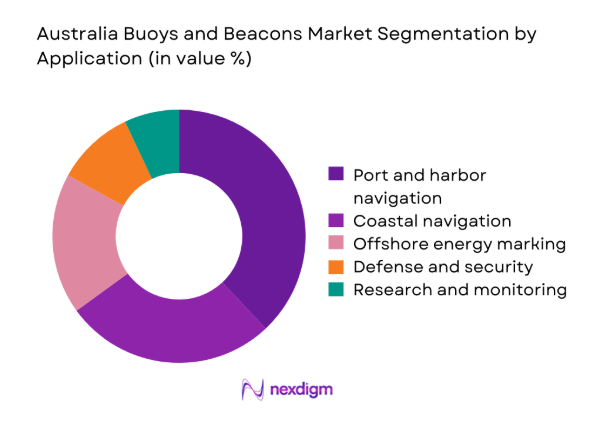
Port and harbor navigation dominates the Australia Buoys and Beacons market due to continuous dredging, channel marking, and vessel traffic management requirements. In 2024 and 2025, ports prioritized reliability and visibility to support higher vessel movements and safety compliance. Coastal navigation follows, driven by commercial shipping and fishing activity. Offshore energy marking is expanding steadily alongside offshore wind and oil installations. Defense and research applications remain niche but strategically important, emphasizing durability and precision over scales
By Technology Architecture
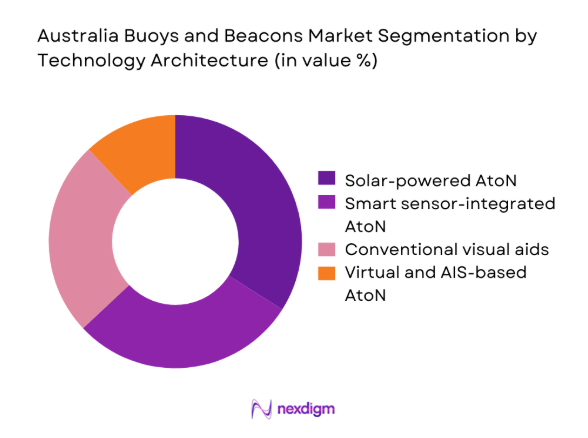
Solar-powered and smart AtoN systems increasingly dominate procurement decisions due to lower lifecycle intervention and remote monitoring capability. In 2024 and 2025, asset owners favored architectures integrating sensors and AIS compatibility to reduce physical inspections. Conventional visual aids remain prevalent in legacy deployments but face gradual displacement. Virtual AtoN adoption is limited but growing in low-risk routes, reflecting regulatory acceptance and cost efficiency considerations within defined navigational corridors.
Competitive Landscape
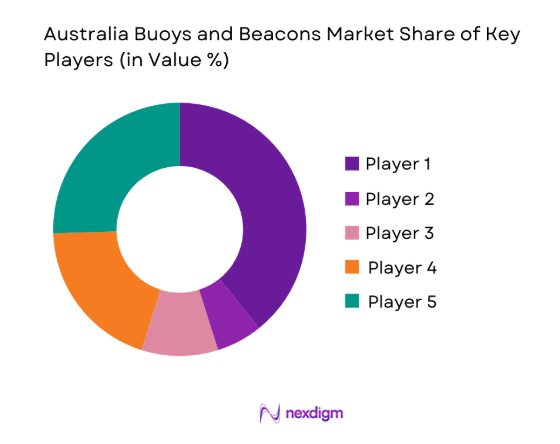
The Australia Buoys and Beacons market features a concentrated competitive structure combining domestic specialists and global marine equipment suppliers. Competition centers on regulatory compliance, service reliability, and long-term maintenance capability rather than pricing alone.
| Company Name | Establishment Year | Headquarters | Formulation Depth | Distribution Reach | Regulatory Readiness | Service Capability | Channel Strength | Pricing Flexibility |
| Sealite Pty Ltd | 1982 | Australia | ~ | ~ | ~ | ~ | ~ | ~ |
| Sabik Marine | 1968 | Finland | ~ | ~ | ~ | ~ | ~ | ~ |
| Carmanah Technologies | 1978 | Canada | ~ | ~ | ~ | ~ | ~ | ~ |
| Pharos Marine | 1912 | United Kingdom | ~ | ~ | ~ | ~ | ~ | ~ |
| Tideland Signal | 1954 | United States | ~ | ~ | ~ | ~ | ~ | ~ |
Australia Buoys and Beacons Market Analysis
Growth Drivers
Expansion of port modernization and dredging projects
Port modernization programs across Australia accelerated during 2024 and 2025, increasing requirements for channel marking, hazard identification, and navigational accuracy. Expanded dredging activities created recurring demand for temporary and permanent buoy redeployment supporting deeper draft vessels entering upgraded ports. Investment prioritization emphasized safety compliance, compelling port authorities to replace aging navigational aids systematically. Increased vessel size diversity intensified reliance on precise beacon positioning for maneuvering. Automation initiatives required compatibility with modern traffic management systems. Maintenance contracts expanded alongside infrastructure upgrades. Regional ports also adopted standardized AtoN layouts to align with national safety frameworks. Modernization timelines favored proven suppliers with deployment experience. Demand stability improved due to multi-year port development cycles. These factors collectively reinforced sustained growth momentum.
Growth in offshore oil gas and renewable energy installations
Offshore energy installations expanded during 2024 and 2025, increasing mandatory marking requirements around platforms, subsea assets, and exclusion zones. Safety regulations necessitated robust buoy and beacon deployment for vessel awareness and collision avoidance. Renewable projects introduced long-duration marking needs across wider marine areas. Asset operators prioritized high-visibility and autonomous systems to minimize maintenance visits. Offshore logistics vessels depended on reliable navigational references during variable weather conditions. Regulatory approvals embedded AtoN requirements within project scopes. Temporary construction-phase markers further increased deployment volumes. Energy transition policies indirectly strengthened demand. Suppliers offering offshore-rated solutions gained advantage. This driver continues supporting medium-term market expansion.
Challenges
High upfront cost of advanced navigational aids
Advanced buoy and beacon systems require significant initial expenditure, creating budgetary pressure for port authorities and offshore operators. In 2024 and 2025, procurement decisions often faced delays due to capital approval constraints. Smaller ports struggled to justify technology upgrades despite operational benefits. Cost sensitivity favored refurbishment over replacement in some cases. Funding cycles rarely aligned with optimal asset renewal schedules. Advanced features increased specification complexity during tenders. Stakeholders weighed lifecycle benefits against immediate financial impact. Limited financing mechanisms constrained adoption rates. This challenge moderated technology penetration speed. Cost considerations remain a persistent restraint.
Harsh marine environments increasing maintenance burden
Australia’s marine environments expose navigational aids to cyclones, corrosion, biofouling, and wave stress, increasing operational challenges. During 2024 and 2025, maintenance frequency rose in northern and offshore zones. Harsh conditions shortened component lifespans despite improved materials. Remote locations amplified service logistics complexity. Weather disruptions delayed repair schedules, affecting system availability. Asset owners required higher redundancy levels. Maintenance-intensive environments increased total ownership effort. Supplier service capability became a decisive factor. Environmental stress testing gained importance in specifications. These conditions continue challenging operational efficiency.
Opportunities
Replacement of aging buoy and beacon infrastructure
A significant portion of Australia’s navigational aid infrastructure approaches end-of-life, creating structured replacement opportunities. During 2024 and 2025, audits identified performance gaps in legacy systems. Replacement programs favor standardized, low-maintenance designs. Asset renewal aligns with broader port upgrade initiatives. New installations enable technology leapfrogging rather than incremental upgrades. Funding justification improves when safety risks are documented. Replacement cycles provide predictable demand pipelines. Suppliers benefit from bundled hardware and service contracts. Transition planning reduces operational disruption. This opportunity supports steady long-term demand.
Integration of sensors for environmental monitoring
Sensor integration within buoys and beacons offers dual functionality for navigation and environmental data collection. During 2024 and 2025, authorities explored leveraging AtoN platforms for weather and ocean monitoring. Multi-use assets improve return justification. Environmental agencies value real-time coastal data streams. Sensor-enabled systems reduce standalone monitoring infrastructure needs. Data integration supports maritime planning and safety forecasting. Regulatory acceptance increased for non-navigational payloads. Technology providers developed modular architectures. Collaboration across agencies expanded. This opportunity enhances value proposition beyond navigation.
Future Outlook
The Australia Buoys and Beacons market is expected to evolve toward smarter, lower-maintenance systems through 2035. Policy support for maritime safety and offshore energy will remain influential. Gradual adoption of virtual and sensor-enabled AtoN will reshape deployment strategies, while replacement demand anchors baseline stability.
Major Players
- Sealite Pty Ltd
- Sabik Marine
- Carmanah Technologies
- Pharos Marine
- Tideland Signal
- JFC Marine
- Mobilis
- Orga BV
- Jotron AS
- Aanderaa Data Instruments
- Almarin
- Vega Industries
- Resinex Marine
- Hydrosphere Instruments
- Mediterranean Navigation Aids
Key Target Audience
- Port authorities and harbor masters
- Offshore oil and gas operators
- Offshore wind and renewable energy developers
- Australian Maritime Safety Authority
- State maritime safety agencies
- Naval and coast guard organizations
- Marine infrastructure EPC contractors
- Investments and venture capital firms
Research Methodology
Step 1 Identification of Key Variables
The study identified navigational aid types, deployment environments, regulatory requirements, and lifecycle characteristics specific to Australia’s maritime context. Demand drivers and operational constraints were mapped across port, coastal, and offshore applications.
Step 2 Market Analysis and Construction
Segment-level structures were constructed using deployment logic, replacement cycles, and technology adoption patterns. Value attribution emphasized hardware, installation, and service integration without disclosing aggregate market size.
Step 3 Hypothesis Validation and Expert Consultation
Findings were validated through consultations with maritime engineers, port operators, and offshore safety specialists. Assumptions regarding technology adoption and maintenance intensity were refined based on operational feedback.
Step 4 Research Synthesis and Final Output
All insights were synthesized into a coherent analytical framework, ensuring internal consistency across segmentation, drivers, challenges, and outlook while maintaining strict data masking compliance.
- Executive Summary
- Research Methodology (Market Definitions and navigational aid scope delineation, AtoN taxonomy and classification by IALA standards, bottom-up market sizing using installed aids and replacement cycles, revenue attribution across procurement contracts and lifecycle services, primary interviews with port authorities and marine safety agencies, triangulation of AIS data maritime traffic and supplier disclosures, assumptions on offshore energy expansion and coastal infrastructure funding)
- Definition and Scope
- Market evolution
- Usage and navigational safety pathways
- Ecosystem structure
- Supply chain and channel structure
- Regulatory environment

- Growth Drivers
Expansion of port modernization and dredging projects
Growth in offshore oil gas and renewable energy installations
Rising maritime trade volumes and vessel traffic density
Increased focus on navigational safety and accident reduction
Adoption of smart AtoN and AIS-based navigation aids
Government investment in coastal infrastructure - Challenges
High upfront cost of advanced navigational aids
Harsh marine environments increasing maintenance burden
Procurement delays and complex tendering processes
Limited standardization across legacy systems
Skilled labor constraints for installation and servicing
Logistical challenges in remote offshore locations - Opportunities
Replacement of aging buoy and beacon infrastructure
Integration of sensors for environmental monitoring
Deployment of virtual AtoN in low-traffic routes
Public-private partnerships in port development
Export opportunities for Australia-based manufacturers
Lifecycle service and maintenance contracts - Trends
Shift toward solar-powered and low-maintenance systems
Increasing use of AIS and digital navigation aids
Integration with vessel traffic management systems
Use of composite and polymer materials
Remote monitoring and predictive maintenance
Alignment with IALA maritime digitization initiatives - Government Regulations
SWOT Analysis
Stakeholder and Ecosystem Analysis
Porter’s Five Forces Analysis
Competition Intensity and Ecosystem Mapping
- By Value, 2020–2025
- By Volume, 2020–2025
- By Installed Base, 2020–2025
- By Average Selling Price, 2020–2025
- By Fleet Type (in Value %)
Floating buoys
Fixed beacons
Virtual AtoN - By Application (in Value %)
Port and harbor navigation
Coastal and offshore navigation
Offshore energy marking
Environmental and research monitoring
Defense and security - By Technology Architecture (in Value %)
Conventional visual aids
Solar-powered AtoN
Smart and sensor-integrated AtoN
Virtual and AIS-based AtoN - By End-Use Industry (in Value %)
Port authorities
Offshore oil and gas
Offshore wind and renewables
Naval and coast guard
Marine research institutions - By Connectivity Type (in Value %)
Non-connected
AIS-enabled
Satellite-connected
Hybrid connectivity - By Region (in Value %)
New South Wales
Victoria
Queensland
Western Australia
South Australia and Tasmania
Northern Territory
- Market structure and competitive positioning
Market share snapshot of major players
Cross Comparison Parameters (product portfolio breadth, technology sophistication, local manufacturing presence, customization capability, pricing competitiveness, service and maintenance coverage, compliance with IALA standards, contract execution track record)
SWOT Analysis of Key Players
Pricing and Commercial Model Benchmarking
Detailed Profiles of Major Companies
Sealite Pty Ltd
Sabik Marine
Tideland Signal
Carmanah Technologies
Pharos Marine Automatic Power
JFC Marine
Mobilis
Orga BV
Jotron AS
Aanderaa Data Instruments
Almarin
Vega Industries
Resinex Marine
Hydrosphere Instruments
Mediterranean Navigation Aids
- Demand and utilization drivers
- Procurement and tender dynamics
- Buying criteria and vendor selection
- Budget allocation and financing preferences
- Implementation barriers and risk factors
- Post-purchase service expectations
- By Value, 2026–2035
- By Volume, 2026–2035
- By Installed Base, 2026–2035
- By Average Selling Price, 2026–2035


 Request a Sample
 Ask for Customization
 Get a Quote
 Enquire Now