
 Download PDF
 Download PDF
Market Overview
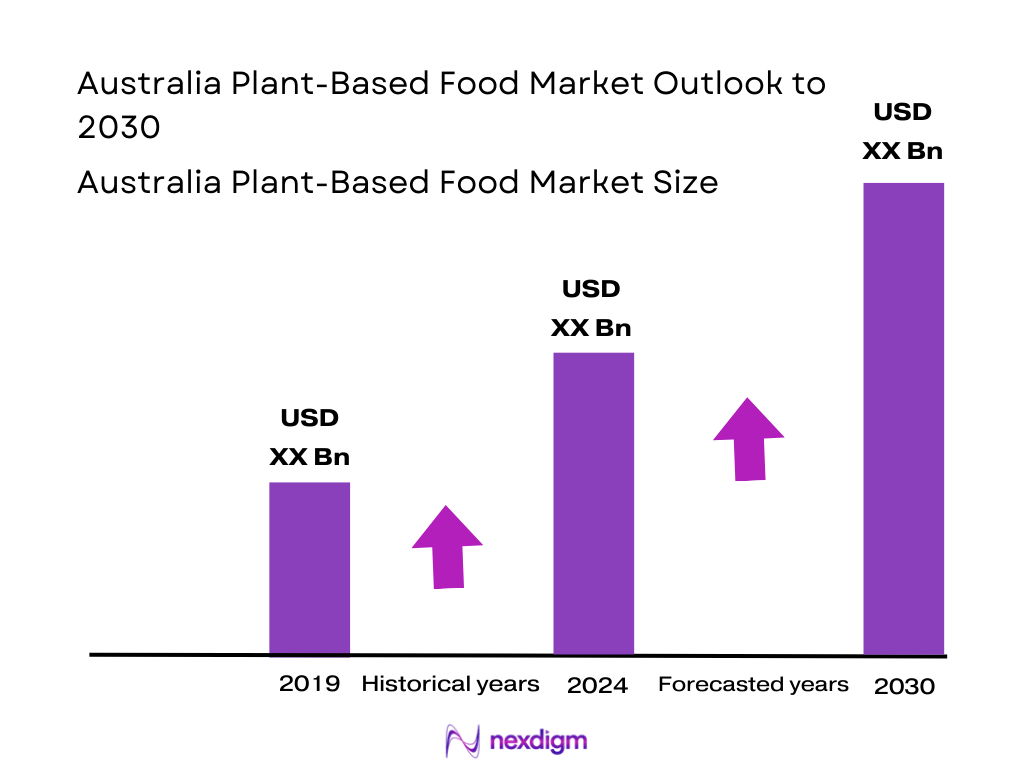
The Australia plant‑based food market is valued at USD 330.4 million in 2024. This valuation reflects a solid increase from prior years, shaped by growing availability in mainstream retail and e‑commerce, rising health and environmental consciousness among consumers, and broader adoption of plant‑based diets across demographic groups. Moreover, other sources indicate the Australia vegan food market alone reached USD 433.03 million in 2024, reinforcing the significant momentum behind plant‑based category expansion.
Major metropolitan areas such as Sydney (New South Wales), Melbourne (Victoria), and Brisbane (Queensland) dominate the Australia plant‑based food scene. These cities are economic and cultural hubs with high urban density, affluent and health‑conscious populations, and robust retail infrastructure—supermarkets, specialty stores, and foodservice outlets—that readily stock and promote plant‑based innovations. Additionally, these urban centers are influential trend leaders: consumers here are more exposed to sustainability messaging, media influence, and early‑stage product launches, driving higher penetration and normalization of plant‑based alternatives.
Market Segmentation
By Product Type
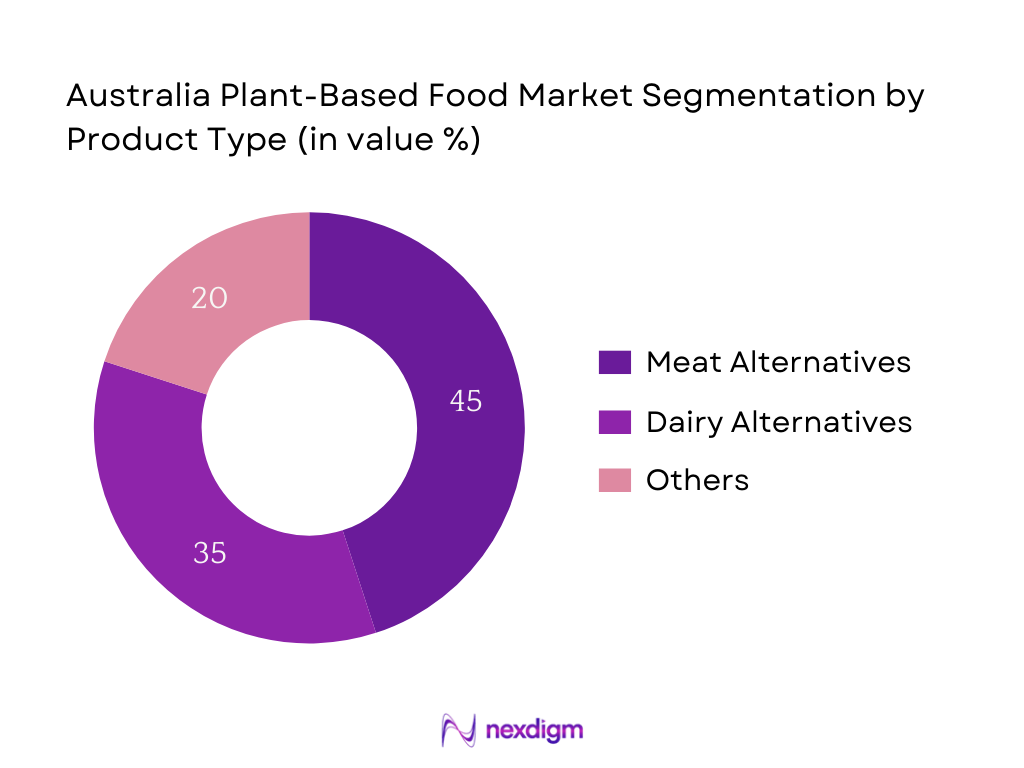
Segmentation by product type breaks the Australia plant‑based food market into Meat Alternatives, Dairy Alternatives, and Others (e.g., snacks, sauces, ready meals). Within this, Meat Alternatives hold the largest share. This dominance stems from the fact that they replicate conventional meat experiences with familiar formats like burgers and sausages. Increased consumer interest in replacing traditional meat, along with strong innovation and marketing by brands, contributes to their lead.
By Ingredient Source
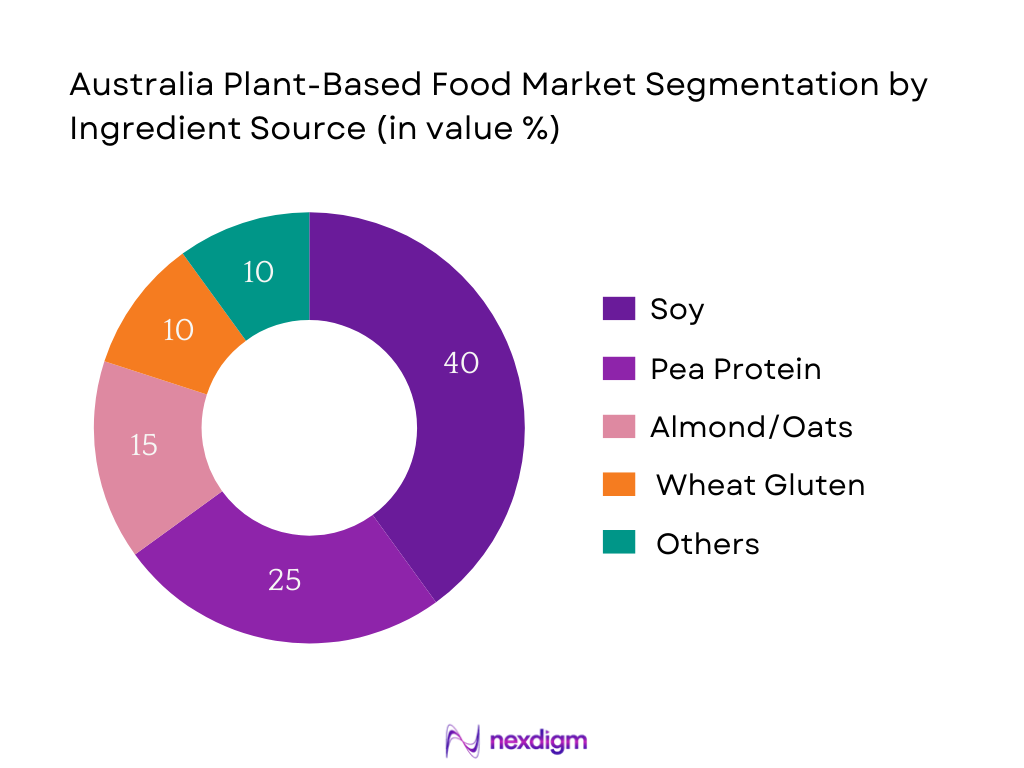
Segmentation by ingredient source includes Soy, Pea Protein, Almond/Oats, Wheat Gluten, and Others. Soy-based products lead the segment. Their dominance is due to the completeness of soy protein (all essential amino acids), well‑established supply chains, cost‑competitiveness, and familiarity among manufacturers and consumers, making soy the default base for many plant‑based formats.
Competitive Landscape
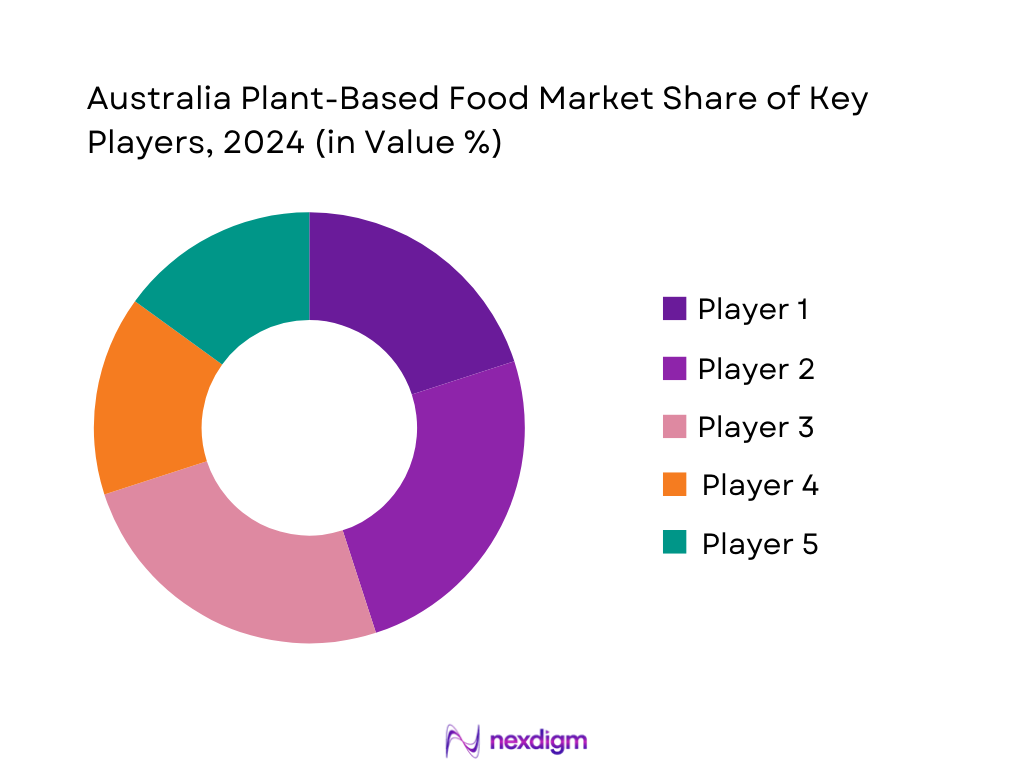
The Australia plant‑based food market is consolidated among several players, including both local innovators and global entrants. This concentration highlights the significant influence these companies exert on product innovation, distribution, and consumer acceptance across the sector.
| Company | Establishment Year | Headquarters | Key Ingredients | Distribution Reach | Product Range | Certifications (e.g., Organic, Non‑GMO) | Manufacturing Capacity |
| v2food | (year N/A) | Australia | – | – | – | – | – |
| All G Foods | (year N/A) | Australia | – | – | – | – | – |
| The Alternative Meat Co. | (year N/A) | Australia | – | – | – | – | – |
| Fable Food Co. | (year N/A) | Australia | – | – | – | – | – |
| Beyond Meat (Operations in AU) | 2009 | USA (AU ops) | – | – | – | – | – |
Australia Plant‑Based Food Market Analysis
Growth Drivers
Consumer Behavior Shift
Average household spending on food and non‑alcoholic beverages represents 17 percent of total expenditures in Australia (ABS CPI basket weight). In the year to February, household spending increased by 3.6 percent, while spending on food rose 5.7 percent over that period. These figures illustrate a tangible consumer prioritization of food products, driven by economic pressures and evolving preferences. Concurrently, Australia maintained a per‑capita GDP of USD 64,407 in 2024. This high income level underpins discretionary spending power, enabling consumers to experiment with emerging categories like plant‑based alternatives, especially amid inflationary environments where food budget inflation surpasses general spending.
Health Awareness
Daily per‑capita consumption of food and non‑alcoholic beverages averaged 1,550 grams per day in 2023–24, up from 1,539 grams the prior year. This suggests that while overall consumption volume is rising modestly, the composition of diets is shifting, with increased interest in healthier alternatives. At the same time, Australia’s nominal GDP per capita remains robust at USD 64,407 —a reflection of sustained high living standards enabling consumers to pay premium prices for health‑oriented products. These indicators reinforce heightened health consciousness among Australians, fueling demand for plant‑based options perceived as healthier than traditional counterparts.
Market Challenges
High Production Cost
Household food spending increased by 5.7 percent year‑on‑year, while total household spending rose 3.6 percent, reflecting rising input costs and shrinking consumer budgets for premium foods. Additionally, nominal GDP per capita slightly declined from USD 64,836 in 2023 to USD 64,407 in 2024, suggesting a small erosion in real consumer purchasing power. These cost pressures make it difficult for higher‑priced plant‑based products to compete if production cost remains elevated. Consequently, producers face margin squeeze while consumers become more cost-sensitive, leading to a challenging pricing environment for plant‑based alternatives.
Taste and Texture Gaps
Per‑capita consumption of total foods and beverages has only modestly increased from 1,539 g to 1,550 g per day between 2022–23 and 2023–24. This suggests that consumers’ demand for plant‑based products may be limited by sensory preferences; conventional foods still dominate daily intake. Furthermore, as nominal GDP per capita in Australia remains relatively flat at USD 64,407 in 2024, consumers may hesitate to invest in less familiar textures and flavors of plant‑based products when conventional alternatives satisfy more reliably. Hence, unless taste and texture closely mirror traditional products, consumer adoption may stagnate.
Market Opportunities
Innovation in Functional Foods
Australia’s food consumption trends show a slight increase in daily per‑capita intake from 1,539 g to 1,550 g per day between 2022–23 and 2023–24, indicating rising openness to novel food types. Combined with a high nominal per‑capita GDP of USD 64,407 in 2024, consumers have both capacity and interest to pay for value‑added nutrition. This environment supports development of functional plant‑based foods enriched with vitamins, protein blends, and gut‑health ingredients. Innovation here can attract health‑driven consumers expanding their daily food intake volume and quality.
Emerging Clean‑Label Trends
Renewable electricity generation reached 27.7 percent, surpassing prior sustainability goals, with a target of 82 percent by 2030. This demonstrates national momentum toward transparency and sustainability. Meanwhile, food inflation at 4.5 percent for food and beverages (ABS CPI) reflects consumer awareness around ingredient sourcing and product value. Clean‑label plant‑based products, using minimal and recognizable ingredients, align strongly with these trends. Consumers in Australia are increasingly likely to choose products that mirror national sustainability efforts and offer clear, trustworthy ingredient lists.
Future Outlook
Over the coming years, the Australia plant‑based food market is expected to maintain robust growth, underpinned by several key trends. Rising health-conscious consumption, tighter environmental regulations, and further expansion of retail and e‑commerce channels will continue to fuel demand. Additionally, product innovation—especially clean-label and nutrient‑enhanced options—alongside greater price parity with conventional products, will accelerate broader adoption across demographics and regions.
Major Players
- v2food
- All G Foods
- The Alternative Meat Co.
- Fable Food Co.
- Soulfresh
- Sanitarium Health and Wellbeing
- Over the Moo
- ProForm Foods
- Harvest B
- The Vegan Dairy
- Nestlé Australia (Plant‑Based Division)
- Beyond Meat (Australia operations)
- Impossible Foods (Distribution in AU)
- Bega Cheese Limited (Plant‑Based Arm)
- Fry Family Food Co.
Key Target Audience
- Senior executives at plant‑based food manufacturers
- Strategy heads at major supermarket chains (e.g., Woolworths, Coles)
- Investments and venture capitalist firms (e.g., Blackbird Ventures, Main Sequence Ventures)
- Government and regulatory bodies (Food Standards Australia New Zealand (FSANZ), Australian Department of Agriculture, Fisheries and Forestry)
- Innovation leads at foodservice groups (e.g., Starbucks Australia, Guzman y Gomez)
- Product development heads at food distributors
- Sustainability program directors at retail groups
- Corporate strategy teams at ingredient suppliers
Research Methodology
Step 1: Identification of Key Variables
The initial phase involved mapping stakeholders across the Australia plant‑based food ecosystem—ingredient suppliers, manufacturers, retailers, and consumer segments—drawing on secondary sources as well as internal proprietary databases.
Step 2: Market Analysis and Construction
Historical data (2019–2024) were compiled, including revenues, volumes, and average prices. Analysis of penetration trends across product types (e.g., meat alternatives, dairy substitutes) and distribution channels ensured accurate framework for current market sizing.
Step 3: Hypothesis Validation and Expert Consultation
Draft findings and hypotheses were validated through interviews with plant‑based category managers at supermarkets, R&D leads of manufacturers, and industry analysts. These conversations provided context on pricing, consumer feedback, and innovation direction.
Step 4: Research Synthesis and Final Output
Finally, we engaged directly with multiple companies—listed in the competitive landscape—to verify their capacities, product portfolios, and distribution strategies. These confirmations were integrated with the bottom‑up data, culminating in a robust, validated market analysis.
- Executive Summary
- Research Methodology (Market Definitions and Assumptions, Abbreviations, Market Sizing Approach, Consolidated Research Approach, In-Depth Industry Interviews, Primary and Secondary Research Framework, Limitations)
- Definition and Scope
- Evolution of Plant-Based Food in Australia
- Key Historical Milestones and Timeline of Major Launches
- Market Ecosystem Mapping (Raw Material – Manufacturer – Distributor – End User)
- Value Chain and Supply Chain Analysis

- Growth Drivers (Consumer Behavior Shift, Health Awareness, Government Support, Sustainable Food Demand, Investment Surge)
- Market Challenges (High Production Cost, Taste and Texture Gaps, Regulatory Constraints, Ingredient Sourcing)
- Market Opportunities (Innovation in Functional Foods, Emerging Clean Label Trends, Export Potential to APAC)
- Consumer Trends (Flexitarian and Veganism Adoption Rate, Plant-Based Inclusion in Weekly Diets, Purchase Intent by Age Group)
- Regulatory & Certification Framework (FSANZ Guidelines, Plant-Based Labelling, Nutritional Labelling Requirements)
- SWOT Analysis
- Stakeholder Ecosystem (Growers, Ingredient Suppliers, Manufacturers, Logistics Partners, Retailers)
- Porter’s Five Forces
- By Value, 2019-2024
- By Volume, 2019-2024
- By Average Price Per Unit, 2019-2024
- By Product Category (In Value %)
Plant-Based Meat Alternatives
Plant-Based Dairy Alternatives
Plant-Based Snacks & Ready Meals
Plant-Based Bakery Products
Plant-Based Supplements - By Ingredient Source (In Value %)
Soy
Pea Protein
Wheat Gluten
Coconut
Almond and Other Nuts - By End User Industry (In Value %)
Retail & Grocery Chains
Foodservice (Restaurants, QSRs, Cafes)
Institutional Buyers (Schools, Hospitals, Airlines)
Online Platforms
Specialty Vegan Stores - By Distribution Channel (In Value %)
Supermarkets & Hypermarkets
Health Food Stores
Online Retailers
Foodservice Distribution
Convenience Stores - By Region (In Value %)
New South Wales
Victoria
Queensland
Western Australia
South Australia & Others
- Market Share Analysis of Key Players
- Market Share by Product Category
Market Share by Distribution Channel - Cross Comparison Parameters (Company Overview, Key Ingredients Used, Manufacturing Capacity, Product Lines, Target Segments, Distribution Coverage, Branding Strategy, Certifications, Partnerships, Local vs Imported Inputs)
- SWOT Analysis of Major Players
- Pricing Benchmarking by SKU – Meat Alternatives, Dairy Substitutes, and Snacks
- Company Profiles
v2food
All G Foods
The Alternative Meat Co.
Made With Plants
Soulfresh
Sanitarium Health and Wellbeing
Fable Food Co.
Over the Moo
ProForm Foods
Harvest B
The Vegan Dairy
Nestlé Australia (Plant-Based Div.)
Beyond Meat (Australia Operations)
Impossible Foods (Distribution in AU)
Bega Cheese Limited (Plant-Based Arm)
- Usage Frequency Across Urban and Regional Markets
- Price Sensitivity Across Key Demographics
- Preferred SKUs and Packaging Formats
- Brand Recall and Consumer Loyalty
- Pain Points: Taste, Variety, Price
- By Value, 2025-2030
- By Volume, 2025-2030
- By Average Price Per Unit, 2025-2030


 Request a Sample
 Ask for Customization
 Get a Quote
 Enquire Now