
 Download PDF
 Download PDF
Market Overview
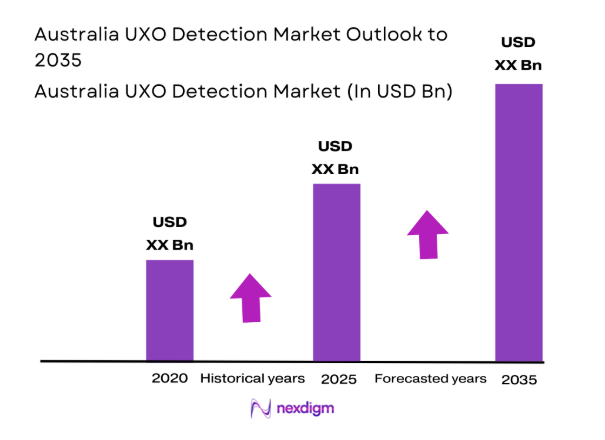
The Australia UXO Detection market current size stands at around USD ~ million reflecting steady operational demand driven by legacy military sites and offshore developments. Activity levels increased during 2024 and 2025 as multiple remediation programs progressed across land and marine environments. Detection deployments expanded across ~ projects with higher utilization of multi-sensor platforms. Survey intensity measured in ~ operational days rose consistently. Service-based engagements dominated market activity due to regulatory compliance requirements.
Demand concentration remains strongest in Western Australia, Queensland, and the Northern Territory due to historical defense usage and resource infrastructure density. Coastal zones supporting offshore energy and port expansion also show elevated activity levels. Mature contractor ecosystems cluster near major logistics hubs, enabling rapid mobilization. Regulatory oversight from defense and environmental agencies reinforces consistent demand. Remote inland regions face episodic demand linked to mining approvals.
Market Segmentation
By Application
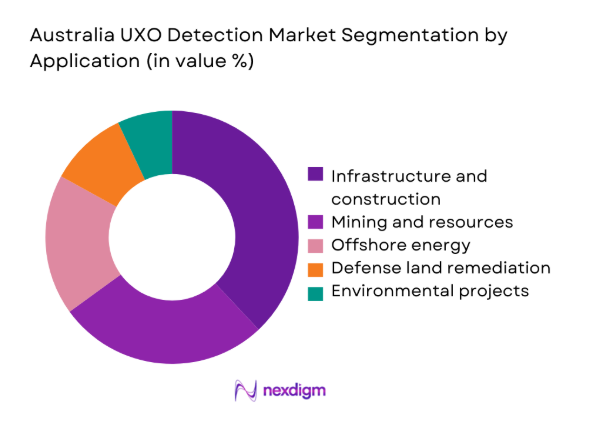
Infrastructure and urban redevelopment dominates the Australia UXO Detection market due to recurring remediation needs on former defense land parcels. Large-scale transport corridors, housing expansions, and industrial estates increasingly require UXO clearance approvals. Mining and resource extraction follow closely, particularly across remote regions with historical training ranges. Offshore energy, including subsea cables and wind installations, shows accelerating detection demand. Environmental remediation projects contribute steady baseline activity. Application dominance is reinforced by strict safety compliance frameworks and project financing conditions.
By Technology Architecture
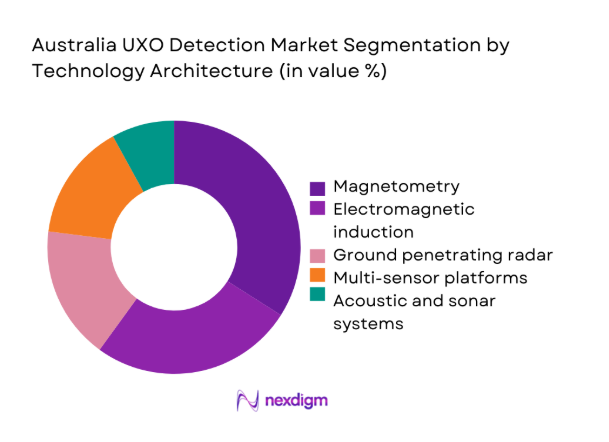
Magnetometry-based systems remain the most widely deployed technology architecture due to proven reliability across diverse terrains. Electromagnetic induction solutions are gaining adoption for improved discrimination accuracy. Ground penetrating radar usage increases in complex soil conditions requiring depth profiling. Multi-sensor integrated platforms show the fastest uptake, combining complementary detection strengths. Acoustic and sonar-based systems remain concentrated in marine environments. Technology choice is strongly influenced by regulatory acceptance and site-specific conditions.
Competitive Landscape
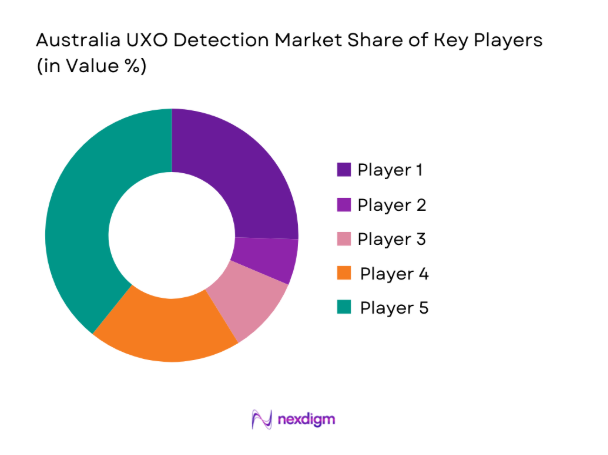
The Australia UXO Detection market features a mix of specialized domestic contractors and international technology providers. Competition centers on technical capability, regulatory readiness, and integrated survey-to-disposal services. Long-term framework agreements and project-based tenders define competitive positioning.
| Company Name | Establishment Year | Headquarters | Formulation Depth | Distribution Reach | Regulatory Readiness | Service Capability | Channel Strength | Pricing Flexibility |
| Dynasafe | 1992 | Sweden | ~ | ~ | ~ | ~ | ~ | ~ |
| Chemring Group | 1905 | United Kingdom | ~ | ~ | ~ | ~ | ~ | ~ |
| Saab AB | 1937 | Sweden | ~ | ~ | ~ | ~ | ~ | ~ |
| Vallon GmbH | 1992 | Germany | ~ | ~ | ~ | ~ | ~ | ~ |
| Fugro | 1962 | Netherlands | ~ | ~ | ~ | ~ | ~ | ~ |
Australia UXO Detection Market Analysis
Growth Drivers
Expansion of infrastructure projects on former military land
Infrastructure redevelopment across former military land continues expanding due to urban growth pressures and government land release programs nationwide. Many of these sites contain historical unexploded ordnance requiring mandatory detection before construction approvals. During 2024, clearance prerequisites increased across ~ redevelopment zones linked to transport and housing initiatives. Regulatory enforcement ensures UXO surveys are integrated early into project planning phases. Developers increasingly allocate remediation timelines within feasibility assessments to mitigate approval delays. Detection demand rises alongside brownfield redevelopment intensity across metropolitan peripheries. Coordination between defense authorities and civil planners improves project visibility. Specialized contractors benefit from repeat engagements across multi-year redevelopment pipelines. Infrastructure-led demand remains resilient despite cyclical construction variability. This driver maintains consistent baseline utilization across land-based detection services.
Increased offshore wind and subsea cable developments
Offshore energy expansion creates new UXO detection requirements across seabed areas previously impacted by naval activity. Subsea cable routes and turbine foundations require comprehensive survey clearance before installation permits. In 2025, offshore project approvals expanded across multiple coastal jurisdictions. Marine UXO detection intensity increased measured by ~ survey kilometers. Developers prioritize high-resolution detection to reduce installation risks and insurance exposure. Regulatory frameworks mandate clearance certification prior to seabed disturbance. Advanced marine platforms support deeper and wider survey coverage. Collaboration between marine engineers and UXO specialists strengthens project execution. Offshore demand diversifies revenue streams beyond land-based projects. This driver accelerates adoption of autonomous underwater detection systems.
Challenges
High operational costs and specialized skill requirements
UXO detection operations involve specialized equipment, trained personnel, and strict safety protocols that elevate operational complexity. Skilled EOD professionals require extensive certification and experience to operate within regulatory frameworks. In 2024, workforce availability constraints affected ~ project timelines. Mobilization to remote sites increases logistical burdens and resource planning challenges. Equipment maintenance and calibration requirements add operational overhead. Smaller contractors face scalability limitations due to capital intensity. Cost recovery depends on project sequencing efficiency and utilization rates. Safety compliance remains non-negotiable regardless of project scale. These factors collectively pressure operational margins. Managing cost structures remains a persistent market challenge.
Complex terrain and environmental access restrictions
Australia’s varied terrain introduces significant complexity for UXO detection activities across land and marine environments. Dense vegetation, rocky substrates, and tidal conditions limit sensor performance. Environmental protection zones impose access windows and operational constraints. In 2025, multiple projects experienced delays due to seasonal restrictions. Survey design must adapt to terrain-specific signal interference. Remote locations complicate logistics and emergency response planning. Weather variability affects marine survey continuity. Regulatory environmental approvals add procedural layers. Contractors must deploy tailored methodologies for each site. Terrain complexity directly impacts detection accuracy and project duration.
Opportunities
Growth in autonomous and unmanned detection platforms
Autonomous platforms present significant opportunities to enhance efficiency and coverage in UXO detection operations. Unmanned aerial and underwater systems reduce personnel exposure to hazardous environments. During 2024, adoption increased across ~ pilot projects. Autonomous platforms enable extended survey durations with consistent data quality. Reduced reliance on large crews improves operational scalability. Technology advancements support integration with existing sensor payloads. Regulatory acceptance is gradually improving for unmanned operations. Data consistency enhances post-processing accuracy and reporting confidence. Cost efficiency improves over multi-project deployments. This opportunity supports long-term transformation of detection workflows.
Integration of AI-based data interpretation
AI-based data processing offers opportunities to improve anomaly classification and reduce false positives. Advanced algorithms support faster interpretation of complex sensor datasets. In 2025, AI-assisted analysis reduced review times across ~ datasets. Improved discrimination enhances clearance decision confidence. Operators benefit from standardized interpretation methodologies. AI integration supports knowledge retention across projects. Continuous learning models adapt to terrain-specific signatures. Regulatory bodies increasingly recognize digital validation tools. Data-driven insights improve project planning accuracy. This opportunity strengthens value propositions beyond hardware deployment.
Future Outlook
The Australia UXO Detection market is expected to maintain steady momentum through 2035 supported by infrastructure redevelopment and offshore energy expansion. Technology adoption will continue shifting toward autonomous platforms and advanced analytics. Regulatory frameworks are likely to further formalize clearance standards. Long-term remediation programs will sustain baseline demand across regions.
Major Players
- Dynasafe
- Chemring Group
- Saab AB
- Vallon GmbH
- Foerster Group
- Guideline Geo
- Fugro
- Boskalis
- Jan De Nul Group
- Orica
- Downer Group
- BAE Systems Australia
- Lockheed Martin Australia
- GeoSonics
- NPA
Key Target Audience
- Defense and security agencies including Australian Department of Defence
- State environmental protection authorities
- Infrastructure and construction developers
- Mining and resource extraction companies
- Offshore energy developers
- Port authorities and maritime agencies
- Investments and venture capital firms
- Government and regulatory bodies including Safe Work Australia
Research Methodology
Step 1: Identification of Key Variables
Focused on identifying operational variables including detection technologies, application environments, and regulatory requirements across Australian contexts.
Step 2: Market Analysis and Construction
Involved structuring market dynamics through application mapping, technology penetration analysis, and service delivery models.
Step 3: Hypothesis Validation and Expert Consultation
Validated assumptions through expert consultations with clearance specialists and project stakeholders.
Step 4: Research Synthesis and Final Output
Synthesized findings into a cohesive analytical framework aligned with consulting-grade output standards.
- Executive Summary
- Research Methodology (Market Definitions and UXO hazard scope alignment for Australia, Military and legacy ordnance taxonomy and clearance depth classification, Bottom-up market sizing based on project awards and survey days, Revenue attribution by detection modality and service contract type, Primary interviews with defense EOD units and specialist contractors, Triangulation of tender data with site remediation records, Assumptions on unexploded ordnance density and access constraints)
- Definition and Scope
- Market evolution linked to defense training areas and infrastructure expansion
- Land and marine UXO survey and clearance workflows
- Industry ecosystem including survey, detection, and disposal services
- Supply chain structure for sensors, platforms, and services
- Australian defense, safety, and environmental regulatory environment

- Growth Drivers
Expansion of infrastructure projects on former military land
Increased offshore wind and subsea cable developments
Stricter safety compliance for construction and mining
Ongoing defense land remediation programs
Advancements in sensor accuracy and automation - Challenges
High operational costs and specialized skill requirements
Complex terrain and environmental access restrictions
Uncertainty in ordnance density and location data
Lengthy permitting and clearance approval processes
Limited availability of trained EOD personnel - Opportunities
Growth in autonomous and unmanned detection platforms
Integration of AI-based data interpretation
Public-private partnerships for large-scale remediation
Export of Australian expertise to Asia-Pacific projects
Lifecycle service contracts covering survey to disposal - Trends
Shift toward multi-sensor and data-fusion systems
Rising use of unmanned aerial and underwater vehicles
Greater emphasis on digital mapping and GIS integration
Standardization of clearance certification processes
Sustainability-focused remediation practices - Government Regulations
SWOT Analysis
Stakeholder and Ecosystem Analysis
Porter’s Five Forces Analysis
Competition Intensity and Ecosystem Mapping
- By Value, 2020–2025
- By Volume, 2020–2025
- By Active Systems, 2020–2025
- By Revenue per Survey Day, 2020–2025
- By Fleet Type (in Value %)
Airborne survey platforms
Ground-based mobile systems
Man-portable detection units
Marine surface vessels
Autonomous underwater vehicles - By Application (in Value %)
Defense training range clearance
Infrastructure and urban development sites
Mining and resource extraction areas
Ports and offshore energy projects
Environmental remediation zones - By Technology Architecture (in Value %)
Magnetometry systems
Ground penetrating radar
Electromagnetic induction sensors
Acoustic and sonar-based detection
Multi-sensor integrated platforms - By End-Use Industry (in Value %)
Defense and security
Construction and civil engineering
Mining and resources
Energy and utilities
Maritime and port authorities - By Connectivity Type (in Value %)
Wired data acquisition
Wireless real-time transmission
Offline data logging and post-processing - By Region (in Value %)
New South Wales
Queensland
Western Australia
Victoria
South Australia
Northern Territory
- Market structure and competitive positioning
- Market share snapshot of major players
Cross Comparison Parameters (Detection technology portfolio, Platform versatility, Geographic project experience, Compliance and certification capability, Data processing and reporting strength, Pricing and contract flexibility, Safety record and disposal integration, Local partnership presence) - SWOT Analysis of Key Players
- Pricing and Commercial Model Benchmarking
- Detailed Profiles of Major Companies
Dynasafe
Chemring Group
Saab AB
Vallon GmbH
Foerster Group
Guideline Geo
GeoSonics
Fugro
Boskalis
Jan De Nul Group
Orica
Downer Group
BAE Systems Australia
Lockheed Martin Australia
NPA (Norwegian People’s Aid
- Demand and utilization drivers
- Procurement and tender dynamics
- Buying criteria and vendor selection
- Budget allocation and financing preferences
- Implementation barriers and risk factors
- Post-purchase service expectations
- By Value, 2026–2035
- By Volume, 2026–2035
- By Active Systems, 2026–2035
- By Revenue per Survey Day, 2026–2035


 Request a Sample
 Ask for Customization
 Get a Quote
 Enquire Now