
 Download PDF
 Download PDF
Market Overview
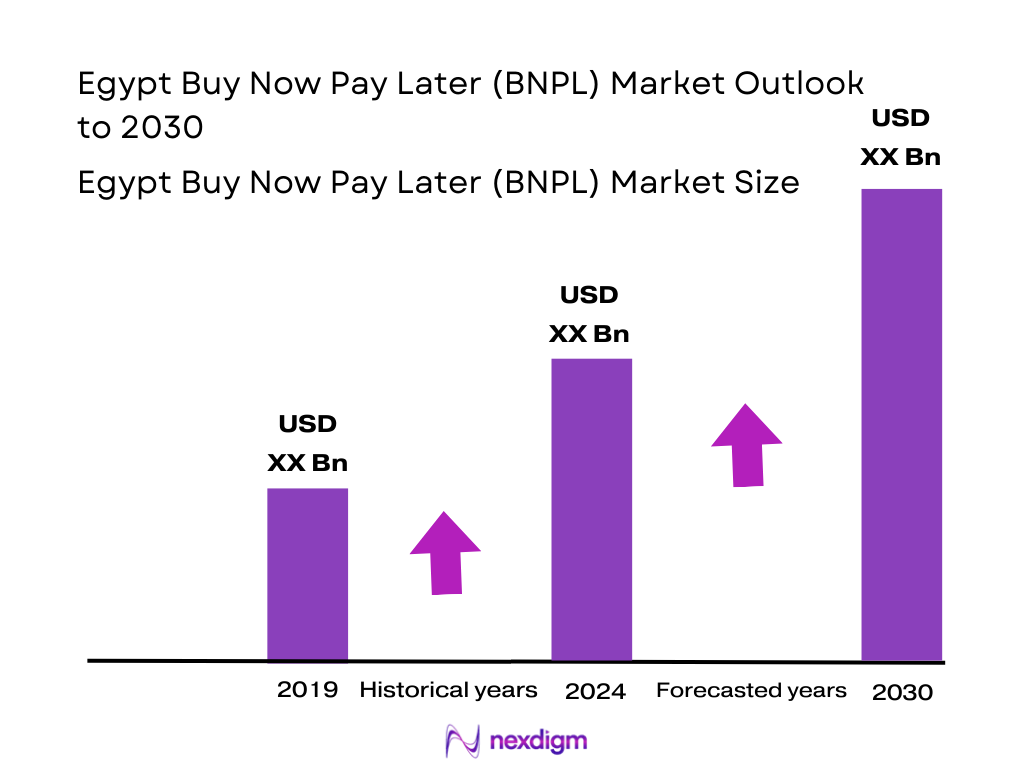
Egypt’s BNPL market is valued at USD 1.26 billion, supported by robust e‑commerce growth, limited traditional credit access, and rising consumer demand for flexible financing. This value reflects growth from US $907.1 million in the preceding year, driven by increased digital payments infrastructure and expanding merchant integration.
The BNPL market in Egypt is centered in Greater Cairo and Alexandria, due to their high e‑commerce penetration, dense population, and digital infrastructure. These urban centers lead adoption because local fintech players like valU, Shahry, and MNT‑Halan are headquartered there, offering strong merchant networks, fintech partnerships, and better digital access in those cities.
Market Segmentation
By Merchant Vertical
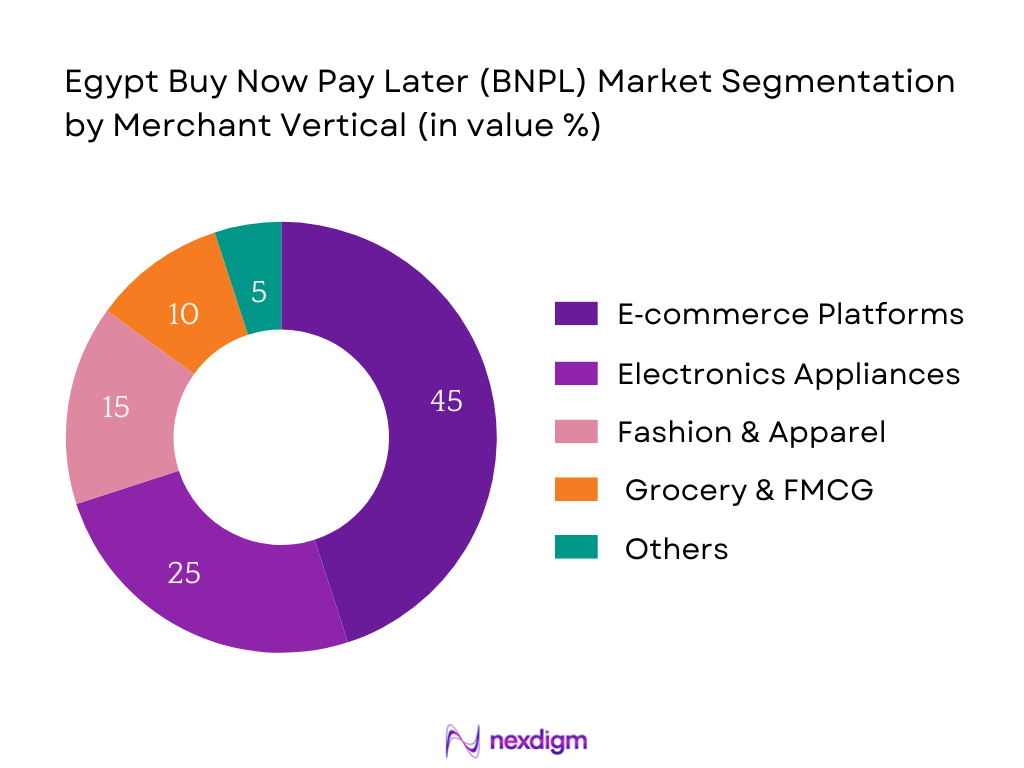
Egypt’s BNPL market is segmented by merchant verticals into e‑commerce platforms; electronics & home appliances; fashion & apparel; grocery & FMCG; and other services such as travel and healthcare. E‑commerce platforms dominate with approximately 45% market share. This dominance stems from their strong tech integration, broader product variety, and high customer trust. Leading online retailers incorporate BNPL at checkout, reducing cart abandonment and increasing average order value. The ease of integration, smartphone usage, and customer familiarity make e‑commerce the largest sub‑segment. Electronics follows, driven by high ticket items. Fashion & grocery contribute moderate shares due to habitual purchases; other services lag behind.
By Funding Model
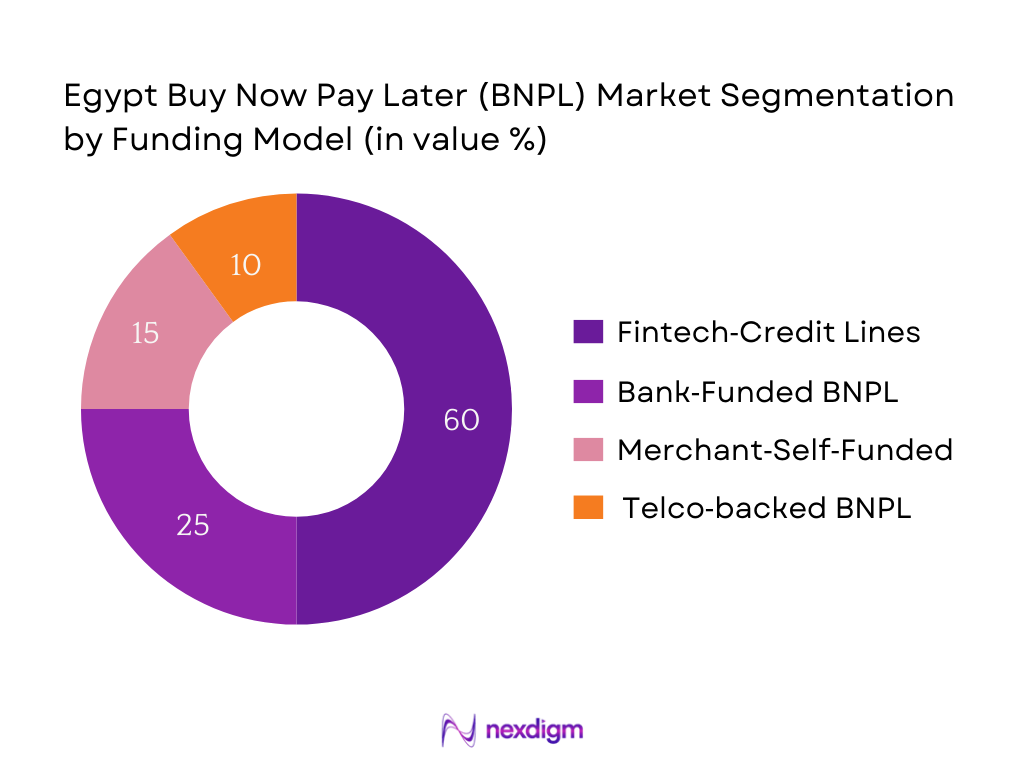
The BNPL ecosystem is categorized by funding model into fintech‑credit lines, bank‑funded BNPL, merchant‑self‑funded, and telco‑backed offerings. Fintech‑based credit lines account for roughly 50% of the market. This is attributed to agility, rapid underwriting using alternative data, and tailored pricing. Fintechs like valU and Shahry are prominent, partnering with retailers to offer embedded financing. Traditional banks constitute a smaller share due to stricter credit criteria and slower integration. Merchant‑self‑funded models appeal to larger retailers but are less widespread. Partnerships between telcos and fintechs are emerging but still minor in share.
Competitive Landscape
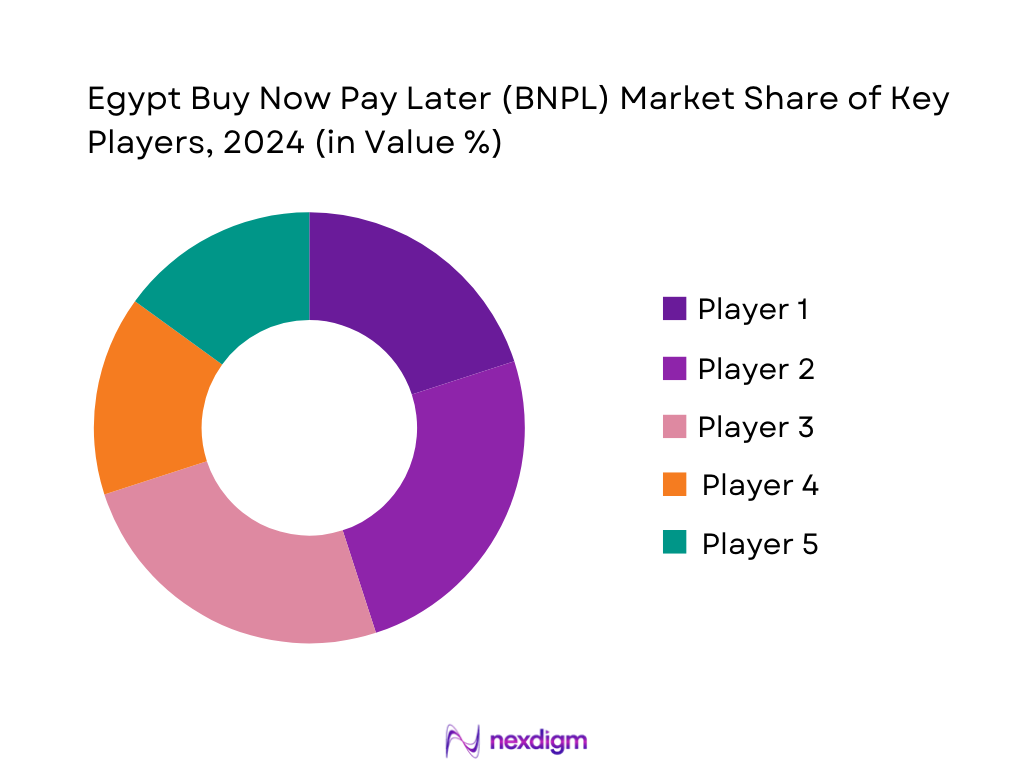
Egypt’s BNPL market is primarily led by strong local fintechs—valU, Shahry, MNT‑Halan—supported by emerging players and channel partnerships, reflecting a dynamic but consolidating competitive landscape.
| Company | Establishment Year | Headquarters | Risk Model (Alternative Data) | Funding Source Type | Approval Rate | Geographic Reach (Governorates) | Average Installment Duration | Default Rate |
| valU | 2016 | Cairo | – | – | – | – | – | – |
| Shahry | 2020 | Cairo | – | – | – | – | – | – |
| MNT‑Halan | 2017 | Cairo | – | – | – | – | – | – |
| Tamara (Egypt) | 2022 | Cairo | – | – | – | – | – | – |
| PayTabs BNPL | 2021 | Alexandria | – | – | – | – | – | – |
Egypt BNPL Market Analysis
Growth Drivers
Smartphone‑Driven E‑Commerce Surge
Egypt shows a digitally enabled environment, with 110.5 million active cellular connections in early 2024, equivalent to 97.3 percent of the population. Internet usage underscores this shift: 82.01 million individuals were online, representing 72.2 percent of the population in early 2024. Additionally, Egypt’s mobile internet subscriptions nearly doubled—from 39 million in 2019 to 69.4 million by 2022. These figures signal widespread smartphone access and internet adoption, enabling BNPL’s integration into online shopping, recall, and payment workflows. Consumers are increasingly transacting via mobile platforms, laying the groundwork for digital financing like BNPL across e‑commerce, mobile apps, and instant payment gateways.
Consumer Credit Card Gap vs BNPL Uptake
Egypt’s financial inclusion shows 52 million adult users with financial accounts by 2024, which is 74.8 percent of adults, facilitated through banks, Egypt Post, mobile wallets, and prepaid instruments like Meeza. Yet traditional credit instruments remain limited—most consumers rely on alternative channels such as BNPL. This discrepancy between relatively high account use and restricted credit card access, especially among young users (53.1 percent youth inclusion growth since 2020), creates a strong demand for BNPL solutions. BNPL bridges the gap by offering installment credit without requiring formal credit history or traditional plastic, aligning with the evolving financial behavior seen in Egypt’s expanding but underserved consumer segments.
Market Challenges
Default Risk and Collection Constraints
Egypt’s headline inflation declined from a peak of 38.0 percent in September 2023 to 25.7 percent by July 2024 —reflecting substantial consumer purchasing power pressure. While disinflation continues, M1 money supply grew by 31.1 percent by June 2024, up from 23.1 percent in 2021/22. High inflation erodes real incomes, limiting consumers’ repayment capability, while rapid money supply expansion can exacerbate inflation. BNPL providers face elevated risk of repayment default, especially when collections infrastructure is weak or lacks enforcement mechanisms. Digital onboarding without physical outreach complicates non‑performing loan management. Elevated macro pressure hinders sustainable repayment behaviors, forcing BNPL lenders to invest disproportionately in risk modeling and post‑sale collection strategies.
Merchant Tech Integration Barriers
Despite robust digital infrastructure, integration remains uneven. As of late 2024, Egypt’s ICT sector contributed 5.1 percent to GDP, with total ICT investments reaching USD 4.2 billion—a 20 percent increase over the previous year. Yet, among smaller merchants, especially in non‑urban areas, digital readiness remains limited. Lack of modern POS systems or e‑commerce platforms hinders seamless integration of BNPL checkout options. For merchants lacking API‑capable systems or familiarity with fintech partnerships, BNPL onboarding requires technical support and infrastructure investment. The variable digital maturity across retailers creates a bottleneck for scaling merchant‑side adoption, requiring BNPL firms to offer tech enablement services as part of their rollout.
Emerging Opportunities
Telco‑Fintech BNPL Collaborations
Egypt’s telecom sector remains robust: 110.5 million cellular connections by early 2024, covering 97.3 percent of population. This extensive telco reach positions operators such as Vodafone, Orange, and Etisalat as ideal BNPL partners. Collaborations can embed BNPL capabilities directly into mobile wallets or USSD channels, leveraging wide telco penetration for distribution. Given the growth in mobile internet users to 82 million and high telco familiarity, telco‑led BNPL can tap latent demand among even non‑banked users. Partnering with telcos allows rapid scaling, reduced CAC, and trust built on telco relationship.
Rural Penetration via Offline Aggregators
With 56.8 percent of the population in rural zones and only 43.2 percent urban share, significant underserved BNPL demand exists. Offline aggregators—like co‑ops, neighborhood merchants, and microfinance agents—can serve as BNPL conduits. Financial inclusion is rising: 52 million financially included adult users by 2024, reflecting base-level trust in formal accounts and money services. Aggregators can onboard rural consumers by facilitating digital enrollment, acting as payment collection points, or providing credit access. This creates new growth avenues, leveraging existing rural networks to expand BNPL beyond urban digital hubs and tap widespread but underserved demand.
Future Outlook
Over the 2024–2030 period, Egypt’s BNPL market is projected to continue its robust expansion, powered by rising digital adoption, e‑commerce growth, financial inclusion policies, and evolving fintech innovation. Consumer preference for flexible payments, combined with regulatory support and infrastructure developments, are expected to drive this growth trajectory.
Major Players
- valU
- Shahry
- MNT‑Halan
- Tamara (Egypt)
- PayTabs BNPL
- Halan (BNPL arm)
- Fatura
- Telda
- I‑Fin
- Bee BNPL
- Naqdy BNPL
- SweePay BNPL
- Fawry BNPL
- Sympl
- Creditopia BNPL
Key Target Audience
- Retail Investors and Venture Capitalist Firms (e.g. Algebra Ventures, A15 Ventures)
- Private Equity Investors with interest in fintech
- Fintech Companies Seeking Market Entry or Expansion
- Financial Institutions Considering BNPL Product Development
- Large Retail Chains Exploring Embedded Finance
- Payment Processors and Gateway Providers
- Telcos Exploring Financial Service Partnerships
- Government and Regulatory Bodies
Research Methodology
Step 1: Identification of Key Variables
This phase constructed a comprehensive ecosystem of BNPL stakeholders in Egypt—including retailers, fintechs, banks, regulators—based on desk research, secondary sources, and proprietary data to define key variables (GMV, adoption, funding models).
Step 2: Market Analysis and Data Construction
Historical data on GMV, transaction counts, average ticket sizes, user penetration, and funding models were compiled and analyzed to ensure accurate quantification of market size and segmentation.
Step 3: Hypothesis Validation and Expert Consultation
Market assumptions and hypotheses were refined through structured expert interviews with fintech executives, retailer CFOs, and regulatory advisors using CATI to gain practical and operational insights.
Step 4: Research Synthesis and Final Output
The final stage involved validating findings through direct engagement with major BNPL providers to confirm data on volume, funding sources, risk metrics, and regional reach, ensuring an integrated and validated market assessment.
- Executive Summary
- Research Methodology (Market Definitions and Assumptions, Abbreviations, Market Sizing Approach, Consolidated Research Approach, Primary and Secondary Research Inputs, Data Triangulation, Limitations and Future Assumptions)
- Definition and Scope
- Evolution of BNPL in Egypt
- Transactional Journey of BNPL in Egypt
- Stakeholder Mapping and Value Chain
- Consumer Credit Accessibility Landscape

- Key Growth Drivers
Smartphone-Driven E-Commerce Surge
Consumer Credit Card Gap vs BNPL Uptake
Central Bank’s Digital Finance Push
Rise in Urban Fintech Adoption - Key Market Challenges
Default Risk and Collection Constraints
Merchant Tech Integration Barriers
High CAC and Low Repeat Rate in Tier 2–3 Cities
Regulatory Grey Zones in Consumer Lending - Emerging Opportunities
Telco-Fintech BNPL Collaborations
Rural Penetration via Offline Aggregators
Credit Builder Products for Low-Score Users
Shariah-Compliant BNPL Products - Market Trends
Loyalty-driven Installment Models
Integration of BNPL in Government Digital Platforms
Wallet-Credit Hybrid Models
BNPL as a Channel for Consumer Analytics - Regulatory and Legal Framework
CBE Sandbox and Licensing Norms
APR Transparency & Disclosure Norms
Fintech Lending & Open Banking Readiness - SWOT Analysis
- Stakeholder Ecosystem
- Porter’s Five Forces
- By Gross Merchandise Value (GMV), 2019-2024
- By Number of BNPL Transactions, 2019-2024
- By Average Ticket Size, 2019-2024
- By Merchant Contribution to GMV, 2019-2024
- By BNPL Active User Base, 2019-2024
- By Merchant Category (In Value %)
E-commerce Platforms
Electronics & Appliances
Fashion and Apparel
Travel & Hospitality
Grocery & Quick Commerce - By Consumer Demographics (In Value %)
Millennials
Gen Z
Working Professionals
Students
Low-Credit or Unbanked Consumers - By BNPL Channel (In Value %)
Online Integrated BNPL
In-Store POS BNPL
Wallet-Based BNPL
Embedded Finance APIs - By Funding Model (In Value %)
Bank-Funded BNPL
Fintech Credit Lines
Merchant Self-Funded
Telco-backed Credit - By Credit Tenure (In Value %)
Pay-in-1 (No Interest)
2–3 Installments
4–6 Installments
7–12 Installments
- Market Share by GMV / Volume
Market Share by Merchant Onboarding - Cross Comparison Parameters (Risk Assessment Model Used, Funding Source Type, Merchant Integration Timeline, Default/Delinquency Rate, Region-wise Penetration, Revenue Model (Merchant vs Customer Fee), Transaction Approval Rate, Average Installment Duration Offered)
- Pricing Model & Fee Structures
- SWOT of Top Players
- Strategic Partnerships Landscape
- Product Differentiation Analysis
- Detailed Company Profiles
ValU
Khazna
Fawry BNPL
Tamara Egypt
Tabby Egypt
PayTabs BNPL
Sahl
Lucky Egypt
Telda
Sympl
Fatura
Blnk
Halan
Bee BNPL
I-Fin
- Target User Profiles and Purchase Behavior
- BNPL Affordability and Repayment Patterns
- Pain Points – Credit Access vs Trust
- Digital Journey – Discovery to Disbursal
- Purchase Frequency and Basket Size by Category
- By Gross Merchandise Value (GMV), 2025-2030
- By Number of BNPL Transactions, 2025-2030
- By Average Ticket Size, 2025-2030
- By Merchant Contribution to GMV, 2025-2030
- By BNPL Active User Base, 2025-2030


 Request a Sample
 Ask for Customization
 Get a Quote
 Enquire Now