
 Download PDF
 Download PDF
Market Overview
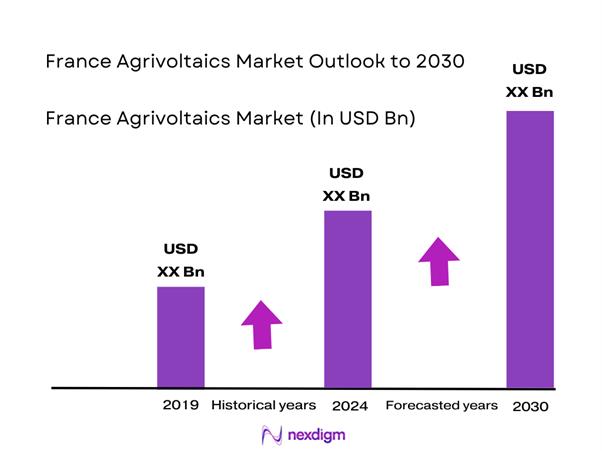
France’s agrivoltaics market is valued at USD ~ billion in the latest year, up from USD ~ billion in the prior year, reflecting accelerating project commissioning and larger “crop-protection + energy” canopy deployments. The step-up is reinforced by a clearer national rulebook for agrivoltaic eligibility (what qualifies as agrivoltaics vs. other agricompatible PV) and by the broader momentum in solar buildout—France’s installed photovoltaic base reached ~ GW in the latest year, while the preceding year’s PV additions were ~ GW (DC), expanding the execution capacity of developers/EPCs and the grid integration ecosystem that agrivoltaics relies on.
In France, agrivoltaics is most concentrated in regions anchored by high-value perennial crops and strong solar resource—Occitanie, Nouvelle-Aquitaine, Provence-Alpes-Côte d’Azur, and Auvergne-Rhône-Alpes—because vineyards, orchards, and specialty crops benefit disproportionately from controlled shading, hail/frost/heat mitigation, and irrigation load smoothing. These regions also have denser developer and agricultural innovation networks, shortening permitting-to-build cycles. Nationally, France’s PV system scale-up (with cumulative PV capacity reported around the mid-~-GW range across authoritative trackers) further strengthens dominance of these hubs by concentrating grid know-how, O&M capability, and bankability patterns around repeatable agrivoltaic templates.
Market Segmentation
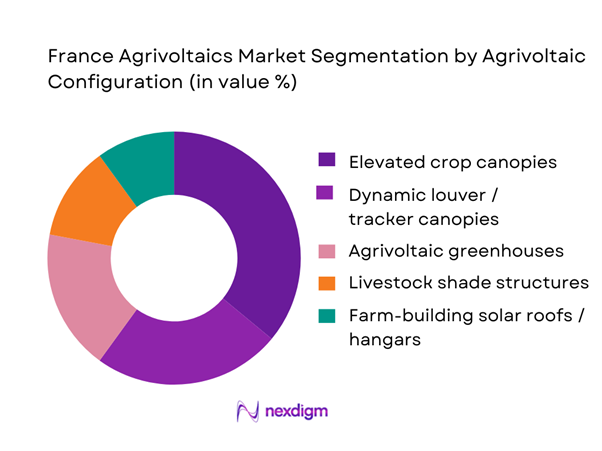
By Agrivoltaic Configuration
France’s agrivoltaics market is segmented by configuration into elevated crop canopies, dynamic louver / tracker canopies, agrivoltaic greenhouses, livestock shade structures, and farm-building solar roofs/hangars. In the latest year, elevated crop canopies hold the dominant market share because they match French farm operating reality: they preserve machine access (sprayers, harvesters, pruning platforms), keep the agricultural activity visibly primary during permitting review, and are easier to standardize for repeat deployment across vineyards/orchards and open-field specialty crops. Their engineering also fits lender comfort—simple structural typologies, predictable energy yield, and clearer agronomic monitoring plans—so they tend to clear “bankability” gates faster than fully dynamic systems. Dynamic canopies still grow where microclimate control is mission-critical, but capex/opex complexity and controls validation slow large-scale replication.
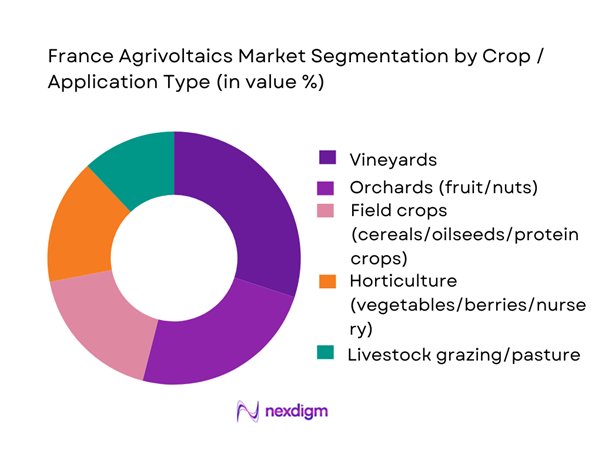
By Crop / Application Type
France’s agrivoltaics market is segmented by crop/application into vineyards, orchards (fruit/nuts), field crops (cereals/oilseeds/protein crops), horticulture (vegetables/berries/nursery), and livestock grazing/pasture systems. Vineyards dominate in the latest year because the agronomic value proposition is easiest to monetize: controlled radiation and heat protection support grape quality consistency, while hail and late-frost risk management is directly linked to revenue stability. Vineyards also have higher willingness (and ability) to adopt “protective infrastructure” when it improves climate resilience, making them ideal early adopters for agrivoltaic capex structures that bundle farm services with power sales. Orchards follow closely for similar reasons, but vineyards lead due to concentration of high-value estates, strong cooperative ecosystems, and faster standardization of canopy geometries over row crops.
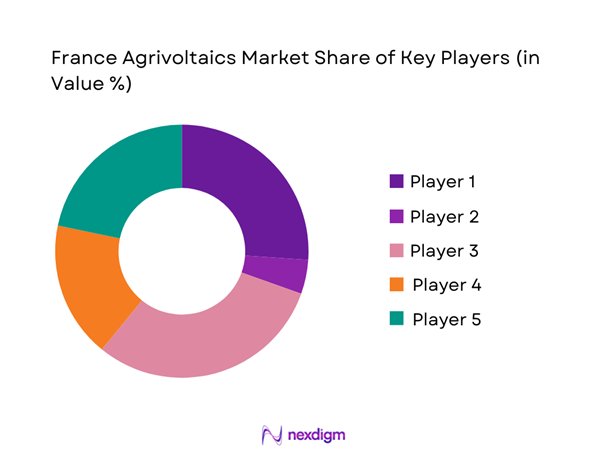
Competitive Landscape
France’s agrivoltaics ecosystem is led by a mix of specialist agrivoltaic designers (with proprietary canopy/control approaches), large IPPs scaling utility PV capabilities into agricultural settings, and integrated energy majors building agrivoltaics centers of expertise through acquisitions and partnerships. Market control is shaped less by sheer PV size and more by the ability to prove agronomic outcomes, permitting mastery under the national agrivoltaics framework, financing repeatability, and landowner/farmer partnership models that stand up to scrutiny.
| Company | Est. year | HQ | Core agrivoltaics approach | Typical crop fit in France | Differentiation lever | Permitting/acceptance strength | Financing stance | O&M / monitoring model |
| Sun’Agri (Sun’R Group) | 2009 | Lyon, France | ~ | ~ | ~ | ~ | ~ | ~ |
| TSE | 2016 | Sophia Antipolis, France | ~ | ~ | ~ | ~ | ~ | ~ |
| TotalEnergies (Ombrea) | 2016 | Aix-en-Provence, France | ~ | ~ | ~ | ~ | ~ | ~ |
| Akuo | 2007 | Paris, France | ~ | ~ | ~ | ~ | ~ | ~ |
| Voltalia | 2005 | Paris, France | ~ | ~ | ~ | ~ | ~ | ~ |
France Agrivoltaics Market Dynamics and Performance Analytics
Growth Drivers
Farm income risk hedging mechanics
France’s agrivoltaics adoption is anchored in “income smoothing” for farms operating in a large, weather-exposed agricultural base. Official agricultural accounts show France’s agricultural production value (excluding subsidies) at EUR ~ billion with EUR ~ billion from crop production and EUR ~ billion from animal production, underscoring the scale of farm cashflows that are sensitive to yield/quality shocks and input-cost swings. At the macro level, France’s economy recorded USD ~ billion GDP and USD ~ GDP per capita in the same reference year, supporting credit intermediation and long-duration contracting that farmers and developers use to structure land leases and farm-service payments. Agrivoltaics helps farms hedge by creating a second, contracted revenue stream while keeping agricultural use active; this aligns with regions where high-value crops (vineyards/orchards/market gardening) carry concentrated revenue risk per hectare. The logic is reinforced by the operational scale of the electricity system that can absorb distributed generation: France’s installed photovoltaic capacity reached ~ GW, enabling more standardized execution capacity (engineering, O&M, inverter supply, grid interface) that reduces project delivery uncertainty for farmer-hosted assets.
Climate volatility mitigation value
Agrivoltaics’ “performance analytics” in France is increasingly framed around measurable climate-risk mitigation for crops and livestock, which matters because national agricultural output is demonstrably impacted by adverse weather. Official accounts report total agricultural production value at EUR ~ billion, with crop production alone at EUR ~ billion, providing a clear baseline of exposure when heat, drought, hail, or excess rainfall disrupts yields and quality. The Pyrénées-Orientales drought episode illustrates the intensity of multi-season stress: meteorological reporting describes severe drought conditions over ~–~ in parts of southern France, with unusually persistent rainfall deficits and elevated temperatures driving agricultural constraints. Agrivoltaics creates a controllable microclimate layer (radiation and heat moderation, hail and frost buffering) and can be instrumented with on-site sensors to quantify outcomes such as canopy temperature, evapotranspiration proxies, and phenology timing—directly linking to farm KPIs. The system-level energy backdrop also supports the mitigation narrative: national PV capacity at ~ GW shows the grid and industry have scaled solar integration, making it operationally feasible to deploy agrivoltaics as “climate infrastructure” on farms rather than as isolated pilots.
Challenges
Permitting constraints on prime farmland
Permitting remains a primary bottleneck because projects must demonstrate agricultural primacy and avoid being perceived as “energy-first” occupation of prime land. France’s land sensitivity is not abstract: official statistics identify about ~ agricultural holdings, so local decisions are embedded in dense rural governance and farm succession realities. The economic base at stake is large—official accounts report EUR ~ billion crop production value within EUR ~ billion total agricultural production value, meaning authorities treat land productivity as a strategic asset. As solar has scaled (installed PV capacity ~ GW), scrutiny of siting has intensified; agrivoltaics is often held to a higher proof standard than simple rooftop PV because it occupies agricultural parcels and must maintain operational farming access. This raises documentation burdens (agronomic study design, machinery circulation plans, reversibility design, water management impacts), increases lead times, and elevates early-stage development cost even before grid work begins. Macro conditions help explain why this is a “France-specific” constraint: in a high-income economy with GDP per capita USD ~, land-use disputes are frequently adjudicated through formal administrative and legal pathways, which heightens compliance intensity for developers.
Qualification ambiguity and compliance burden
A persistent challenge is qualification: what precisely counts as agrivoltaics versus other solar-on-agriculture configurations, and what compliance evidence is required across crops, seasons, and farm types. Tender documents themselves show the system is actively adjusting definitions and eligibility—for example, deliberations explicitly discuss modifying eligibility conditions for serres agrivoltaïques and ombrières, reflecting the complexity of translating policy intent into tender-ready criteria. This ambiguity becomes an operational burden because projects must be designed not only for energy output but for auditable agricultural service delivery. Meanwhile, the broader solar system is scaling quickly (installed PV capacity ~ GW), leading to more projects competing for similar permitting bandwidth and administrative review capacity. On the agriculture side, the stakes are high: official accounts cite EUR ~ billion total agricultural production value, which pushes authorities toward conservative interpretations if agricultural primacy evidence is weak. Macro context amplifies the compliance intensity: with France GDP at USD ~ billion, the regulatory environment is mature and formalized, and compliance failures can trigger structured disputes rather than informal negotiation. As a result, developers increasingly need standardized agronomic protocols and traceable monitoring plans to avoid qualification setbacks.
Opportunities
Standardized design templates by crop
A high-impact growth opportunity is the industrialization of crop-specific agrivoltaic templates—repeatable engineering + agronomy “playbooks” for vineyards, orchards, horticulture, and grazing—because standardization reduces permitting friction and increases bankability. France already has the institutional base to accelerate this: a national agrivoltaics pole includes ~ signatory structures, which is a strong platform for harmonized protocols (what to measure, how to benchmark, how to prove agricultural primacy) and for translating research learnings into design rules. The economic incentive is clear from official numbers: total agricultural production value is EUR ~ billion, and crop production value is EUR ~ billion, meaning templates that protect crop quality and stabilize yields can unlock large areas of farmer interest without requiring novel contract structures each time. On the energy side, the existence of ~ GW installed PV capacity indicates the country already supports mature EPC and O&M capability; templates allow these solar teams to deliver agrivoltaics with less rework and fewer bespoke approvals. Standardization also helps align with grid realities: with ~ GW of PV projects in the queue, faster “design-to-permit” cycles can help agrivoltaics compete for connection slots by reducing pre-connection delays. This opportunity reflects future growth potential without needing future numeric forecasts: the current scale of agriculture, PV, and the research ecosystem already supports accelerated replication.
Retrofit of existing PV assets
A second growth opportunity is retrofitting certain existing PV sites into more agriculturally integrated assets—where feasible—by adding grazing management, biodiversity-productive corridors, or redesigned access and monitoring protocols that improve land-use acceptance and compliance posture. The opportunity exists because the PV base is already large: France’s installed PV capacity is ~ GW, meaning there is a meaningful stock of operational assets where “land and operations” can be optimized without waiting for greenfield permitting cycles. On the system side, the presence of ~ GW in the PV queue shows developers face intense competition for grid capacity; retrofits can sometimes progress through lighter modification pathways than new sites, improving time-to-impact under connection constraints. Agricultural relevance is supported by the scale of farming activity: official statistics report EUR ~ billion in total agricultural production value, and France’s farm structure includes around ~ holdings, so solutions that demonstrate productive land stewardship can improve stakeholder acceptance and reduce conflict intensity. Importantly, retrofit strategies can be performance-analytics led: they can introduce measurement (soil moisture, vegetation cover, livestock welfare proxies, biodiversity counts) that strengthens dual-use validation for regulators and communities. This is a “current-stats-backed” opportunity: existing PV capacity and queue levels already justify why retrofit pathways can become a practical growth lever for agrivoltaics-related services and hybrid land-use models.
Future Outlook
Over the next phase of development, France’s agrivoltaics market is expected to expand on three pillars: regulatory clarity (stronger definitions and compliance checks), repeatable engineering templates (standard canopy archetypes that reduce design-to-permit time), and agronomic proof at scale (multi-site evidence that crop outcomes remain primary). The country’s broader PV buildout momentum supports supply chain depth, while agrivoltaics will increasingly compete on “farm services delivered” rather than only kWh. Market growth is also likely to favor players that can bundle farmer contracts, monitoring, and bankable performance guarantees alongside grid and offtake execution.
Major Players
- Sun’Agri
- TSE
- TotalEnergies
- Voltalia
- Akuo
- ENGIE
- EDF Renewables
- Neoen
- BayWa r.e.
- RWE Renewables France
- Valorem
- Q ENERGY France
- Urbasolar
- Tenergie
Key Target Audience
- Utility-scale solar IPPs and agrivoltaic developers
- Agricultural landowners, farm operators, and producer cooperatives
- Viticulture and orchard operators
- Grid stakeholders and connection ecosystem
- EPC contractors and structural canopy OEMs
- Corporate power buyers and offtakers
- Investments and venture capitalist firms
- Government and regulatory bodies
Research Methodology
Step 1: Identification of Key Variables
We construct an ecosystem map covering developers, farmers/landowners, grid entities, EPCs, canopy OEMs, offtakers, and regulators. Desk research consolidates policy definitions, tender pathways, and project typologies to define variables such as agronomic KPIs, canopy geometry, connection lead times, and permitting constraints.
Step 2: Market Analysis and Construction
We build the market using a bottom-up approach across active/pipeline projects, configuration types, and application clusters. Revenue is constructed from project value pools and commissioning cadence, cross-checked against publicly available market benchmarks and documented market sizing exhibits.
Step 3: Hypothesis Validation and Expert Consultation
We validate hypotheses via structured interviews with developers, agronomists, farmer groups, EPCs, and lenders to confirm adoption drivers, risk screens, and commercial terms (land leases, service bundles, monitoring obligations).
Step 4: Research Synthesis and Final Output
We triangulate findings against regulatory texts and sector-scale PV deployment indicators, then finalize segmentation shares, competitive positioning, and forward scenarios. Outputs emphasize investor-grade assumptions, bankability constraints, and execution bottlenecks specific to France.
- Executive Summary
- Research Methodology (Market definitions and legal taxonomy, assumptions, abbreviations, capacity unit normalization, land-area normalization, project-stage mapping, data triangulation approach, primary interview stack, tender database approach, limitations and validation rules)
- Definition and Scope
- Market Genesis and Adoption Pathway
- Agrivoltaics vs Ground-Mounted PV Positioning
- Ecosystem Map

- Growth Drivers
Farm income risk hedging mechanics
Climate volatility mitigation value
CRE tender pipeline support
Corporate decarbonization siting pull
Land-use conflict reduction
Acceptance uplift through dual-use validation - Challenges
Permitting constraints on prime farmland
Qualification ambiguity and compliance burden
Interconnection queues and grid upgrade exposure
Appeals and litigation risk
Agronomic underperformance risk - Opportunities
Standardized design templates by crop
Retrofit of existing PV assets
Regional farmer aggregation platforms
Insurer-linked performance warranties
Data-driven agronomy optimization - Trends
Dynamic shading automation
Sensor-driven agronomic monitoring
Hybrid irrigation and PV systems
Digital twin adoption - Regulatory & Policy Landscape
- SWOT Analysis
- Stakeholder & Ecosystem Analysis
- Porter’s Five Forces Analysis
- By Value, 2019–2024
- By Installed Capacity, 2019–2024
- By Connected and Contracted Capacity, 2019–2024
- By Land Area Under Agrivoltaics, 2019–2024
- By Number of Projects and Average Project Scale, 2019–2024
- By Technology Architecture (in Value %)
Dynamic shading systems
Fixed elevated canopy systems
Single-axis tracking elevated systems
Greenhouse PV systems
Livestock shelter and linear systems - By Application (in Value %)
Viticulture
Orchards
Market gardening
Arable crops
Livestock and grazing - By End-Use Industry (in Value %)
Commercial farms
Agricultural cooperatives
Research and demonstration farms
Institutional landholders - By Fleet Type (in Value %)
Small-scale pilot projects
Mid-scale commercial projects
Utility-scale agrivoltaic parks - By Region (in Value %)
Southern France
Western France
Central France
Eastern France
Northern France
- Competitive Landscape
- Cross Comparison Parameters (CRE award capacity and success ratio, land bank secured and contract tenor quality, grid-readiness score, agronomic proof stack, system architecture capability, co-activity operations model, monitoring and compliance reporting depth, execution capacity)
- Company Profiles
EDF power solutions
ENGIE Green
TotalEnergies
Voltalia
Akuo Energy
Neoen
BayWa r.e. France
Iberdrola France
European Energy France
Valorem
Tenergie
Urbasolar
Q ENERGY France
Lightsource bp France
- Farmer Personas
- Landowners & Rural Collectivities
- Developers & IPPs
- EPC/O&M Providers
- Lenders/Insurers
- By Value, 2025–2030
- By Installed Capacity, 2025–2030
- By Connected and Contracted Capacity, 2025–2030
- By Land Area Under Agrivoltaics, 2025–2030
- By Number of Projects and Average Project Scale, 2025–2030


 Request a Sample
 Ask for Customization
 Get a Quote
 Enquire Now