
 Download PDF
 Download PDF
Market Overview
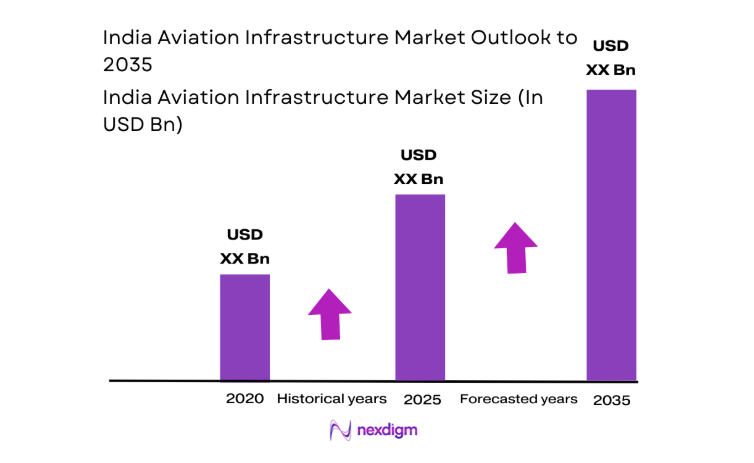
The India Aviation Infrastructure market current size stands at around USD ~ million, reflecting sustained investment momentum across airport development, air navigation modernization, and cargo handling facilities. Capital deployment is concentrated in terminal expansions, runway upgrades, and digital air traffic systems, with funding envelopes structured through long-tenure concessions and hybrid delivery models. Private participation frameworks and asset monetization vehicles are expanding the pipeline of brownfield upgrades, while greenfield programs extend network coverage. Commercial real estate integration and energy-efficient retrofits are increasingly embedded within project scopes.
Dominant activity clusters around Delhi NCR, Mumbai Metropolitan Region, Bengaluru, Hyderabad, and emerging regional hubs supported by strong intermodal connectivity. These regions benefit from mature EPC ecosystems, experienced airport operators, and established regulatory coordination. Cargo-centric corridors near industrial belts and coastal gateways show higher infrastructure density due to logistics demand concentration. Policy alignment across civil aviation, urban development, and renewable integration has improved project sequencing, while state-level facilitation cells accelerate clearances and utility provisioning for complex, multi-phase airport programs.
Market Segmentation
By Infrastructure Type
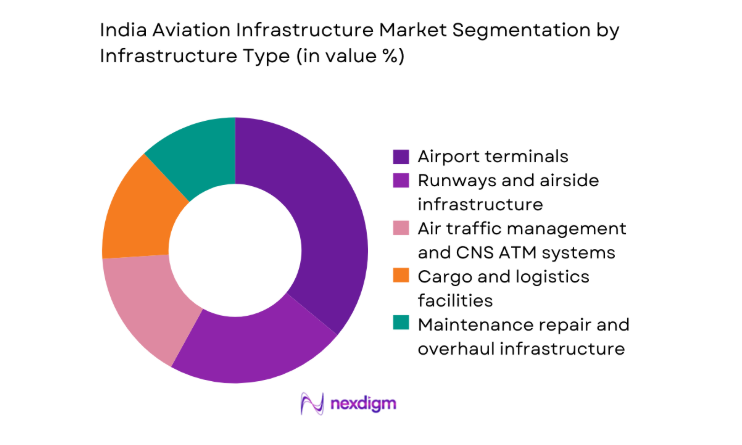
Terminal infrastructure dominates value contribution due to sustained capacity expansion, passenger processing modernization, and commercial integration within airport cities. Runways and airside systems follow, driven by slot saturation at primary hubs and safety-driven pavement upgrades. Air traffic management and CNS ATM upgrades gain momentum with performance-based navigation deployment and digital tower pilots improving operational resilience. Cargo terminals expand near industrial clusters to support perishables and e-commerce flows, while MRO hangars scale with fleet growth. Fuel farms and hydrant systems attract steady investment to improve turnaround times and reduce apron congestion across high-throughput airports.
By Ownership Model
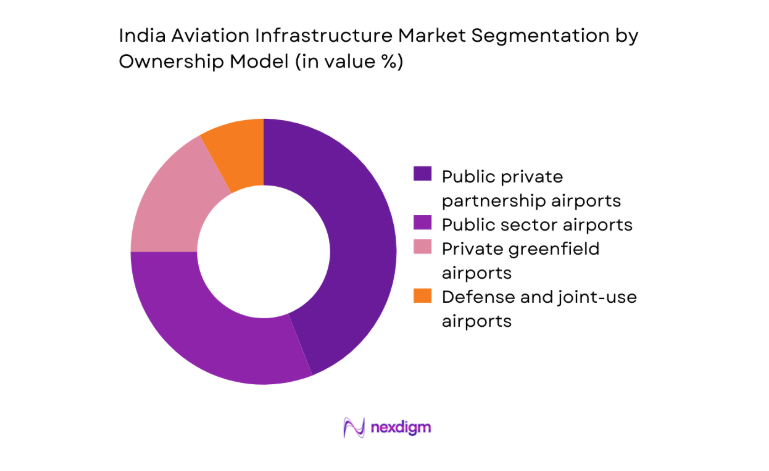
Public private partnership assets account for a dominant share of large-hub expansions due to long-tenure concession frameworks enabling lifecycle O and M integration. Public sector airports continue to anchor regional connectivity programs, particularly across tier 2 and tier 3 cities where viability gap mechanisms support network coverage. Private greenfield developments are selectively pursued near high-growth corridors with strong aerotropolis potential and real estate monetization prospects. Defense and joint-use facilities contribute incremental upgrades focused on safety compliance and dual-use capacity, supported by coordinated planning with civil authorities to unlock peak-hour slot utilization.
Competitive Landscape
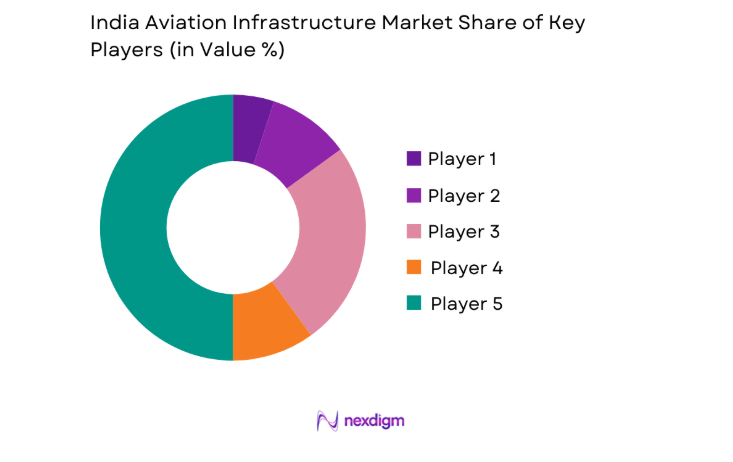
The competitive landscape features integrated EPC contractors, airport operators with concession portfolios, and technology providers delivering airside, terminal, and CNS ATM systems. Competitive positioning hinges on multi-project execution capability, regulatory readiness, and lifecycle service depth across brownfield and greenfield programs.
| Company Name | Establishment Year | Headquarters | Formulation Depth | Distribution Reach | Regulatory Readiness | Service Capability | Channel Strength | Pricing Flexibility |
| Airports Authority of India | 1995 | New Delhi | ~ | ~ | ~ | ~ | ~ | ~ |
| Adani Airport Holdings | 2019 | Ahmedabad | ~ | ~ | ~ | ~ | ~ | ~ |
| GMR Airports Infrastructure | 1996 | New Delhi | ~ | ~ | ~ | ~ | ~ | ~ |
| Larsen & Toubro Construction | 1938 | Mumbai | ~ | ~ | ~ | ~ | ~ | ~ |
| Tata Projects | 1979 | Hyderabad | ~ | ~ | ~ | ~ | ~ | ~ |
India Aviation Infrastructure Market Analysis
Growth Drivers
Rising domestic air traffic and UDAN route expansion
Domestic passenger volumes across scheduled carriers reached 152000000 in 2024, supported by 480 operational regional routes and 74 functional regional airports under connectivity programs. Fleet induction of 130 narrowbody aircraft between 2023 and 2025 expanded seat capacity and intensified peak-hour movements at primary hubs. The aviation regulator recorded 1950 daily departures in 2025, stressing terminal throughput and apron availability. Infrastructure authorities commissioned 12 terminal expansions and 9 runway rehabilitation projects during 2024 and 2025 to accommodate growth. State governments facilitated 41 last-mile access upgrades connecting airports to highways and metro corridors. These indicators elevate utilization pressure, driving accelerated infrastructure buildout.
Airport capacity saturation in tier 1 cities driving greenfield projects
Peak-hour slot utilization exceeded operational thresholds at Delhi and Mumbai with 52 coordinated movement windows constrained by runway occupancy times averaging 53 seconds during 2024. Bengaluru and Hyderabad processed 97000 and 81000 daily passenger movements respectively in 2025, triggering apron congestion and gate shortages. Environmental clearance approvals for 4 greenfield airports progressed in 2024, while 6 land parcels totaling ~ hectares were secured through state acquisition frameworks. The civil aviation ministry approved 18 master plan revisions to unlock parallel taxiways and rapid exit upgrades. These capacity constraints and approvals catalyze greenfield developments and brownfield expansions to relieve metropolitan saturation pressures.
Challenges
Land acquisition and right of way constraints
Airport expansion projects face prolonged land aggregation cycles, with median acquisition timelines extending to 28 months during 2024 due to fragmented holdings across 117 villages near proposed sites. Legal disputes affected 23 percent of notified parcels, delaying access roads and perimeter security works. Resettlement packages for 6400 households required inter-departmental coordination across revenue, urban development, and transport agencies. Utility relocation involved 190 kilometers of power and telecom corridors, adding construction sequencing risks. Environmental buffers near wetlands imposed setback constraints across 9 sites, limiting runway extension options. These frictions elongate project schedules and disrupt synchronized commissioning of terminals and airside systems nationwide.
Lengthy environmental and statutory clearances
Statutory approvals require sequential permits across aviation safety, wildlife, forest, and coastal regulation authorities, extending approval cycles to 18 months for brownfield upgrades and 26 months for greenfield sites during 2023 to 2025. Public hearings averaged 3 rounds per project, with 420 stakeholder submissions necessitating design revisions for drainage and noise contours. Wildlife clearance conditions mandated 14 bird hazard mitigation plans near sensitive habitats. Coastal regulation approvals constrained cargo terminal siting at 5 coastal airports. Compliance documentation volumes exceeded 2400 pages per project, slowing procurement milestones and contractor mobilization. These clearance timelines compress construction windows and increase coordination burdens across executing agencies.
Opportunities
Development of regional airports in tier 2 and tier 3 cities
Regional air connectivity programs activated 62 under-served airports by 2025, with average runway lengths upgraded to 2200 meters enabling A320 and B737 operations. Passenger processing buildings across 31 sites were standardized to modular designs enabling phased commissioning within 14 months. State governments committed 118 last-mile road links and 24 multimodal hubs to integrate airports with bus and rail corridors. The aviation authority approved 9 new instrument landing system installations during 2024 and 2025, improving all-weather operability. These deployments create scalable opportunities for terminal prefabrication, CNS ATM upgrades, and apron expansion packages across regional clusters.
Expansion of dedicated air cargo terminals and cold chain facilities
Air cargo throughput grew to 3300000 tons in 2024, supported by 18 new freighter routes and 240 weekly belly-hold services. Perishable handling capacity expanded with 27 temperature-controlled zones commissioned across major gateways in 2025, reducing dwell times by 11 hours per shipment cycle. Customs processing windows extended to 24 hours at 9 airports, accelerating transshipment flows. Logistics parks adjacent to airports added 460000 square meters of warehousing space during 2023 to 2025. These indicators support investments in cargo terminals, automated sortation, and integrated cold chain corridors linking production clusters to air gateways.
Future Outlook
The outlook through 2035 reflects sustained capacity creation across metropolitan hubs and accelerated regional network buildout, supported by policy continuity and private participation. Digital air traffic systems, modular terminals, and sustainability-linked retrofits are set to shape delivery models. Coordinated planning with multimodal logistics and urban development will define sequencing priorities. Risk management around land access and clearances remains central to schedule certainty.
Major Players
- Airports Authority of India
- Adani Airport Holdings
- GMR Airports Infrastructure
- Tata Projects
- Larsen & Toubro Construction
- Siemens India
- Thales India
- Honeywell India
- ABB India
- Hindustan Aeronautics Limited
- Raytheon India
- SNC-Lavalin India
- Afcons Infrastructure
- NCC Limited
- GVK Group
Key Target Audience
- Airports Authority of India and state aviation departments
- Directorate General of Civil Aviation and Bureau of Civil Aviation Security
- Private airport concessionaires and operators
- EPC contractors and infrastructure developers
- Air navigation service providers and CNS ATM integrators
- Logistics and air cargo terminal operators
- Investments and venture capital firms
- Ministry of Civil Aviation and state industrial development agencies
Research Methodology
Step 1: Identification of Key Variables
Core variables were defined across terminal capacity, runway throughput, CNS ATM readiness, cargo handling depth, and O and M maturity. Project typologies, ownership models, and regional demand nodes were mapped. Regulatory workflows and clearance dependencies were scoped. Risk factors across land access and utility relocation were incorporated.
Step 2: Market Analysis and Construction
Project pipelines were constructed using concession disclosures, master plans, and approved development programs. Capacity stress indicators across hubs and regional nodes were analyzed. Technology adoption pathways across digital towers and surface movement systems were integrated. Scenario construction aligned phasing with regulatory milestones.
Step 3: Hypothesis Validation and Expert Consultation
Assumptions on capacity constraints, regional connectivity acceleration, and cargo infrastructure scaling were validated through structured consultations with airport operators, air navigation specialists, and EPC program leads. Policy alignment and approval timelines were stress-tested. Implementation bottlenecks and sequencing risks were reviewed.
Step 4: Research Synthesis and Final Output
Findings were synthesized into segment-specific insights and execution pathways. Interdependencies across terminals, airside works, and CNS ATM systems were harmonized. Regional prioritization logic and ownership model implications were consolidated. Delivery risks and opportunity clusters were articulated for decision support.
- Executive Summary
- Research Methodology (Market Definitions and asset classes across airports and air navigation services, Primary interviews with airport operators airlines and EPC contractors, Capacity and capex tracking of AAI and private airport developers)
- Definition and Scope
- Market evolution
- Usage and capacity pathways
- Ecosystem structure
- Supply chain and channel structure

- Growth Drivers
Rising domestic air traffic and UDAN route expansion
Airport capacity saturation in tier 1 cities driving greenfield projects
Government focus on multimodal logistics and air cargo growth - Challenges
Land acquisition and right of way constraints
Lengthy environmental and statutory clearances
Financing risks and traffic forecast volatility - Opportunities
Development of regional airports in tier 2 and tier 3 cities
Expansion of dedicated air cargo terminals and cold chain facilities
Airport city and commercial real estate monetization - Trends
Adoption of biometrics and seamless passenger processing
Growth of modular terminal construction - Government Regulations
- SWOT Analysis
- Porter’s Five Forces
- By Value, 2020–2025
- By Volume, 2020–2025
- By Installed Base, 2020–2025
- By Average Selling Price, 2020–2025
- By Infrastructure Type (in Value %)
Airport terminals
Runways and airside infrastructure
Air traffic management and CNS/ATM systems
Cargo and logistics facilities - By Ownership Model (in Value %)
Public sector airports
Public private partnership airports
Private greenfield airports
Defense and joint-use airports - By Project Type (in Value %)
Greenfield airport development
Brownfield expansion and modernization
Capacity augmentation projects
Technology and digitization upgrades
Sustainability and energy transition projects - By Region (in Value %)
North India
West India
South India
East India
North East India
- Market share of major players
- Cross Comparison Parameters (project execution capability, PPP concession portfolio, ATC systems integration depth, civil works scale, technology partnerships, sustainability credentials, financial strength, O&M track record)
- SWOT Analysis of Key Players
- Pricing and Commercial Model Bench marketing
- Detailed Profiles of Major Companies
Airports Authority of India
Adani Airport Holdings
GMR Airports Infrastructure
Tata Projects
Larsen & Toubro Construction
Siemens India
Thales India
Honeywell India
ABB India
Hindustan Aeronautics Limited
Raytheon India
SNC-Lavalin India
Afcons Infrastructure
NCC Limited
GVK Group
- Demand and utilization drivers
- Procurement and tender dynamics
- Buying criteria and vendor selection
- Budget allocation and financing preferences
- Implementation barriers and risk factors
- By Value, 2026–2035
- By Volume, 2026–2035
- By Installed Base, 2026–2035
- By Average Selling Price, 2026–2035


 Request a Sample
 Ask for Customization
 Get a Quote
 Enquire Now