
 Download PDF
 Download PDF
Market Overview
The India Ed‑Tech market is valued at USD 5,552.3 million, based on a five‑year historical analysis derived from 2023 and 2024 data, with a substantial jump in funding from USD 207 million to USD 608 million—while still trailing the USD 2.1 billion peak in the pandemic years. This expansion is driven by rising middle‑class educational aspirations, deepening digital infrastructure, and evolving consumer expectations toward personalized and engaging online learning experiences.
Major Indian cities—such as Bengaluru, Delhi-NCR, Mumbai, and Hyderabad—dominate the Ed‑Tech space due to their robust talent ecosystems, investor presence, technology infrastructure, and concentration of leading Ed‑Tech firms. These urban hubs benefit from high smartphone penetration, strong broadband connectivity, and efficient policy ecosystems—empowering innovators and educators to scale platforms nationwide. No other countries within India’s region match the same combination of infrastructure and capital support.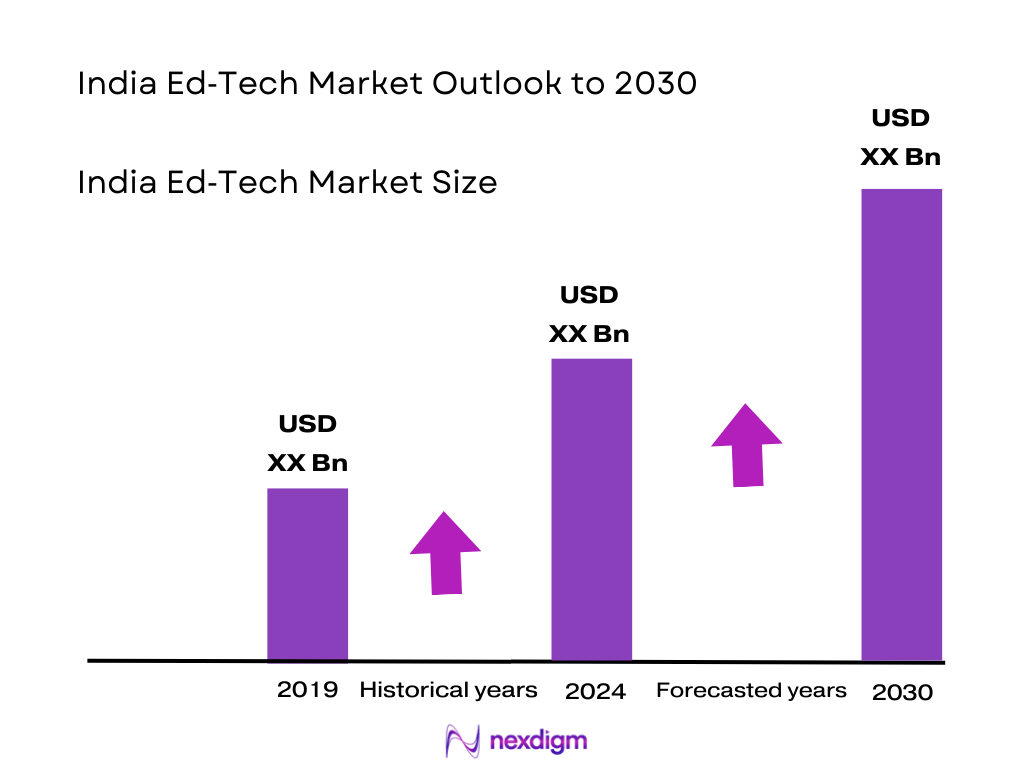
Market Segmentation
By Sector
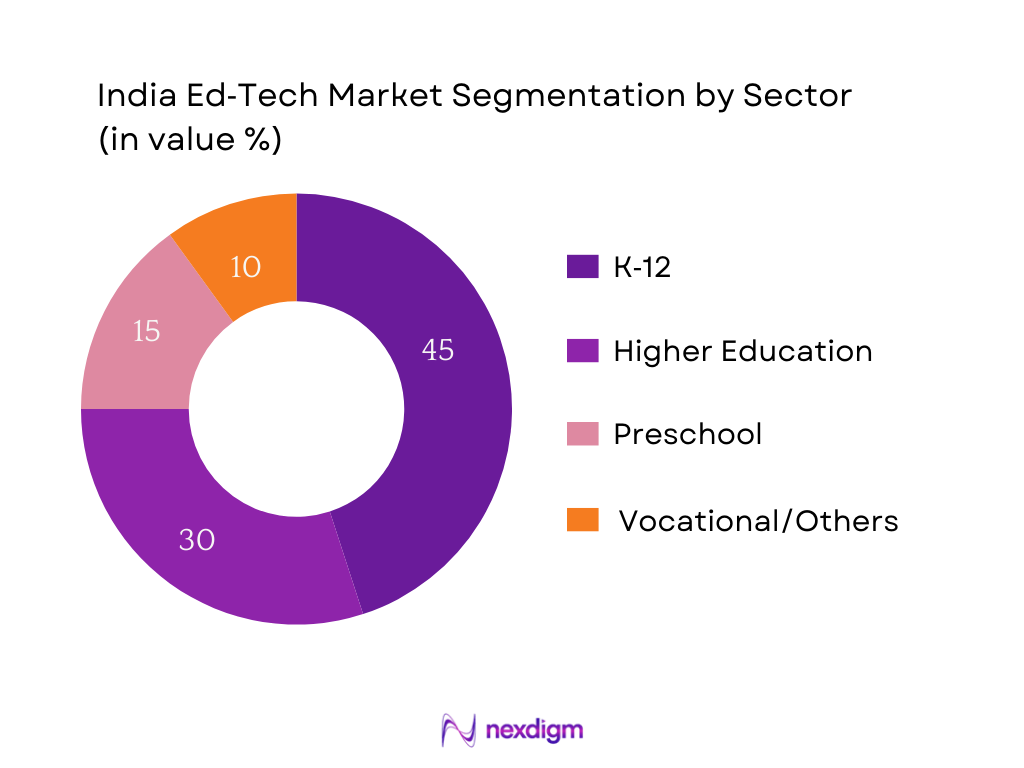
India Ed‑Tech market is segmented by sector into K‑12, Higher Education, Preschool, and Vocational/Others. Currently, K‑12 leads the market share due to ingrained demand from students and parents seeking academic support, exam preparation, and supplementary learning. Grassroots interventions like affordable live classes, curriculum-aligned content, and exam success stories have entrenched K‑12 platforms at the heart of Ed‑Tech adoption, reinforced by significant investments from major players.
By Product Type
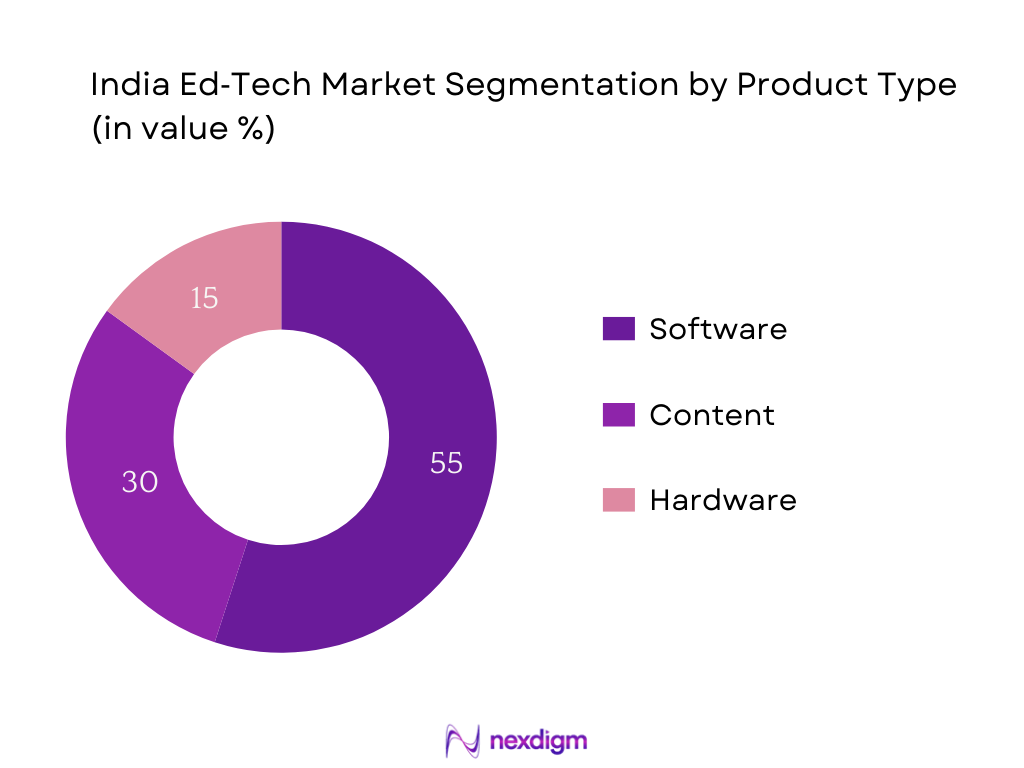
The market is segmented into Software, Content, and Hardware. The Software segment clearly dominates, driven by scalable platforms, mobile apps, and learning management systems that deliver live classes, practice tools, and AI-enabled assessments. This digital-first delivery model is cost-effective, flexible, and accessible—making software the central medium for Ed‑Tech consumption, especially in cost-sensitive but digitally literate markets.
Competitive Landscape
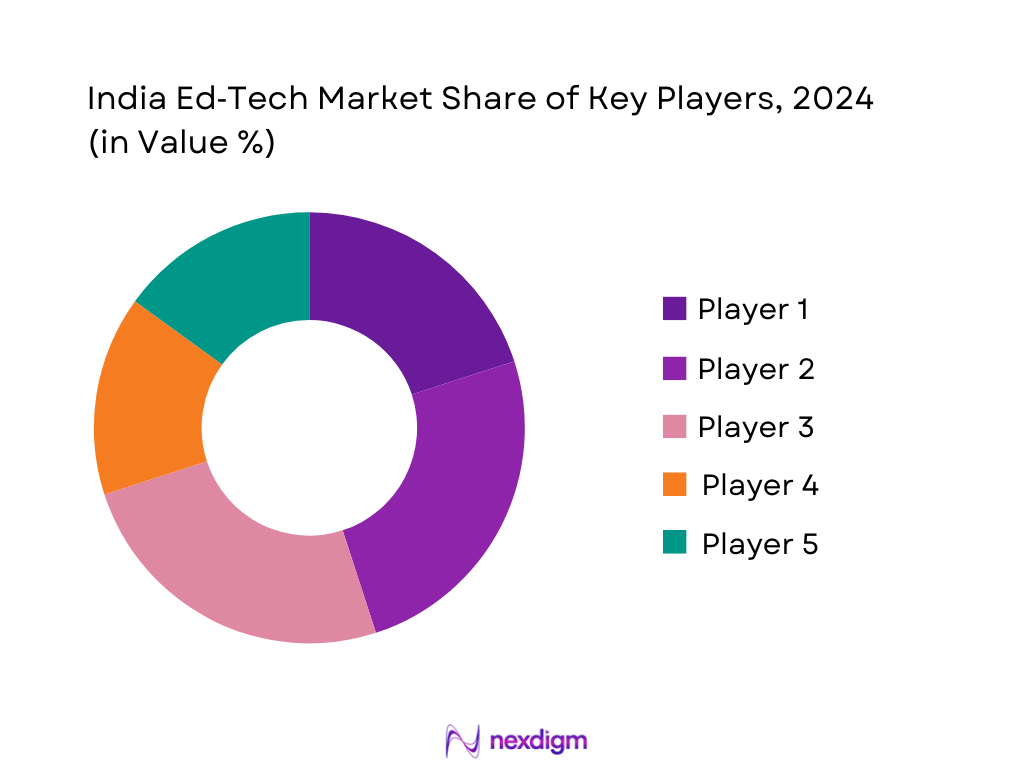
The India Ed‑Tech market is consolidated with a few dominant firms creating a competitive battleground. Below is the competitive landscape and a table featuring five major players with key specifics. India’s Ed‑Tech market is dominated by a handful of major players—including BYJU’S, Unacademy, PhysicsWallah, Vedantu, and Toppr—reflecting a landscape where brand equity, funding, and platform ecosystems shape competitive strength and user reach.
| Company | Establishment Year | Headquarters | Paid User Base (million) | ARPU (USD) | App Downloads (million) | Regional Penetration | Technology Stack Strength |
| BYJU’S | — | Bengaluru | — | — | — | — | — |
| Unacademy | — | Bengaluru | — | — | — | — | — |
| PhysicsWallah | 2016 | Prayagraj | — | — | — | — | — |
| Vedantu | — | Bengaluru | — | — | — | — | — |
| Toppr | — | Mumbai | — | — | — | — | — |
India Ed-Tech Market Analysis
Growth Drivers
Parent‑Led Spending in K‑12 and Test Prep
Internet and device availability in Indian households has soared: by 2023, India had 692 million internet users and 1.10 billion active cellular connections, reflecting sustained digital access in homes. Given that social media adoption reached 467 million users, it’s indicative of digitally-engaged families who are familiar and comfortable with online platforms. The prevalence of digital access in family environments, particularly in K‑12 households, encourages parental investment in Ed‑Tech for exam preparation and supplementary learning. With nearly one mobile connection per person, and widespread internet familiarity—even in lower-tier cities—parents are more likely to subscribe to digital learning platforms. Thus, pervasive household connectivity and digital familiarity are catalysing parent-led spending on K‑12 and test prep Ed‑Tech solutions.
AI & Gamification‑Enabled Personalized Learning
India’s digital access is not only widespread but robust: 4G coverage spans 95% of the population, and broadband subscribers reached 949 million, including 905 million wireless users, by late 2024. High internet bandwidth and connectivity stability enable interactive learning experiences using AI and game/assessment modules. Moreover, monthly per capita data consumption at 32 GB alongside 290 million 5G subscriptions shows that the network backbone can support rich, data-intensive Ed‑Tech offerings such as adaptive learning systems and real-time evaluations. This digital infrastructure, combined with policy backing under the digital stack and DPI model, equips platforms to deliver AI-enabled personalization and gamified learning conducive to engagement and retention.
Market Challenges
High Customer Acquisition Costs (CAC)
High data consumption—32 GB per user monthly—and ubiquitous 5G subscriptions at 290 million—reflect a mature digital environment where acquisition via digital channels is expensive. Fierce competition among Ed‑Tech platforms to capture attention in a crowded digital ecosystem raises marketing costs. Moreover, saturation in smartphone and internet reach means differentiating offerings becomes costlier, increasing CAC. Platforms need to invest more in content personalization and brand building to engage users, particularly with urban and rural audiences already digitally inundated.
Platform Fatigue and Content Redundancy
India’s telecommunication statistics—1.19 billion subscribers, 949 million broadband users, and nearly full internet penetration—point to potential platform fatigue in a highly connected environment. Consumers with multiple content sources—OTT, social media, Ed‑Tech—may experience burnout, diminishing attention span for additional learning platforms. Without differentiated architecture and unique pedagogical value, new Ed‑Tech offerings risk redundancy. Market players must innovate continuously to capture user retention amid content overload.
Opportunities
ONDC Integration for Learning Commerce
India’s digital infrastructure expansion—internet connections rising to 96.96 crore in mid‑2024 and broadband users nearing 949 million—lays the groundwork for integrating learning offerings into domestic commerce platforms. ONDC (Open Network for Digital Commerce) aims to democratize e-commerce; embedding Ed‑Tech services into this network could enable seamless discovery and payment of courses via widely used commerce interfaces. With 4G covering 95% of the population and 290 million 5G subscribers, real-time access to marketplaces is practical even in smaller towns. Thus, leveraging ONDC can extend Ed‑Tech reach by linking educational products with familiar digital purchasing pathways.
Vernacular & Regional Language Growth
India’s 2024 internet user base—886 million, with 488 million rural users (55 percent)—indicates deepening digital engagement across vernacular-speaking geographies. Rural internet adoption is high, but content largely remains in English or Hindi. There is a strong opportunity for Ed‑Tech platforms delivering localized content in regional languages. Government reports show that 398 million rural subscribers are accessing internet increasingly. By addressing linguistic diversity and cultural nuance, platforms can unlock vast untapped learner segments, improving access and retention. The data infrastructure supports rich content delivery, and vernacular Ed‑Tech can bridge current engagement gaps.
Future Outlook
Over the next six years, the India Ed‑Tech market is expected to exhibit robust expansion, supported by digital infrastructure improvements, policy push (under NEP 2020), and growing demand from tier‑II/III markets. Continuous innovation in AI-driven personalization, regional vernacular content, and affordability will further accelerate inclusive growth across sectors.
Major Players
- BYJU’S
- Unacademy
- PhysicsWallah
- Vedantu
- Toppr
- Adda247
- Simplilearn
- UpGrad
- Cuemath
- Classplus
- Teachmint
- Eruditus
- Embibe
- Great Learning
- LEAD School
Key Target Audience
- Investments and Venture Capitalist Firms
- Government and Regulatory Bodies (e.g., Ministry of Education, NITI Aayog)
- Digital Infrastructure Providers
- School & University Boards
- Skill Development Councils
- Regional State Education Departments
- Ed‑Tech Platform Strategy Teams
- Telecom and Broadband Service Providers
Research Methodology
Step 1: Identification of Key Variables
We mapped critical ecosystem elements—including digital infrastructure, learner segments, and policy frameworks—using secondary data and other proprietary education databases to establish foundational scope.
Step 2: Market Analysis and Construction
Historical revenue and enrolment data—such as USD 5,552.3 million for 2023/24—were compiled, with trend analysis across K‑12 and software segments. Performance metrics such as funding flows (e.g., USD 608 million in 2024) were validated against Venture Intelligence.
Step 3: Hypothesis Validation and Expert Consultation
We engaged with operational leaders—from major Ed‑Tech firms and investors—via structured interviews to test hypotheses around user behaviour, regional adoption trends, and business model sustainability.
Step 4: Research Synthesis and Final Output
Cross-verification with industry stakeholders and public filings (e.g., IAMAI / Grant Thornton) helped consolidate numbers, validate growth forecasts (CAGR), and cross-check competitive positioning.
- Executive Summary
- Research Methodology (Market Definitions and Assumptions, Abbreviations, Market Sizing Approach, Consolidated Research Approach, Understanding Market Potential Through In-Depth Industry Interviews, Primary Research Approach, Limitations and Future Conclusions)
- Definition and Scope
- Industry Genesis and Evolution Timeline
- India Ed-Tech Ecosystem Overview
- Value Chain Analysis (Content Providers, Platforms, Educators, Distribution)
- Regulatory Bodies and Policy Landscape (NEP 2020, UGC Guidelines, ASCI Ed-Tech Policy)
- Business Cycle and Digital Adoption Stages
- Technology Penetration and Infrastructure Readiness
- Stakeholder Mapping (Government, Investors, Students, Teachers, Aggregators)

- Growth Drivers
Digital India Push and NEP 2020 Acceleration
Surge in Mobile-First and Tier-II/III Demand
Increasing Working Professional Skilling Needs
Parent-Led Spending in K-12 and Test Prep
AI & Gamification-Enabled Personalized Learning - Market Challenges
High Dropout and Low Completion Rates
Unregulated Advertising and Trust Deficit
Revenue Model Struggles in Freemium Platforms
High Customer Acquisition Costs (CAC)
Platform Fatigue and Content Redundancy - Opportunities
ONDC Integration for Learning Commerce
Vernacular & Regional Language Growth
AR/VR for Experiential Learning
Ed-Tech for Bharat Strategy
Government Collaborations & Skill India - Trends
AI-Powered Mentoring & Feedback Systems
Integration of Microlearning and Gamification
Rise of Career Outcome-Based Learning Paths
Community-Based and Peer-Led Learning
Offline-Online Hybrid Expansion - Government Regulation
NEP 2020 Rollout Impact
ASCI and Ed-Tech Advertising Norms
FDI in Ed-Tech and Fund Movement
Edu-Startup Sandbox and Pilot Schemes
Accreditation and Outcome Measurement Initiatives - SWOT Analysis
- Stake Ecosystem
- Porter’s Five Forces
- By Value, 2019-2024
- By Enrolments, 2019-2024
- By Average Revenue per User (ARPU), 2019-2024
- By Freemium vs. Subscription Models, 2019-2024
- By Learning Model (In Value %)
Live Interactive
Self-Paced
Hybrid
AI-Based
Gamified - By Learner Category (In Value %)
K-12
Test Prep
College Students
Working Professionals
Vocational Learners - By Course Type (In Value %)
School Curriculum
Competitive Exams
Higher Education
Certification
Language Learning
By Platform Type (In Value %)
App-Based
Web-Based
Smart TV
OTT Integrated
Chatbot-Led - By Region (In Value %)
North
South
East
West
Central
- Market Share by Category (K-12, Test Prep, Upskilling, Certifications, Language Learning)
Market Share by Player Type (Freemium, Subscription, Enterprise-Led) - Cross Comparison Parameters (Company Overview, Revenue Model, No. of Paid Users, ARPU, CAC, Retention Rate, Content Depth, Technology Stack, Faculty Strength, App Ratings, Regional Penetration, Certifications/Accreditations)
- SWOT Analysis of Major Players
- Detailed Profiles of 15 Major Players
BYJU’S
Unacademy
Vedantu
PhysicsWallah
Toppr
Adda247
Simplilearn
UpGrad
Cuemath
Classplus
Teachmint
Eruditus
Embibe
Great Learning
LEAD School
- Consumer Behavior in Tier 1 vs. Tier 2/3 Cities
- Budget Allocation for Paid Learning
- Engagement vs. Retention Curve
- Decision-Making Metrics for K-12 Parents
- B2B Ed-Tech Buyer Behavior (Colleges, Schools, Coaching Chains)
- Employer Partnerships in Upskilling Ed-Tech
- By Value, 2025-2030
- By Enrolments, 2025-2030
- By ARPU, 2025-2030
- By Business Model Type, 2025-2030


 Request a Sample
 Ask for Customization
 Get a Quote
 Enquire Now