
 Download PDF
 Download PDF
Market Overview
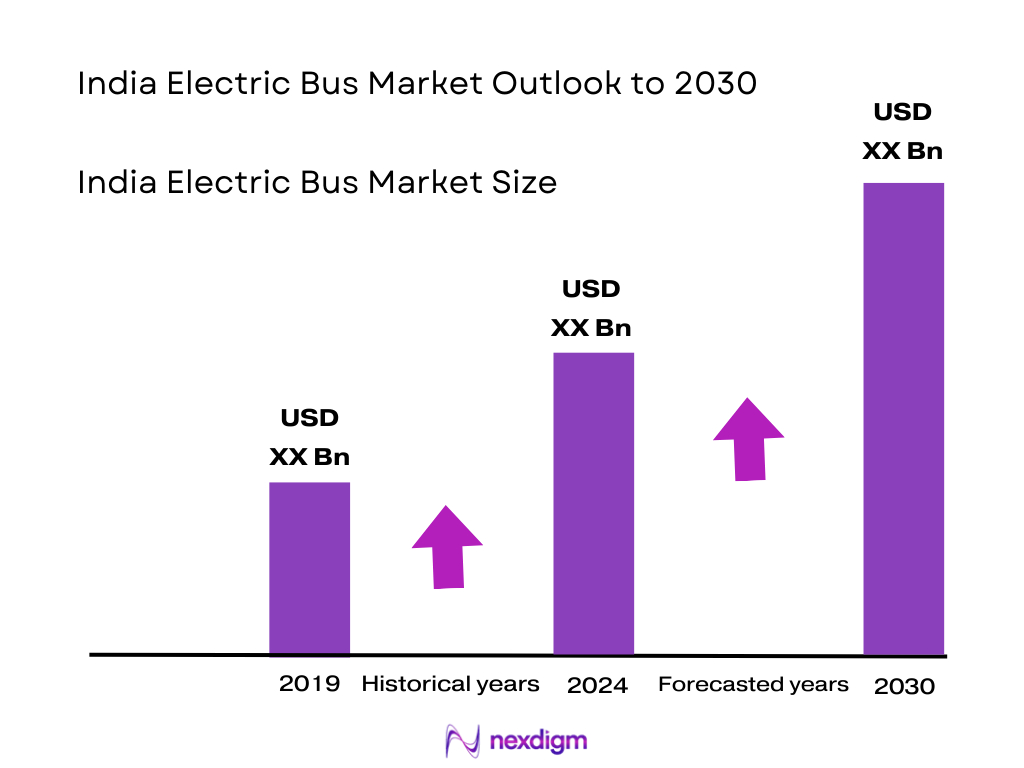
The India Electric Bus market is valued at USD 331.9 million, based on comprehensive assessment of recent industry data. This figure reflects a rise from USD 282.7 million in the prior year, highlighting strong momentum driven by aggressive government EV procurement schemes, policy support like FAME‑II and PM‑eBus Sewa, and urban transit modernization initiatives.
Major cities such as Delhi, Bengaluru, and Pune lead market dominance due to their environmental stress, progressive urban transit goals, and established charging infrastructure. Delhi, for instance, has built one of India’s largest electric bus fleets and continues to accelerate deployment through centralized command and high depot readiness.
Given the consistency of underlying drivers and adoption trends, the market is projected to expand robustly at approximately 18–23% CAGR across 2024–2030, with a mid‑range estimate of around 20% CAGR, acknowledging variability among sources.
Market Segmentation
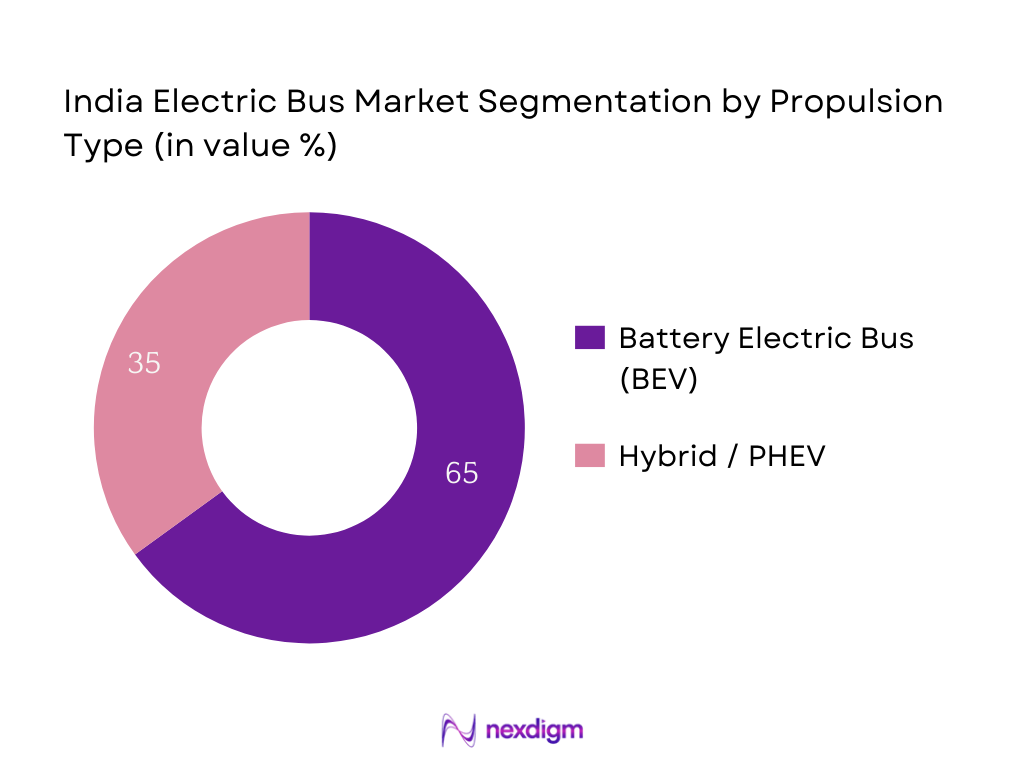
By Propulsion Type
India Electric Bus market is segmented into BEV and Hybrid/PHEV categories. BEV dominates with 65 % market share, primarily due to strong subsidy support under FAME‑II schemes and PM‑eBus Sewa for fully electric models, combined with lower operational costs and zero emissions. This makes BEVs highly attractive for state transport undertakings and municipal operators, pushing them ahead of hybrid alternatives.
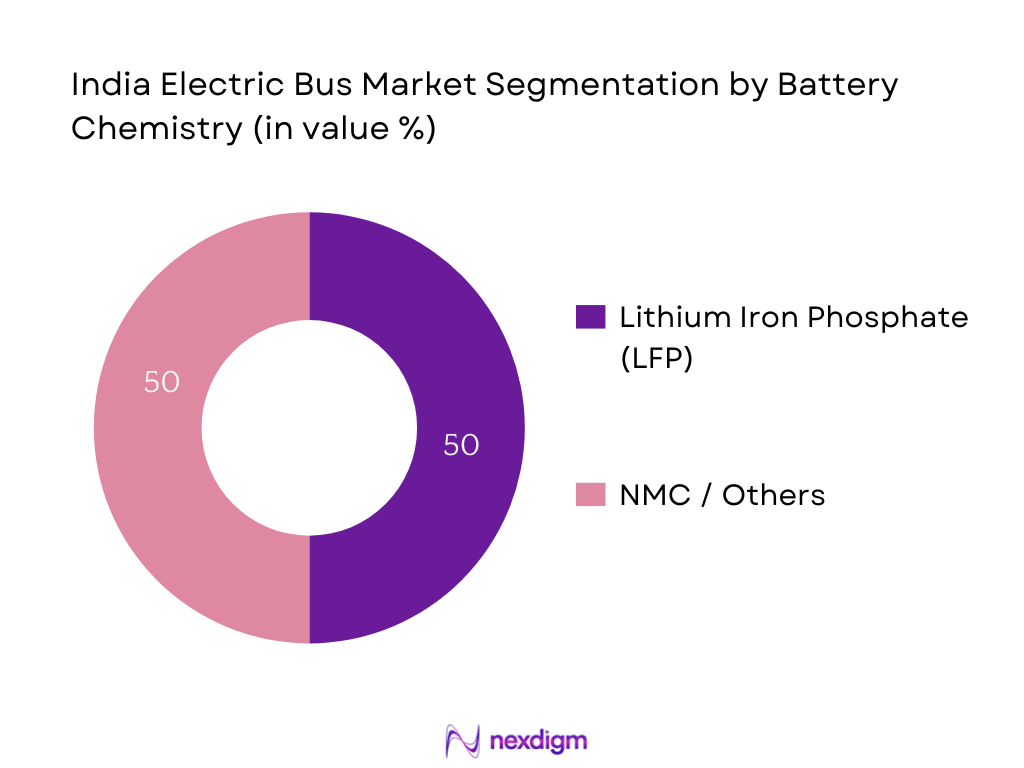
By Battery Chemistry
LFP batteries lead the India Electric Bus market, commanding over 50 % share. Their dominance arises from cost‑effectiveness, enhanced safety, better thermal stability, and quicker charging — critical factors for commercial service operators. The cost‑sensitive nature of public transit procurement further amplifies preference for LFP over more expensive chemistries such as NMC.
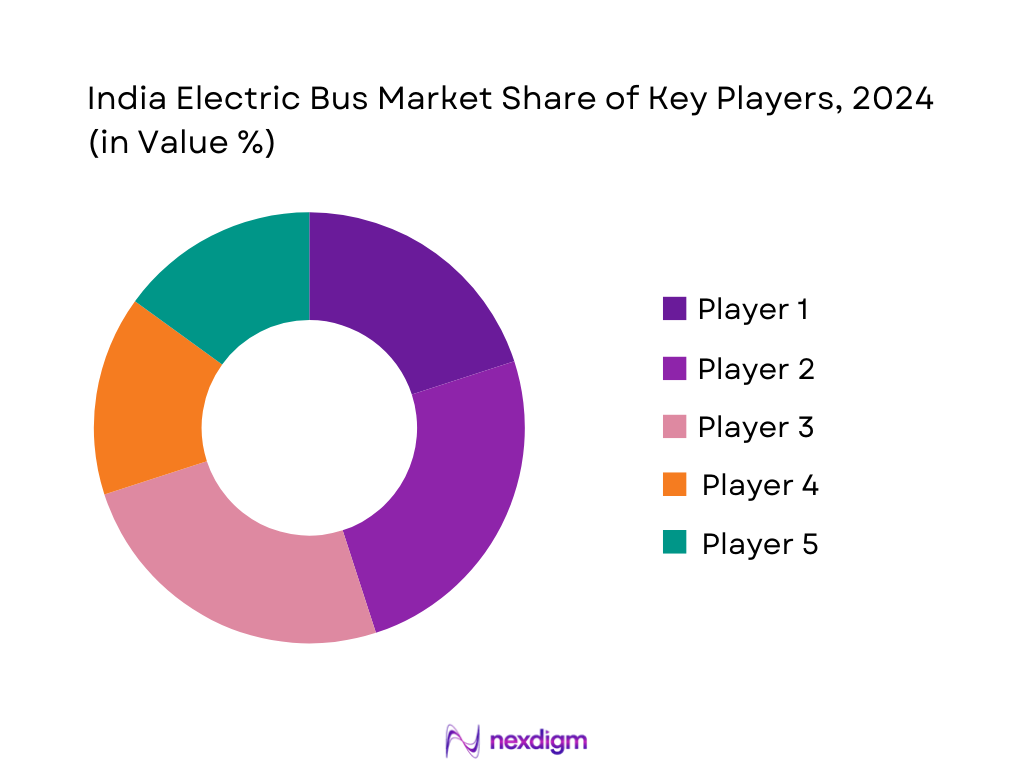
Competitive Landscape
The India electric bus market shows increasing consolidation, but key players are shaping the competitive spectrum. The Indian electric bus market is increasingly consolidated, with key domestic OEMs like Tata Motors, Olectra Greentech, and Ashok Leyland (Switch Mobility) leading deployments. Their dominance stems from winning large public tenders, integrating charging infrastructure solutions, and aligning with Make in India objectives. This competitive framework underscores their robust influence across fleet electrification trends.
| Company | Establishment Year | Headquarters | Bus Platform & Typology | Battery Chemistry | Charging Infra Integration | Government Tender Wins | Export Footprint |
| Tata Motors | 1945 | Mumbai, India | – | – | – | – | – |
| Olectra Greentech | 1996 | Hyderabad, India | – | – | – | – | – |
| Ashok Leyland (Switch) | 1948 | Chennai, India | – | – | – | – | – |
| JBM Auto | 1990s | Noida, India | – | – | – | – | – |
| PMI Electro Mobility | 1980s | Pune, India | – | – | – | – | – |
India Electric Bus Market Analysis
Growth Drivers
Central Government Push via FAME‑II and PM‑eBus Sewa
The central government’s electrification push is set against a backdrop of rising electricity generation, which grew to 1,176 billion units (BU) during 2023‑24, up from 1,092 BU in the previous year—a rise of 84 BU—indicating enhanced energy availability that supports large-scale bus charging infrastructure deployment. Peak power demand surged to 243,271 MW from 215,888 MW, while energy shortages dropped to just 0.3 % (2,980 MU), down from 0.6 % (5,705 MU) in the prior year. These improvements stem from substantial capacity additions, including 8,269 MW of non‑fossil fuel generation, making schemes like FAME‑II and PM‑eBus Sewa viable and energizing electric bus adoption across states.
Urban Public Transport Electrification Targets
Urban areas benefit from rising per‑capita electricity consumption—1,395 kWh in 2023‑24 versus 957 kWh in 2013‑14—a 45.8 % increase, enabling greater power throughput for e‑bus fleets. With national electrification nearly universal and rural power availability rising from roughly 12 hours to 20.6 hours, and urban from ~12 hours to 23.8 hours, cities now operate with far more reliable electricity, underpinning continuous bus operations.
Market Challenges
Grid Load & Charging Infrastructure Readiness
India’s electricity generation in 2023–24 reached 1,176 billion units (BU), up from 1,092 BU a year earlier. Despite this growth, the distribution grid struggles to support the additional load from electric bus charging, especially during peak demand in urban centers. The National Smart Grid Mission highlights that unmanaged EV charging could destabilize grids with periodic overloads. The rapid change from just 1,800 public charging points in February 2022 to 16,347 by March 2024, and further to 29,277 by May 2025, underscores infrastructure lag; many DISCOMs lack capacity planning or smart tariffs like Time-of-Day to manage surge charging. These gaps constrain scalable charging readiness for e-bus fleets.
High Initial Procurement Cost & Financing Mismatch
In executing large-scale electric bus projects, a key challenge is the financing structure. Many e-bus concessions span up to 12 years, while typical financing covers seven years, leading to mismatches that strain cash flows and increase working capital needs. Compounding this, public transport agencies often delay payments, disrupting operators’ ability to service debt. Without mechanisms such as revenue guarantees or secured payment frameworks, private players face higher financing risk and reluctance, hindering fleet rollouts.
Market Opportunities
PM‑eBus Sewa Allocation to Tier‑2 Cities
With per‑capita electricity up by 45.8 % and rural households experiencing power availability of 20.6 hours, the power system is now robust enough to support electrification beyond metros. Solar capacity surged with 23.83 GW added in 2024‑25 alone, contributing to 370.65 BU renewable generation. These energy supply improvements make deployment of e‑buses feasible in tier‑2 cities under PM‑eBus Sewa, aided by improving rural and small‑city grid strength.
Emerging Hydrogen‑FCEB Pilots
While hydrogen fuel‑cell vehicles remain nascent, India’s power sector reliability has improved substantially: energy shortages shrank to 0.3 %, peak demand is met effectively, and electricity generation reached 1,176 BU. These advancements, combined with battery cost evolution and improving grid stability, create groundwork for exploring hydrogen infrastructure pilots, potentially opening new avenues for electric bus technologies beyond battery systems.
Future Outlook
Over the coming years, the India Electric Bus Market is poised for exceptional growth. Continued government backing through subsidy schemes, evolving battery technologies, and rising urban pollution concerns will accelerate adoption. Public transport electrification strategies, paired with expanding depot infrastructure and renewed manufacturing thrusts, will underpin sustained expansion. Deployment of electric buses via GCC tendering, prioritization of LFP battery platforms, and scaling demand from Tier‑2/3 cities will drive future market dynamics. Hybrid and hydrogen‑fuel cell segments may emerge gradually, but BEV with LFP will remain core.
Major Players
- Tata Motors
- Olectra Greentech
- Ashok Leyland (Switch Mobility)
- JBM Auto
- PMI Electro Mobility
- Mytrah Mobility
- EKA Mobility (Pinnacle Industries)
- VE Commercial Vehicles (Eicher)
- GreenCell Mobility
- Goldstone Infratech
- Solaris Bus & Coach (JV operators)
- Foton PMI
- JBM-Solaris JV
- BYD India
- Volvo E‑Bus (India)
Key Target Audience
- State Transport Undertakings (e.g. DTC, BEST, BMTC)
- Urban Local Bodies / Municipal Corporations
- Investments and Venture Capitalist Firms
- Government and Regulatory Bodies (e.g. Ministry of Heavy Industries, Ministry of Housing & Urban Affairs)
- Public-Private Partnership (PPP) Project Developers
- Component & Charging Infrastructure Manufacturers
- OEM Strategic Planners & Fleet Procurement Heads
- Mass Transit Financing Agencies & Banks
Research Methodology
Step 1: Identification of Key Variables
We mapped the India Electric Bus ecosystem—covering OEMs, STUs, battery suppliers, charging infra players, and policymakers—using secondary sources and databases to define pivotal variables such as vehicle type, procurement channel, and battery technology.
Step 2: Market Analysis and Construction
Historical data, including market revenues and volumes for 2023–2024, were compiled and triangulated across sources. We evaluated reliability via cross-comparison and quality metrics.
Step 3: Hypothesis Validation and Expert Consultation
We held CATI interviews with industry experts: OEM product leads, STU fleet managers, and state transport officials, validating trends, operational bottlenecks, and demand drivers — ensuring grounded analysis.
Step 4: Research Synthesis and Final Output
The final report integrates bottom‑up deployment data from OEMs and public procurement records, aligning with secondary forecasts to deliver a validated and comprehensive market perspective.
- Executive Summary
- Research Methodology (Market Definitions and Assumptions, Abbreviations, Market Sizing Approach, Consolidated Research Approach, Primary Research Methodology, Limitations and Future Projections)
- Definition and Scope
- Market Genesis and Evolution
- Timeline of Major Policy Interventions (FAME-I, FAME-II, PM-eBus Sewa, State EV Policies)
- Lifecycle and Business Model Overview (CAPEX, OPEX, GCC Models)
- Electric Bus Value Chain Analysis (Component Manufacturing, Assembly, Charging Infra, Aftersales)

- Growth Drivers
Central Government Push via FAME-II and PM-eBus Sewa
Urban Public Transport Electrification Targets
Battery Cost Decline and Indigenous Production
Increasing Environmental & Emissions Regulation
STU Demand for Cost-Efficient Operations - Market Challenges
Grid Load & Charging Infrastructure Readiness
High Initial Procurement Cost
Limited Domestic Battery Manufacturing Ecosystem
Spare Parts and Maintenance Gaps
Technical Skill Shortage in STUs - Market Opportunities
PM-eBus Sewa Allocation to Tier-2 Cities
Emerging Hydrogen-FCEB Pilots
Investment in Battery Recycling & Second-life Use
Telematics, ADAS & IoT Integration in E-Buses - Market Trends
Shift Toward Battery Swapping & Smart Charging
Rise of Double-Decker and Intercity E-Buses
GCC/OPEX Model Dominance in State Bids - Government Regulations
CMVR Guidelines for Electric Buses
Bharat Charging Standards (AC001, DC001, CCS-2)
State-wise EV Policies and Bus Subsidy Slabs - SWOT Analysis
- Stakeholder Ecosystem (OEMs, STUs, PSU Banks, Infra Providers, Charging Tech Players)
- Porter’s Five Forces
- By Value, 2019-2024
- By Volume, 2019-2024
- By Average Bus Price, 2019-2024
- By Number of Electric Buses Deployed under Public Schemes, 2019-2024
- By Battery Installed Capacity (MWh), 2019-2024
- By Bus Type (In Value %)
Standard Electric Bus (9–12m)
Mini Electric Bus (6–9m)
Articulated Electric Bus (>12m)
Double-Decker Electric Bus - By Battery Technology (In Value %)
Lithium Iron Phosphate (LFP)
Nickel Manganese Cobalt (NMC)
Solid-State Battery
Hydrogen Fuel Cell - By Charging Infrastructure (In Value %)
Depot Charging
Opportunity Charging (Pantograph)
Battery Swapping - By Power Output (In Value %)
Up to 150 kW
151–250 kW
Above 250 kW - By Region (In Value %)
North India
South India
West India
East India
Central India - By Ownership Model (In Value %)
Government-Owned (STUs)
Private Fleet Operators (PPP)
OEM/Aggregator-Operated Fleets
- Market Share by Volume and Value (Latest Tender Deployments)
Market Share by Bus Type
Market Share by Ownership Model - Cross Comparison Parameters (Company Overview, Tender Performance, Bus Platform & Specs, Battery Chemistry, Range/km, Plant Capacity, Strategic Partnerships, R&D Investment, Software/Telematics Capabilities, Charging Infra Integration, Per km OPEX, Aftermarket Network)
- SWOT Analysis of Major Players
- Per-Kilometer Pricing Analysis under OPEX/GCC Models
- Detailed Company Profiles
Tata Motors
Olectra Greentech
Ashok Leyland (Switch Mobility)
JBM Auto
PMI Electro Mobility
Mytrah Mobility
EKA Mobility
Goldstone Infratech
VE Commercial Vehicles (Eicher)
GreenCell Mobility
Foton PMI
BYD India
JBM-Solaris JV
Volvo E-Bus (India Division)
Causis E-Mobility
- Buyer Procurement Models & Contract Structures
- Funding Sources & Credit Risk Assessment
- Use-case Breakdown: Intra-city, Inter-city, Airport, School Bus
- STU Electrification Targets and Fleet Roadmaps
- Technology Expectations and Pain Points
- By Value, 2025-2030
- By Volume, 2025-2030
- By Average Bus Price, 2025-2030
- By Number of Electric Buses Deployed under Public Schemes, 2025-2030
- By Battery Installed Capacity (MWh), 2025-2030


 Request a Sample
 Ask for Customization
 Get a Quote
 Enquire Now