
 Download PDF
 Download PDF
Market Overview
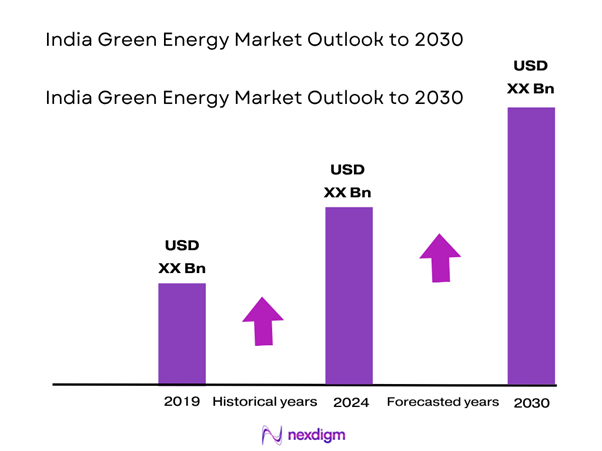
The India green energy market is currently valued at approximately USD 24 billion, reflecting a convergence around USD 24 billion for 2024. This valuation is fueled by strong government policy support, cost reductions in solar PV modules and wind turbine technology, and aggressive targets under initiatives like PM KUSUM and tender programmes via SECI and MNRE. These frameworks have accelerated capacity additions, making green energy financially competitive with fossil fuels.
Major urban-industrial hubs such as Delhi–NCR, Mumbai, Bengaluru, Pune, and Ahmedabad–Gujarat dominate demand, driven by high energy consumption, regulatory push for Renewable Purchase Obligations (RPOs), and robust infrastructure readiness. Gujarat and Maharashtra, among others, benefit from abundant solar and wind resources, enterprise-led manufacturing zones, favorable land availability, and proactive state policies. International integration (e.g., solar parks) and investment-friendly zones further elevate their leadership.
Market Segmentation
By Energy Source
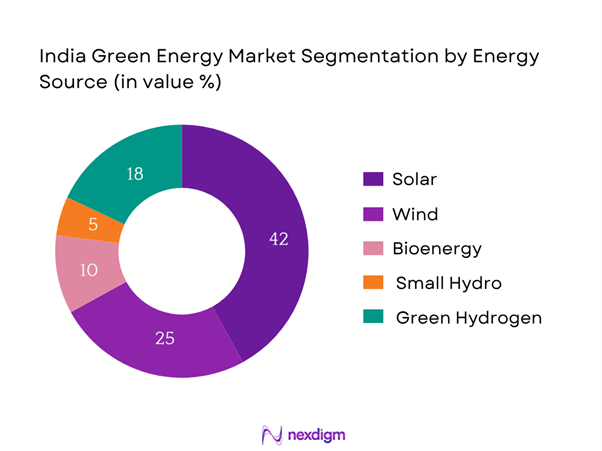
India’s green energy market is segmented into Solar, Wind, Bioenergy, Small Hydro, and Green Hydrogen. Solar dominates with a ~42.4% share, thanks to falling solar PV costs, abundant sunshine, and strong support via rooftop subsidies and national auctions like PM Surya Ghar. Wind follows, with ~25% due to competitive wind corridors in western and southern India, and policy push through hybrid wind–solar programmes. Bioenergy and small hydro hold niche positions, while green hydrogen is emerging rapidly under new mission support. These dynamics ensure solar and wind continue to lead share in value and capacity.
By End-Use Application
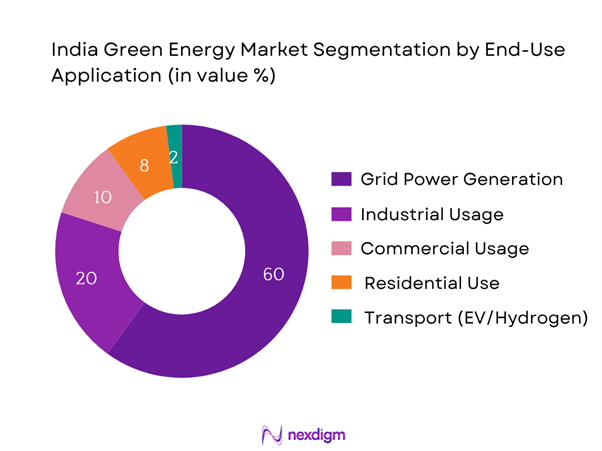
The India green energy market is segmented into Grid Power, Industrial, Commercial, Residential, and EV/Transport use. Grid Power accounts for ~60%, led by large utility-scale auctions and DISCOM PPP frameworks. Industrial consumers (~20%) adopt captive solar and open-access PPAs to meet internal RPOs. Commercial (~10%) includes retail and IT sectors investing in rooftop solutions for sustainability targets. Residential (~8%) is smaller but rising via subsidy schemes. Transport (~2%) is emergent, with policy-driven momentum for EV charging and green hydrogen mobility. The dominance of grid and industrial usage stems from scale, regulatory compliance, and cost efficiency.
Competitive Landscape
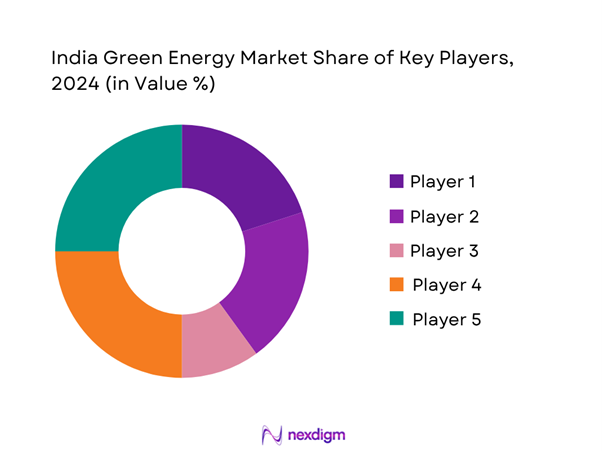
The competitive landscape is concentrated among a few major players with strong portfolios and influence. Adani Green Energy leads with multi-GW solar, wind, and hybrid pipelines, backed by tariff competitiveness and integrated manufacturing capabilities. ReNew Power and Tata Power RE follow, leveraging scale in projects and early adoption of storage integration. Greenko has carved a niche in hybrid + storage builds. Azure, with a focused solar footprint, excels in rooftop and hybrid implementation. Their dominance reflects scale economies, technology maturity, EPC strength, and ability to secure favorable PPAs.
| Company | Founded | HQ | Installed Capacity (GW) | Technology Portfolio | PPA Contracts (GW) | Storage Projects | Manufacturing Presence | R&D/Innovation | Financial Leverage |
| Adani Green Energy | 2015 | Ahmedabad, Gujarat | – | – | – | – | – | – | – |
| ReNew Power | 2011 | Gurugram, Haryana | – | – | – | – | – | – | – |
| Tata Power RE | 2011 | Mumbai, Maharashtra | – | – | – | – | – | – | – |
| Greenko Energy | 2015 | Hyderabad, Telangana | – | – | – | – | – | – | – |
| Azure Power | 2008 | Gurugram, Haryana | – | – | – | – | – | – | – |
India Green Energy Market Analysis
Growth Drivers
Policy Incentives
The World Bank approved USD 1.5 billion in June 2024 to scale India’s low‑carbon energy programmes, including green hydrogen and renewable energy tenders. Also, India received USD 3.76 billion in foreign investment during FY 2023–24 for solar projects, facilitated by 100% FDI policy and Production Linked Incentives (PLI). The MNRE’s flagship rooftop subsidy launched with an allocation of ₹75,021 crore is expected to cover 10 million households. These sustained flows of public and private capital underscore strong policy traction and investor certainty, amplifying green energy market uptake.
Cost Declines in Generation & Equipment
A record 30 GW of clean energy was added between April 2024 and April 2025, reflecting rapid cost efficiencies. Solar power is now “half the cost” of new coal plants, on account of cheap components and high irradiation. India also achieved 110.83 GW of solar capacity by May 2025 via 70 designated solar parks—evidence of scalable deployment. Furthermore, onshore wind capacity hit 50 GW by March 2025, spread across cost‑competitive sites in Gujarat and Tamil Nadu. These lower generation costs are unlocking higher investment volumes and accelerating large-scale rollouts.
Market Challenges
Land Acquisition
Large-scale renewable projects are facing significant land acquisition roadblocks, especially in densely populated agricultural states. For example, protests over land rights delayed Tata Power’s 100 MW solar plant near Nandgaon, Maharashtra. India’s solar parks—like the Bhadla Solar Park spanning 56 km²—must negotiate leases or compensation for thousands of smallholder plots, creating delays and cost overruns. With non-fossil capacity planning to double to 500 GW, land availability in states like Rajasthan, Gujarat, and Tamil Nadu presents a major bottleneck, triggering regulatory interventions and community engagement efforts such as agrivoltaics.
DISCOM Debt
India’s distribution companies (“DISCOMs”) continue to be burdened by cumulative losses of approximately ₹677,000 crore (€74.4 billion) as of 2022–23. Despite financial restructuring under UDAY, high debt levels limit their ability to procure renewable energy through PPAs, bottlenecking project viability and timely payments. DISCOMs’ weak credit ratings raise borrowing costs and deter private developers, delaying capacity additions. Government-led bailouts have only partially resolved the debt issue, underscoring the need for structural reforms and tariff rationalization to unlock sustainable grid integration of renewables.
Opportunities
Green Hydrogen
India has begun mobilizing large-scale international financing to develop a green hydrogen ecosystem. In June 2024, the World Bank approved USD 1.5 billion to scale domestic electrolyser manufacturing and institutionalize green hydrogen tenders. India’s National Green Hydrogen Mission—dovetailed into these programmes—targets production capacity of up to 450,000 tonnes per annum of green hydrogen by doubling electrolyser installations to 1.5 GW yearly. These investments position India to decarbonize hard-to-abate sectors like steel and fertilizer, where ~6 million tonnes of grey hydrogen is consumed annually. This infrastructure is also expected to stimulate PPPs and private capital flows via blended finance schemes.
Solar Manufacturing
Domestic solar equipment manufacturing is gaining momentum, supported by Production Linked Incentive (PLI) schemes and revolving funding via IREDA. NIIF’s Master Fund—managing USD 4.9 billion AUM as of April 2024—has invested in PV and renewable capacity platforms. Recent investments have been channelled into establishing wafering lines, module assemblers, and cell plants in Gujarat and Rajasthan. With global solar demand surging, local production helps India meet domestic demand (over 30 GW installations in FY2023) and reduces dependence on imports, seizing export opportunities while benefiting from economies of scale and tax-incentivized manufacturing zones.
Future Outlook
Over the 2024–2030 period, the India green energy market is expected to grow steadily at an average CAGR of approximately 9%, reaching approximately USD 37 billion by 2030. Rapid tariff declines in solar and wind, aggressive capacity targets (500 GW mix), strong policy frameworks (PLI, storage tenders, green hydrogen mission), and infrastructure upgrades (interstate transmission, green corridor) will serve as key drivers. Hybrid + storage solutions are expected to mitigate intermittency, appealing to DISCOMs and end-users. Emerging segments like EV charging hubs and green hydrogen will carve niche opportunities, especially aligned with decarbonization strategies and industrial demand. Continued investment (~USD 385 b over 6–7 years via Moody’s) will fuel growth, albeit requiring resolution of land, financing, and grid integration challenges.
Major Players
- Adani Green Energy
- ReNew Power
- Tata Power Renewable Energy
- Greenko Energy
- Azure Power
- NTPC Renewable Energy Ltd.
- JSW Energy
- Sembcorp Green Infra
- Hero Future Energies
- Ayana Renewable Power
- Avaada Energy
- O2 Power
- Amp Energy India
- Continuum Green Energy
- ACME Solar Holdings
Key Target Audience
- Infrastructure & Power Utilities
- Energy-Intensive Industries (Steel, Cement, Manufacturing)
- Renewable Project Developers & IPPs
- Investments and Venture Capitalist Firms
- Equipment Manufacturers (Solar Modules, Wind Turbines, Electrolyzers)
- EV Mobility and Charging Infrastructure Providers
- Government and Regulatory Bodies (MNRE, CEA, SECI)
- Financial Institutions & Project Financiers
Research Methodology
Step 1: Secondary Research and Ecosystem Mapping
We began with a comprehensive ecosystem scan of government databases (MNRE, CEA), industry portals, reports, and news sources. This phase established core market variables—capacity, tariffs, policy frameworks, and competitive landscape.
Step 2: Historical Data Analysis & Quantification
We aggregated historical data (2019–2023) on installed capacity, generation output, tariff trends, and investment flows. This quantitative baseline enabled constructing a robust bottom-up revenue model and validating CAGR using regression techniques.
Step 3: Primary Expert Consultations
Structured interviews (CATIs) and C-level workshops were conducted with industry stakeholders—developers, DISCOM executives, OEMs, and ministry officials—to capture real-time insights on project pipelines, cost structures, financing, and execution risks.
Step 4: Forecast Modeling & Validation
Scenario modeling was used to project capacity, tariff trajectories, and market value through 2030. Forecasts were stress-tested across policy, demand, and cost-change scenarios. Final results were refined through iterative feedback loops from expert panels and cross-checked for alignment with global benchmarks.
- Executive Summary
- Research Methodology
(Market Definitions and Assumptions, Abbreviations, Market Sizing Approach, Consolidated Research Approach, In-depth Stakeholder Interviews, Government and Institutional Data Sources, Primary & Secondary Research Integration, Limitations)
- Definition and Scope
- Sector Genesis and Evolution
- Policy & Regulatory Landscape Timeline (MNRE, MoP, SECI)
- National Renewable Energy Mission Alignment
- Power Purchase Mechanism and DISCOM Integration
- Transmission & Grid Infrastructure Assessment
- Green Energy Certificates (RECs) & Trading Mechanisms

- Growth Drivers
Policy Incentives
Cost Declines
Global Climate Commitments - Market Challenges
Land Acquisition
DISCOM Debt
Storage Constraints - Key Opportunities
Green Hydrogen
Solar Manufacturing
Carbon Markets - Emerging Trends
Hybrid Projects
Floating Solar
Energy-as-a-Service - Government Regulation
ALMM
RPO targets
Viability Gap Funding
PLI - SWOT Analysis
- Stakeholder Ecosystem
- Porter’s Five Forces Analysis
- By Installed Capacity (MW), 2019-2024
- By Generation Output (TWh), 2019-2024
- By Value (INR Crore), 2019-2024
- By Carbon Offset Contribution (Million Tonnes CO₂), 2019-2024
- By Energy Source (In Value %)
Solar
– Rooftop Solar
– Utility-scale Solar
Wind
– Onshore Wind
– Offshore Wind
Bioenergy
– Biogas
– Biomass
– Waste-to-Energy
Small Hydro Power (<25 MW)
– Mini Hydro (2–25 MW)
– Micro Hydro (<2 MW)
– Pico Hydro (<100 kW)
Green Hydrogen
– Electrolyzer-based Green Hydrogen
– Green Ammonia
– Hydrogen Fuel for Mobility - By Application (In Value %)
Power Generation
– Grid-connected Utility Projects
– Distributed Generation (C&I Rooftop, Village Electrification)
Industrial Usage
– Process Heating and Steam
– Green Hydrogen for Fertilizer, Refining, Steel
– Energy Substitution in Cement, Textiles, and Food Industries
Commercial Usage
– Solar Rooftop for Malls, Offices, IT Parks
– Solar + Battery for Hospitality and Retail Chains
Residential Use
– Rooftop Solar (Net Metering, Gross Metering)
– Community Solar Projects
– Solar Water Heaters, Home Biogas
Transportation
– EV Charging
– Hydrogen Mobility - By Region (In Value %)
Northern India
Western India
Southern India
Eastern India
North-East India - By Ownership Model (In Value %)
Central Government
– SECI-led Auctions (ISTS Projects)
– NTPC Renewable Energy Projects
– Central Public Sector Undertakings (CPSUs)
State Government
– DISCOM-integrated Solar Programs
– State-Level Solar Parks and Rooftop Schemes
Private Sector IPPs
– Independent Power Producers like ReNew, Adani Green, Tata Power
– Open Access and Captive Projects
PPP Projects
– Solar Parks under Viability Gap Funding
– Hybrid and Floating Solar Plants on Canals, Reservoirs
Community Cooperatives
– Farmer-led Solar Pump Schemes (PM-KUSUM)
– Rural Renewable Energy Cooperatives and Trusts - By End User Type (In Value %)
Grid-connected
– Utility-scale Solar/Wind
– Net Metered Rooftop Solar Systems
Off-grid / Microgrid
– Solar Mini-grids for Remote Villages
– Biomass and Pico Hydro for Tribal and Hilly Areas
Captive Consumption
– Rooftop and Ground-Mounted Solar for Industries
– Wind + Storage Hybrid Projects for High-Load Industries
Third Party Sales
– Group Captive and Virtual Net Metering Models
– DISCOM Bypass under Open Access
Open Access Consumers
– C&I Consumers Buying Green Power Across States
– Green Open Access Rules (2022) Beneficiaries
- Market Share of Major Players (Installed Capacity, Revenue, Projects)
- Cross Comparison Parameters (Company Overview, Tech Differentiators, RE Portfolio Composition, Tariff Positioning, PPAs Signed, Storage Integration, Local Manufacturing Units, Grid Feed-in, Innovation Capabilities)
- SWOT Analysis of Major Players
- Project-level Tariff Analysis (Solar, Wind, Hybrid, RE+Storage)
- Detailed Profiles of Major Companies
ReNew Power
Adani Green Energy
Tata Power Renewable Energy
Greenko Energy
NTPC Renewable Energy Ltd.
Azure Power
JSW Energy
Sembcorp Green Infra
Hero Future Energies
Ayana Renewable Power
Avaada Energy
O2 Power
Amp Energy India
Continuum Green Energy
ACME Solar Holdings
- User Profiles and Energy Demand Mix
- Regulatory Compliance Mapping
- Financing Preferences
- Key Barriers and Enablers
- Procurement Channels
- By Installed Capacity (MW), 2025-2030
- By Value (INR Crore), 2025-2030
- By Energy Generation (TWh), 2025-2030
- By Contribution to National Grid (%), 2025-2030


 Request a Sample
 Ask for Customization
 Get a Quote
 Enquire Now