
 Download PDF
 Download PDF
Market Overview
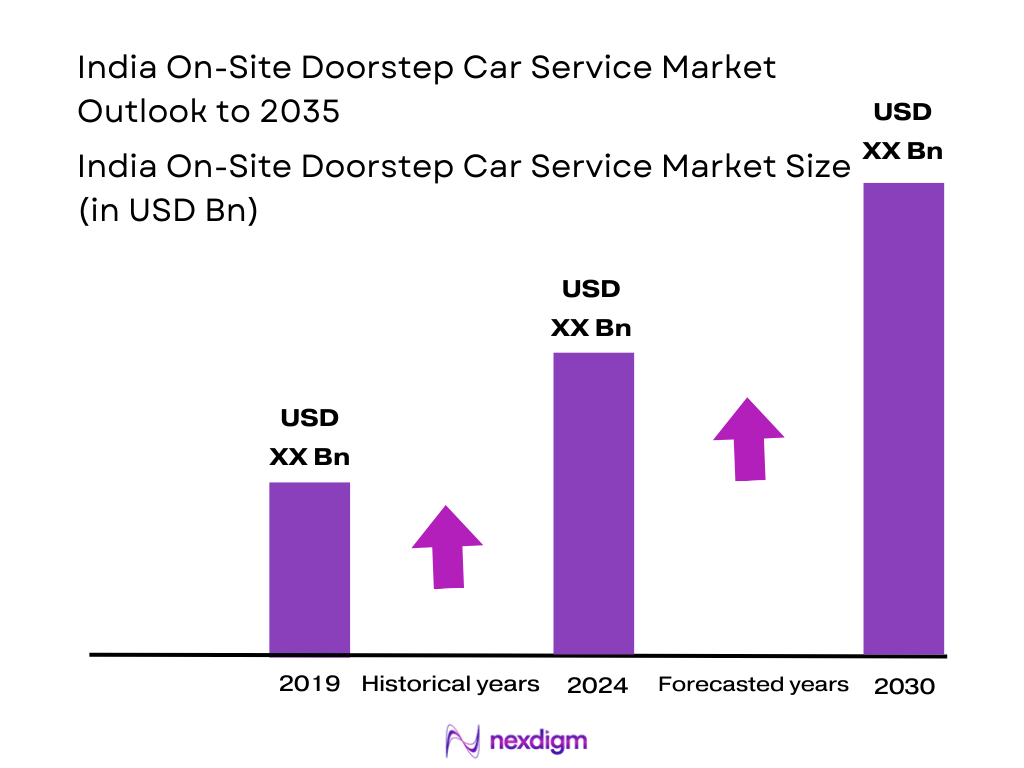
The closest “service-spend” proxy for doorstep execution is the broader India automotive service market, which Nexdigm sizes at USD ~ billion as of 2024 and flags mobile/on-site service units as an emerging delivery format alongside workshop-led servicing. On the demand-side, India’s passenger vehicle volumes are also expanding—industry sources cite about 5.1 million units in one recent year, and 5,156,483 units in the next—expanding the addressable installed base for routine maintenance, minor repair, and at-home convenience add-ons (wash, detailing, batteries, tyres).
Doorstep service demand is concentrated in dense, time-poor metro clusters (Delhi NCR, Mumbai MMR, Bengaluru, Hyderabad, Chennai, Pune) because on-site execution reduces travel/queue time and solves workshop access constraints (parking scarcity, weekday traffic, appointment friction). These cities also have the deepest supply pool of technicians, aggregator micro-franchises, and multi-brand networks, plus higher digital booking propensity. The same metros anchor OEM and multi-brand service ecosystems (service centers, partner garages, parts distribution), allowing doorstep players to blend at-home services + hub-and-spoke workshop support for jobs requiring lifts or heavy diagnostics.
Market Segmentation
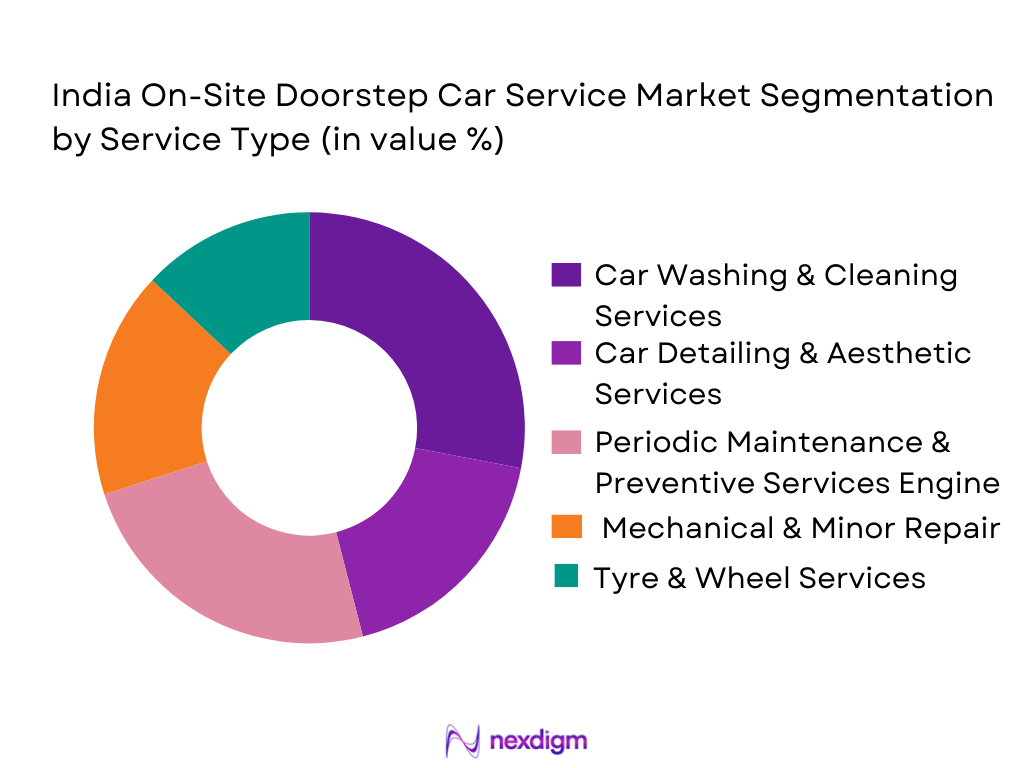
By Service Type
Recently, car washing & cleaning tends to lead the doorstep mix because it is the lowest time-to-deliver, requires minimal tooling, and fits apartment/office parking execution. It is also the most “repeatable” use-case (monthly/bi-weekly) versus sporadic mechanical events. The dominance is reinforced by the spread of waterless / low-water methods (usable in housing societies with water restrictions) and bundled interior hygiene services. As the vehicle parc expands (passenger vehicle volumes rising year-on-year), the repeat-cycle nature of cleaning converts better in app/WhatsApp bookings than workshop-heavy repairs.
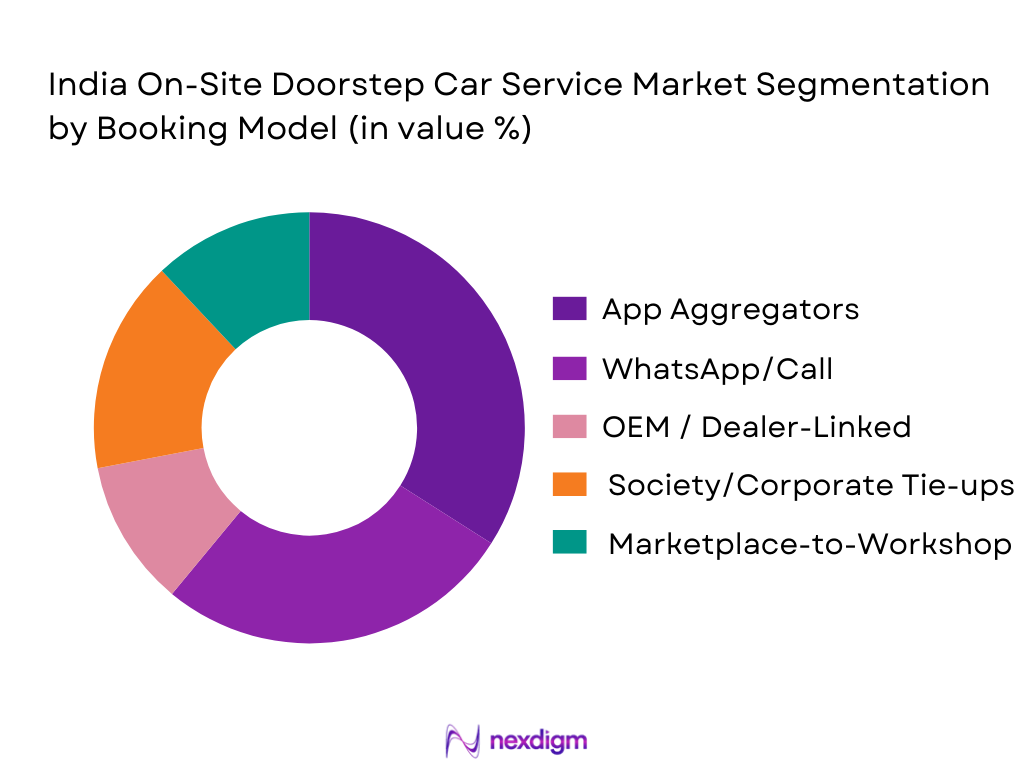
By Booking & Fulfilment Model
App/web aggregators generally lead because they reduce discovery friction, enable slotting + service menus, and integrate add-ons (cleaning → detailing → minor repair). However, WhatsApp/call-first local networks remain structurally strong due to trust, repeat behaviour, and cash/UPI convenience—especially when the same technician returns to the same apartment complex. OEM-linked home service is smaller because many jobs still require workshop infrastructure, but it is important for warranty-safe light services (battery, minor checks).
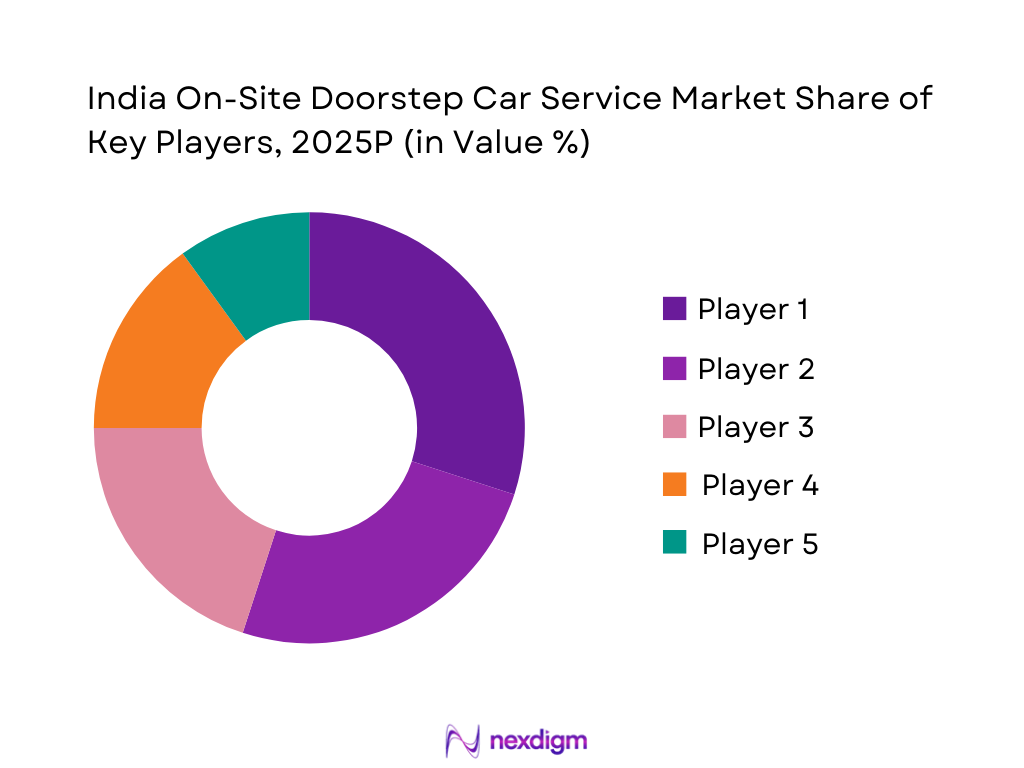
Competitive Landscape
The India on-site doorstep car service space is fragmented: large consumer brands coexist with city-level micro-franchises, multi-brand networks, detailing specialists, and OEM-authorized ecosystems. Scale advantages come from technician supply density, standardized SOPs, partner-garage coverage, and repeat-cycle services (cleaning/maintenance bundles). Multi-brand servicing ecosystems are also expanding as out-of-warranty vehicles increase, supporting organised alternatives beyond dealerships.
| Company | Est. Year | HQ | Coverage Footprint | Core Doorstep Services | Fulfilment Model | Tech Stack | QA & Warranty Posture | Partner Garage Network |
| GoMechanic | 2016 | India | ~ | ~ | ~ | ~ | ~ | ~ |
| MyTVS | 2000 | India | ~ | ~ | ~ | ~ | ~ | ~ |
| Bosch Car Service | 1921 | Global | ~ | ~ | ~ | ~ | ~ | ~ |
| 3M Car Care | 1902 | Global | ~ | ~ | ~ | ~ | ~ | ~ |
| Cars24 Car Service / Partner Ecosystem* | 2015 | India | ~ | ~ | ~ | ~ | ~ | ~ |
India On-Site Doorstep Car Service Market Dynamics
Growth Drivers
Vehicle parc growth linkage
India’s doorstep car-service demand scales directly with the expanding addressable vehicle parc that requires periodic washing, minor repairs, and preventive maintenance between workshop visits. Total registered motor vehicles reached 354,000,000, up from 335,600,000 earlier, materially expanding the pool of routine “service events” that mobile teams can address without investing in fixed workshop infrastructure. This expansion is reinforced by macroeconomic strength, with India’s total economic output rising to USD 3,909,891,533,858.08 from USD 3,638,489,096,033.86, supporting sustained vehicle usage and maintenance intensity. Population scale further amplifies this effect, with 1,450,935,791 people nationally and an urban population of 513,325,080, creating dense, repeatable catchments where technicians can cluster jobs and improve daily productivity. Connectivity fundamentals strengthen execution feasibility: 1,165.49 million wireless telephone subscribers and 913.34 million wireless data subscribers enable app-based booking, live tracking, digital job cards, and cashless payments. Collectively, these figures show that market expansion is driven by a mathematically growing, increasingly connected vehicle base rather than short-term promotional activity, allowing doorstep service models to scale efficiently in dense urban corridors where time savings outweigh workshop visits.
Convenience elasticity
Doorstep car service adoption accelerates where consumers can convert time and coordination friction into predictable, one-click service delivery, making convenience elasticity dependent on digital rails, urban density, and payment depth. India’s digital payments ecosystem has reached everyday utility scale, recording 23,834 crore total digital payment transactions over a full-year period, demonstrating how routine QR- and UPI-based payments have become for daily services. This payment readiness supports subscription renewals, add-on upsells, and instant post-service settlements. Parallel connectivity depth underpins service orchestration, with 913.34 million wireless data subscribers and 1,165.49 million total wireless telephone subscribers forming the addressable base for app-first scheduling, WhatsApp coordination, and digital quality assurance. Urbanization further improves operational economics: an urban population of 513,325,080 increases the likelihood that a single service van can execute multiple jobs—such as washing, interior cleaning, battery replacement, and minor repairs—within a tight radius, minimizing travel downtime. Macro spending capacity reinforces elasticity, with total economic output at USD 3,909,891,533,858.08, expanding the number of households and SMEs willing to pay for time-saving services even for standard maintenance tasks. As a result, convenience has shifted from a niche premium to a mainstream expectation in major Indian cities, enabling doorstep servicing to mirror digital adoption patterns seen in groceries, mobility, and home services.
Market Challenges
Trust deficit
Trust represents the largest conversion friction in the India on-site doorstep car service market because service execution occurs outside traditional workshops, heightening customer concerns around process quality, parts authenticity, and payment safety. India’s digital scale, while enabling growth, also magnifies sensitivity to negative experiences. Reported high-value cyber fraud cases rose to 29,082 compared with 6,699 earlier, increasing consumer caution toward app-based and prepaid services. This sensitivity is amplified by the sheer scale of digital payments, with 16,443.02 crore transactions recorded in one recent period and 18,120.82 crore transactions logged up to January in the subsequent cycle. At this scale, even a small absolute number of poor service outcomes can translate into widespread reputational impact through reviews and social sharing. Consumer grievance visibility also contributes to perceived risk, as centralized complaint-resolution mechanisms make disputes more searchable and transparent. Operationally, providers must counter this deficit with verifiable job cards, time-stamped before-and-after imagery, digital invoices, standardized consumables, and explicit warranties. With 354,000,000 registered vehicles in circulation, even marginal failure rates can generate large absolute complaint volumes in dense urban markets, making trust architecture a structural necessity rather than a marketing differentiator.
On-site job limitations
Not all automotive services are suited for mobile execution in India due to constraints related to safety compliance, waste handling, tooling requirements, and spatial limitations in dense housing environments. Environmental compliance has become a binding factor, with formalized frameworks for used oil and hazardous waste increasing auditability expectations for collection, transport, and recycling during servicing. National hazardous-waste handling volumes are measured in large absolute quantities, with 1.64 million metric tonnes referenced in administrative planning, underscoring that regulators treat automotive waste streams as material compliance categories rather than informal by-products. This regulatory rigor pushes doorstep operators toward controlled processes—such as sealed drain pans and authorized handovers—that are manageable for light jobs but increasingly complex for heavier mechanical interventions generating multiple waste streams. Urban density compounds these constraints: an urban population of 513,325,080 implies widespread shared parking and roadside servicing conditions where lifts, underbody access, wheel alignment rigs, and prolonged bay occupation are impractical. Additionally, modern vehicles embed more electronics, requiring stable power, controlled lighting, and specialized calibration equipment for certain diagnostics and ADAS-related work. These realities naturally cap the on-site attach rate to services like cleaning, basic detailing, consumable replacements, minor mechanical fixes, and selective preventive tasks, defining a structural ceiling shaped by compliance and infrastructure rather than customer willingness alone.
Opportunities
Fleet contracts
Fleet contracts represent a scalable growth avenue because they convert fragmented, one-off retail demand into recurring, route-optimized service volumes concentrated in logistics corridors and urban hubs. India’s freight and trade activity illustrates this opportunity through GST logistics telemetry, where monthly e-way bill generation reached 10,26,57,874 in one month and 9,58,19,103 in the subsequent month, alongside assessed values such as ₹29,77,300 crore in a single reporting period. These figures reflect the intensity of goods movement that depends on commercial vehicle uptime and predictable maintenance cycles. Even outside monthly snapshots, peak-period counts consistently remain in the 100+ million range, reinforcing the need for preventive, in-field servicing to reduce downtime. Fleet operations can centralize approvals and payments efficiently due to the depth of India’s digital payments infrastructure, with 18,120.82 crore digital transactions recorded up to January in one cycle and 23,834 crore transactions over a full-year window. Macro fundamentals further reinforce fleet utilization, supported by total economic output of USD 3,909,891,533,858.08, which underpins goods movement and service demand. Practically, the opportunity lies in productizing fleet SLAs—rapid-response minor repairs, depot-based periodic maintenance, standardized cleaning schedules, and compliance-ready waste handling—integrated with telematics and driver applications to transform high logistics intensity into predictable doorstep service annuities.
Subscription bundles
Subscription bundles—including wash packs, quarterly preventive checks, monsoon-ready services, interior hygiene cycles, and battery or consumables plans—offer a path to deepen market penetration by smoothing demand, improving technician utilization, and stabilizing cash flows. This model is viable because India’s transaction infrastructure operates at national scale. Over a full-year window, digital payment volumes reached 23,834 crore transactions, while another reporting period recorded 16,443.02 crore transactions and 18,120.82 crore transactions up to January, indicating that recurring digital debits and app-based checkouts are mainstream behaviors. High-frequency, low-ticket payments are further supported by large monthly UPI transaction counts across hundreds of participating banks, enabling reliable billing for routine services. Connectivity readiness strengthens execution, with 913.34 million wireless data subscribers and 1,165.49 million total wireless telephone subscribers facilitating automated reminders, technician routing, digital quality checks, and in-app warranty records. The underlying serviceable base remains vast at 354,000,000 registered motor vehicles, meaning even modest absolute conversion into subscriptions yields substantial job volumes without new workshop construction. The opportunity is to design bundles aligned with India-specific seasonality—dust, monsoon, pollution cycles, long urban commutes—and to integrate compliant waste handling and CRM-driven workflows so vehicle ownership maintenance increasingly functions as an automated, utility-like service.
Future Outlook
Over the next planning horizon, doorstep car service in India is expected to grow faster than traditional “walk-in only” formats because consumers are normalizing time-saving services and providers are improving job triage (what can be done at home vs what must go to a hub). A key enabler will be hub-and-spoke operations: doorstep for wash, detailing, basic preventive jobs, plus rapid escalation to partner workshops for lift-dependent repairs. The wider aftermarket context also supports expansion—Nexdigm cites India’s automotive aftermarket at USD 17.5 billion with CAGR 8.4% over the medium term—creating runway for organised service models and packaged maintenance.
Major Players
- GoMechanic
- MyTVS
- Bosch Car Service
- 3M Car Care
- Mahindra First Choice Services
- Castrol Auto Service
- Shell Helix / Shell service ecosystem
- CarzSpa
- Detailing Devils
- Pitstop / City-level doorstep networks
- Cars24 ecosystem tie-ins
- Acko Drive / partner service programs
- Mahindra RSA / OEM-linked mobile service arms
- Maruti Suzuki Mobile Support / doorstep initiatives
Key Target Audience
- Automotive aftermarket investors & venture capital firms
- Insurance companies & claims management teams
- OEMs and authorized dealer groups (service business heads)
- Multi-brand workshop chains and franchise operators
- Mobility & corporate fleet operators (maintenance heads)
- E-commerce & quick logistics fleets (fleet uptime teams)
- Apartment/RWA facility management aggregators
- Government and regulatory bodies (Ministry of Road Transport & Highways (MoRTH), Bureau of Indian Standards (BIS))
Research Methodology
Step 1: Identification of Key Variables
We construct an ecosystem map covering aggregators, technician networks, partner garages, OEM/dealer service arms, detailing studios, parts distributors, and fleet accounts. Desk research is combined with proprietary databases to define variables such as service menu depth, fulfilment radius, technician productivity, and repeat frequency.
Step 2: Market Analysis and Construction
We compile historical operating data across metros: order density by micro-market, share of doorstep-executable jobs, escalation rates to workshops, and service attach rates (wash → detailing → PMS). We also analyse supply-side capacity: technician count, shift utilization, and partner-garage throughput.
Step 3: Hypothesis Validation and Expert Consultation
Hypotheses are validated via CATI/interviews with aggregator ops leaders, franchise owners, RWA facility managers, and fleet maintenance heads. Inputs include SLA benchmarks, cancellation drivers, repeat intervals, and the practical constraints of on-site execution.
Step 4: Research Synthesis and Final Output
We triangulate top-down service-spend proxies with bottom-up order economics, then reconcile with expert feedback to finalize segment splits, competitive positioning, and city prioritization. Outputs are quality-checked through consistency tests across fulfilment models and service categories.
- Executive Summary
- Research Methodology (Market Definitions and Assumptions, Abbreviations, Scope Boundary Conditions, Top-Down and Bottom-Up Market Sizing Framework, Demand-Side and Supply-Side Triangulation, Primary Research Approach (Aggregators, OEM/Dealer Service Heads, Fleet Operators, Technicians, Parts Distributors), Secondary Research Sources, Data Validation and Consistency Checks, Limitations and Assumptions)
- Definition and Scope
- Market Genesis and Evolution of Doorstep Automotive Services
- Operating Model Evolution (Mobile-First, Partner-Led, Hybrid Escalation Models)
- Doorstep Service Business Cycle and Seasonality
- Doorstep Service Supply Chain and Value Chain Analysis
- Stakeholder Ecosystem Mapping (OEMs, Dealers, Aggregators, Independent Garages, Parts Suppliers, RSA, Insurers, Fleets)
- Doorstep Service Unit-of-Work Architecture (Job Cards, SOPs, Diagnostic Protocols)
- Customer Trust Architecture (Pricing Transparency, Warranty, Technician Credentialing, Quality Gates)

- Growth Drivers [vehicle parc growth linkage, convenience elasticity, digital booking readiness]
- Demand Catalysts by Use-Case [urban time-cost, monsoon damage events, AC load]
- Market Challenges [trust deficit, on-site job limitations, unit economics volatility]
- Opportunities [fleet contracts, subscription bundles, diagnostics-as-a-service]
- Market Trends [standardized packages, doorstep-first funnels, warranty-led differentiation]
- Pricing Architecture and Quote Governance [menu pricing, dynamic surcharges, quote-to-bill variance]
- Service Quality and Warranty Economics [comeback rate, redo cost, parts return rate]
- Dispatch Operations and Productivity Levers [jobs/tech/day, idle time, travel radius, batching]
- Parts Supply Chain and Counterfeit Risk Controls [SKU velocity, fill rate, vendor compliance]
- Technology Stack and Data Moats [CRM/job card digitization, routing, diagnostics capture, fraud controls]
- Workforce and Skill Pipeline [technician certification, training hours, attrition drivers]
- Customer Experience and Trust Metrics [NPS proxy, repeat rate, complaint taxonomy, refund rate]
- Workshop Escalation Pathways (Doorstep-to-Garage Handoff) [conversion, leakage, SLA]
- Insurance/RSA Linkages and Claim-Adjacent Services [lead flow, turnaround time, documentation readiness]
- Competitive Intensity and Differentiation Levers
- Porter’s Five Forces
- SWOT Analysis
- By Service Revenue, 2019-2024
- By Number of Service Jobs, 2019-2024
- By Average Order Value, 2019-2024
- By Service Type (In Value %)
Car Washing & Cleaning Services
Car Detailing & Aesthetic Services
Periodic Maintenance & Preventive Services
Mechanical & Minor Repair Services
Tyre & Wheel Services - By Vehicle Type (In Value %)
Hatchback & Sedan
SUV & MPV
Luxury Vehicles - By Customer Type (In Value %)
Retail Individual Owners
Corporate & SME Employee Programs
Fleet Operators (Ride-Hailing, Logistics, Leasing)
Used-Car Dealers & Reconditioning Networks - By Fulfilment Model (In Value %)
Company-Owned Technician Network
Partner Garage-Led Doorstep Execution
Marketplace Aggregation Model
Hybrid Doorstep + Workshop Escalation - By Booking Channel (In Value %)
Mobile Application
Website
Call / WhatsApp
Partner-Led Referrals (Insurance, RSA, OEMs) - By Geography (In Value %)
Metros
Tier-1 Cities
Tier-2 & Select Tier-3 Cities

- Scope and Doorstep Feasibility Definition
- Segmentation of Car Washing & Cleaning Services (By Cleaning Type, By Interior Cleaning Depth, By Customer Engagement Model, By Vehicle Category, By Execution Location)
- Demand Drivers and Usage Triggers
- Unit Economics and Cost Structure
- Operational Constraints and Bottlenecks
- Competitive Intensity and Price Sensitivity
- Market Share Snapshot (by Revenue / Jobs)
- Competition Ecosystem Mapping [aggregators, chains, detailing specialists, RSA-led providers, hybrids]
- Cross Comparison Parameters (technician network scale, city coverage, service breadth, dispatch SLA reliability, quote-to-bill variance, warranty robustness, parts sourcing controls, customer repeat rate, monthly booking volume, booking growth momentum, booking-to-completion ratio, cancellation rate, technician utilization rate, average response time, average service completion time, first-time-fix rate, redo/revisit rate, escalation-to-workshop ratio, subscription customer penetration, fleet vs retail booking mix, payment mode split, refund and dispute incidence, customer complaint resolution time, average travel radius per job, inventory fill rate, service coverage density per city)
- SWOT of Major Players
- Detailed Company Profiles
GoMechanic
myTVS
GoBumpr
Pitstop
Park+
CARS24 Car Service
Door2Door Car Wash
Detailing Devils
The Detailing Mafia
3M Car Care
CarzSpa
Cozi Cars
Urban Company (Auto Services)
- Doorstep-Compatible Detailing Scope
- Segmentation of Car Detailing & Aesthetic Services (By Detailing Type, By Paint Protection & Surface Treatment, By Vehicle Age, By Customer Intent, By Service Duration)
- Technician Skill and Certification Requirements
- Quality Control and Redo Economics
- Competitive Differentiation Levers
- Service Scope and SOP Standardization
- Segmentation of Periodic Maintenance & Preventive Services (By Maintenance Type, By Vehicle Usage Pattern, By Parts Source, By Service Packaging, By Escalation Requirement)
- Demand Predictability and Service Cycles
- Pricing Transparency and Quote Governance
- Competitive Positioning vs Authorized Workshops
- Definition of Doorstep-Eligible Repairs
- Segmentation of Mechanical & Minor Repair Services (By Repair Type, By Diagnostic Dependency, By Technician Skill Tier, By Vehicle Segment, By Escalation Risk)
- Warranty Exposure and Liability Management
- Pricing Sensitivity and Trust Factors
- Competitive Moat Limitations
- Scope of Doorstep Tyre & Wheel Services
- Segmentation of Tyre & Wheel Services (By Service Type, By Demand Nature, By Vehicle Category, By Inventory Dependency, By Customer Segment)
- Dispatch and Response Time Economics
- RSA and Insurance Ecosystem Integration
- Safety, Trust, and Post-Service Risk
- Demand and Utilization Patterns
- Budget Allocation Behavior
- Needs, Pain Points, and Trust Barriers
- Decision-Making Process
- By Service Revenue, 2025-2030
- By Number of Service Jobs, 2025-2030
- By Average Order Value, 2025-2030


 Request a Sample
 Ask for Customization
 Get a Quote
 Enquire Now