
 Download PDF
 Download PDF
Market Overview
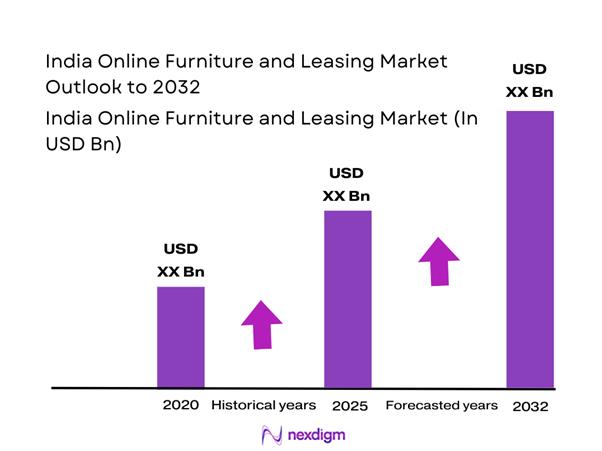
The India Online Furniture and Leasing market current size stands at around USD ~ million, supported by expanding urban mobility and digital consumption behavior. Demand growth during 2024 and 2025 was driven by increased rental adoption among younger demographics and professionals. Subscription-based furniture models gained traction due to flexible tenure options and reduced upfront commitments. The market witnessed rising platform penetration across metropolitan regions supported by logistics network expansion. Increased preference for furnished rental housing contributed to consistent transaction volumes. Platform-based leasing also benefited from improved payment infrastructure and app-based user engagement.
The market is primarily concentrated across major urban centers with high residential mobility and strong rental housing demand. Cities with large student populations and technology workforces exhibit higher platform usage intensity. Southern and western regions show stronger ecosystem maturity due to startup density and logistics readiness. Northern urban clusters demonstrate increasing adoption driven by co-living expansion. Policy frameworks supporting digital commerce and logistics modernization continue strengthening regional market participation.
Market Segmentation
By Product Type
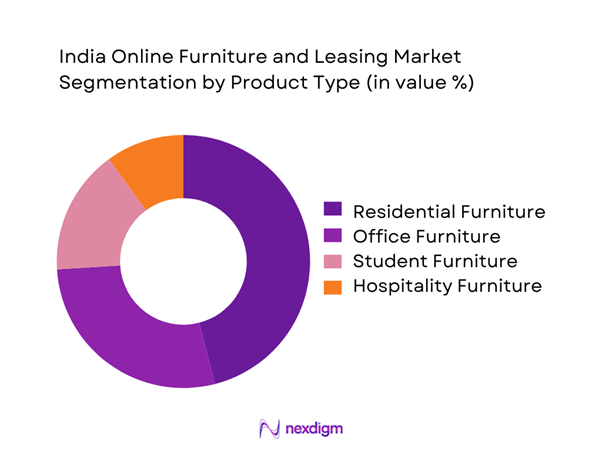
The market is dominated by residential furniture categories due to high rental demand from urban migrants and young professionals. Beds, sofas, wardrobes, and workstations account for significant leasing volumes owing to recurring replacement cycles. Office furniture leasing has grown steadily with hybrid working trends and startup expansion. Short-term rental furniture demand has risen due to flexible living arrangements and relocation frequency. Product standardization and modular design have improved asset utilization rates across platforms. Increased consumer preference for bundled furniture packages continues to influence product-level demand patterns across cities.
By Business Model
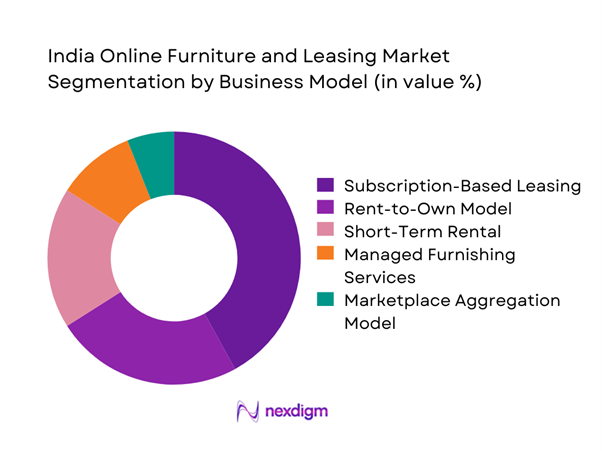
The market is increasingly shaped by differentiated business models that determine asset ownership, pricing flexibility, and service scalability. Subscription-based models dominate due to predictable monthly billing and high customer retention, particularly among urban renters and young professionals. Rent-to-own models attract price-sensitive consumers seeking eventual ownership without high upfront commitments. Pure rental models continue to serve short-term users such as students and temporary professionals. Managed furnishing solutions are gaining traction among co-living operators and enterprises requiring turnkey deployment. Platform-led aggregation models enable faster geographic expansion with lower capital intensity, strengthening market reach and operational flexibility.
Competitive Landscape
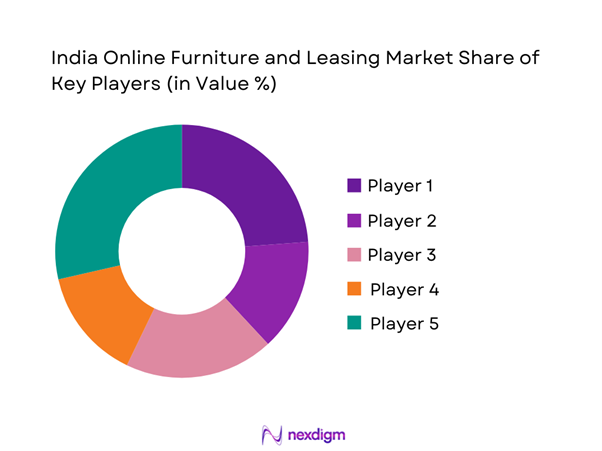
The competitive landscape is characterized by platform-driven service models and asset management capabilities. Market participants focus on logistics efficiency, product variety, and subscription flexibility to strengthen positioning.
| Company Name | Establishment Year | Headquarters | Formulation Depth | Distribution Reach | Regulatory Readiness | Service Capability | Channel Strength | Pricing Flexibility |
| Rentomojo | 2014 | Bengaluru | ~ | ~ | ~ | ~ | ~ | ~ |
| Furlenco | 2012 | Bengaluru | ~ | ~ | ~ | ~ | ~ | ~ |
| Pepperfry | 2012 | Mumbai | ~ | ~ | ~ | ~ | ~ | ~ |
| Urban Ladder | 2012 | Bengaluru | ~ | ~ | ~ | ~ | ~ | ~ |
| Cityfurnish | 2015 | Gurugram | ~ | ~ | ~ | ~ | ~ | ~ |
India Online Furniture and Leasing Market Analysis
Growth Drivers
Rising urban mobility and rental culture
Urban migration levels exceeded 30 percent of total population in 2023, increasing demand for flexible furniture solutions. Over 65 percent of urban households reported rental occupancy preferences during 2024 due to employment mobility. Government urbanization programs expanded housing availability across more than 100 smart cities nationwide. Rising student enrollments above 40 million increased short-term accommodation requirements significantly. Workforce mobility across technology hubs rose by over 18 percent during 2024. Rental housing registrations increased across eight major metropolitan regions in 2025. Urban housing supply constraints encouraged shared living arrangements across multiple income groups. Digital rental platforms processed millions of transactions supporting rapid adoption. Policy focus on urban development enhanced rental ecosystem stability. Changing lifestyle patterns continue reinforcing rental furniture acceptance.
Increasing penetration of digital commerce
Internet penetration exceeded 65 percent nationally in 2024, supporting digital platform adoption. Smartphone usage crossed 750 million active users enabling mobile-based service access. Digital payment adoption rose above 85 percent for urban consumer transactions. Government digital infrastructure programs strengthened e-commerce reliability nationwide. App-based customer onboarding reduced service access time significantly. Digital logistics tracking improved fulfillment transparency across major cities. Cloud-based platforms enhanced inventory and order management efficiency. Consumer trust in online services increased steadily across income groups. Digital literacy initiatives supported wider participation in rental ecosystems. Platform scalability improved operational consistency across multiple locations.
Challenges
High logistics and reverse logistics costs
Urban congestion increased delivery time averages by over 25 percent during 2024. Fuel price volatility impacted transportation efficiency across metropolitan logistics networks. Reverse logistics volumes rose significantly due to short rental tenures. Storage infrastructure shortages increased asset handling complexity. Warehousing costs rose across tier one cities due to limited space availability. Damage rates increased with frequent asset relocation cycles. Maintenance turnaround time extended across high-demand regions. Fleet utilization inefficiencies reduced operational productivity levels. Last-mile delivery reliability remained inconsistent across dense urban areas. Cost pressures continued affecting service scalability.
Asset damage and depreciation risks
Average asset utilization cycles shortened significantly during high-demand periods. Furniture refurbishment frequency increased due to intensive consumer usage patterns. Damage rates rose across high-mobility customer segments. Asset tracking inefficiencies affected lifecycle management accuracy. Inventory depreciation accelerated under continuous deployment conditions. Replacement requirements increased operational expenditure pressures. Insurance coverage gaps limited financial risk mitigation. Asset recovery challenges impacted long-term value retention. Maintenance infrastructure expansion lagged asset deployment growth. Depreciation management remains a core operational concern.
Opportunities
Expansion into tier II and tier III cities
Rising urbanization in smaller cities creates new demand for rental furniture solutions. Migration to emerging economic hubs increases short-term housing requirements. Lower competition levels allow faster customer acquisition opportunities. Digital penetration supports platform-based service expansion beyond metros. Affordable housing projects encourage furnished rental adoption. Local logistics networks are improving steadily in smaller cities. Consumer awareness of rental benefits continues to increase. Flexible pricing models attract first-time renters effectively. Regional partnerships can accelerate market penetration. Untapped demand potential remains substantial across emerging urban clusters.
Corporate and B2B leasing growth
Corporate workspace expansion drives demand for scalable furniture leasing solutions. Hybrid working models increase short-term office setup requirements. Startups prefer leasing to preserve capital expenditure flexibility. Large enterprises adopt leasing for project-based operations. Customized furniture packages support enterprise-level deployment efficiency. Service-level agreements enhance reliability and long-term engagement. B2B contracts ensure stable recurring revenue streams. Workspace optimization trends boost furniture turnover rates. Leasing supports rapid business expansion needs. Corporate adoption strengthens overall market stability.
Future Outlook
The market is expected to maintain strong momentum driven by urbanization and digital consumption patterns. Platform innovation and service integration will define competitive differentiation. Expansion into non-metro regions will broaden customer bases. Sustainability and asset optimization will gain importance. Long-term growth will be supported by evolving lifestyle preferences.
Major Players
- Rentomojo
- Furlenco
- Pepperfry
- Urban Ladder
- Cityfurnish
- Rentickle
- Guarented
- Featherlite
- Godrej Interio
- Wakefit
- HomeLane
- IKEA India
- Flipkart Furniture
- Amazon Furniture
- Livspace
Key Target Audience
- Urban residential renters
- Co-living space operators
- Corporate offices and enterprises
- Real estate developers
- Property management firms
- Startup incubators and coworking spaces
- Investments and venture capital firms
- Ministry of Housing and Urban Affairs
Research Methodology
Step 1: Identification of Key Variables
Market scope was defined using product types, end users, and platform models. Key demand drivers and usage patterns were mapped. Regional adoption dynamics were identified based on urbanization trends.
Step 2: Market Analysis and Construction
Data points were structured through platform activity assessment and service penetration analysis. Segmentation logic was developed using operational and consumption indicators.
Step 3: Hypothesis Validation and Expert Consultation
Industry participants and operational stakeholders were consulted to validate assumptions. Feedback helped refine growth drivers and challenge areas.
Step 4: Research Synthesis and Final Output
Insights were consolidated through cross-validation techniques. Findings were structured to ensure consistency, accuracy, and market relevance.
- Executive Summary
- Research Methodology (Market Definitions and online furniture leasing scope mapping, Digital platform and asset ownership taxonomy development, Bottom-up revenue estimation from rental contracts and order volumes, Pricing and subscription revenue modeling across tenure types, Primary interviews with platform operators and logistics partners, Data triangulation using platform metrics and financial disclosures, Assumptions on asset lifecycle, refurbishment cycles, and utilization rates)
- Definition and Scope
- Market evolution
- Usage and consumption patterns across rental and ownership models
- Ecosystem structure including platforms and logistics partners
- Supply chain and fulfillment model
- Regulatory and compliance environment

- Growth Drivers
Rising urban mobility and rental culture
Increasing penetration of digital commerce
Growing millennial and student population
Flexible workspaces and hybrid work adoption
Lower upfront cost compared to ownership
Expansion of co-living and managed housing - Challenges
High logistics and reverse logistics costs
Asset damage and depreciation risks
Customer churn and contract defaults
Inventory utilization inefficiencies
Price sensitivity and margin pressure
Regulatory ambiguity in rental taxation - Opportunities
Expansion into tier II and tier III cities
Corporate and B2B leasing growth
Smart furniture and IoT-enabled assets
Partnerships with real estate developers
Subscription bundling with appliances
Green and refurbished furniture demand - Trends
Shift toward asset-light business models
AI-driven pricing and demand forecasting
Growth of furniture-as-a-service offerings
Integration of financing and BNPL options
Focus on sustainability and circular economy
Increased app-based customer engagement - Government Regulations
- SWOT Analysis
- Stakeholder and Ecosystem Analysis
- Porter’s Five Forces Analysis
- Competition Intensity and Ecosystem Mapping
- By Value, 2020–2025
- By Volume, 2020–2025
- By Average Revenue per Order, 2020–2025
- By Fleet Type (in Value %)
Residential furniture
Beds and mattresses
Sofas and seating units
Wardrobes and storage units
Dining tables and chairs
Study tables and workstations
Office and corporate furniture
Workstations and cubicles
Office chairs and ergonomic seating
Conference tables
Storage and filing units
Reception and lounge furniture
Student housing furniture
Single beds and bunk beds
Study tables and chairs
Wardrobes and compact storage
Shared seating furniture
Hospitality and co-living furniture
Beds and headboards
Sofas and lounge seating
Side tables and utility furniture
Wardrobes and modular storage
Common area furniture - By Business Model
Subscription-based leasing
Rent-to-own model
Short-term rental model
Managed furnishing services
Marketplace-led aggregation model - By End-Use Industry (in Value %)
Residential consumers
SMEs and startups
Large enterprises
Co-living and co-working operators - By Connectivity Type (in Value %)
Mobile application-based platforms
Web-based platforms
Omnichannel models - By Region (in Value %)
North India
Delhi NCR
Haryana
Punjab
Uttar Pradesh
Rajasthan
South India
Karnataka
Tamil Nadu
Telangana
Andhra Pradesh
Kerala
West India
Maharashtra
Gujarat
Rajasthan
Goa
East India
West Bengal
Odisha
Bihar
Jharkhand
North Eastern States
- Market structure and competitive positioning
Market share on the basis of GMV
Market share on the basis of Number of Transactions - Cross Comparison Parameters Cross Comparison Parameters (Business model, Asset ownership structure, Product portfolio depth, Geographic footprint, Logistics capability, Customer segment focus, Subscription flexibility, Service turnaround time, Technology integration, Brand positioning, After-sales and maintenance support, Corporate and B2B focus, Partnerships and ecosystem integration, Brand positioning and recall)
- Operational Cross Comparison Parameters (GMV, GMV split by type of product, number of orders, average order value, best selling product, sourcing, target audience, focus region, GMV split by states, traffic, conversion rate, EBITDA, EBITDA margin, number of employees, average duration of rental, orders by rental duration)
- SWOT Analysis of Key Players
- Pricing and Commercial Model Benchmarking
- Detailed Profiles of Major Companies
Rentomojo
Furlenco
Pepperfry
Urban Ladder
Rentickle
Cityfurnish
Guarented
IKEA India
Flipkart Furniture
Amazon Furniture
Wakefit
Godrej Interio
Featherlite
HomeLane
Livspace
- Urban renters and migrant professionals
- Students and shared accommodation residents
- Co-living and managed housing operators
- Startups and SMEs
- Large corporate offices
- Hospitality and serviced apartment operators
- By Value, 2026–2032
- By Volume, 2026–2032
- By Average Revenue per Order, 2026–2032


 Request a Sample
 Ask for Customization
 Get a Quote
 Enquire Now