
 Download PDF
 Download PDF
Market Overview
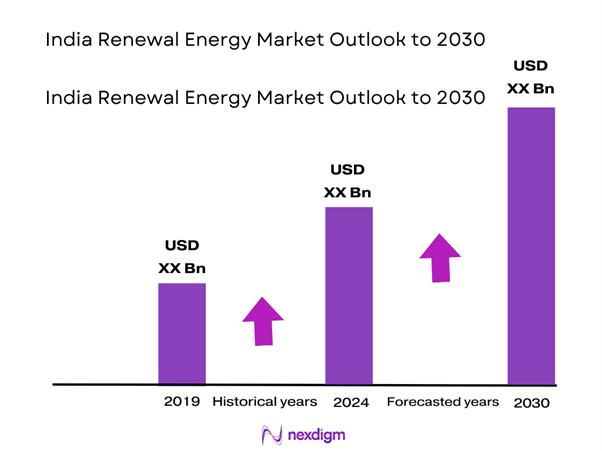
The India Renewable Energy Market is valued at USD 33.6 billion, based on a five-year historical analysis. The market is driven by the aggressive capacity addition of solar and wind installations, with solar energy contributing over 72 GW of installed capacity and wind accounting for over 44 GW. Government-led incentives such as the Production Linked Incentive (PLI) scheme for solar modules, viability gap funding (VGF) for battery energy storage systems, and green open access rules have accelerated utility-scale and rooftop solar adoption. The emphasis on achieving 500 GW of non-fossil capacity is a major growth enabler.
Rajasthan, Gujarat, Tamil Nadu, Karnataka, and Maharashtra are the dominant states in the market due to a combination of favorable solar radiation, high wind potential, land availability, and proactive state policies. For instance, Rajasthan alone contributes over 17% of the total solar capacity in India, owing to its large desert terrain and government-backed land leasing policies. Similarly, Tamil Nadu continues to lead in wind power due to its extensive coastal belt and early policy adoption.
Market Segmentation
By Technology Type
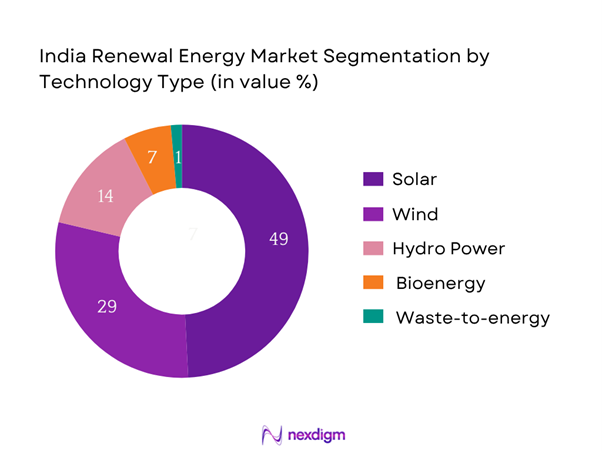
India’s renewable energy market is segmented by technology into solar energy, wind energy, hydropower, bioenergy, and waste-to-energy. Recently, solar energy has a dominant market share under the segmentation technology type, primarily due to its rapidly declining cost curve, modular scalability, and ease of deployment across both rooftop and utility-scale applications. Large developers such as Adani Green and ReNew Power are heavily investing in solar parks and floating solar installations. Moreover, the government’s push for distributed solar through the PM Surya Ghar Yojana and the solarization of agriculture has significantly boosted this segment.
By End User
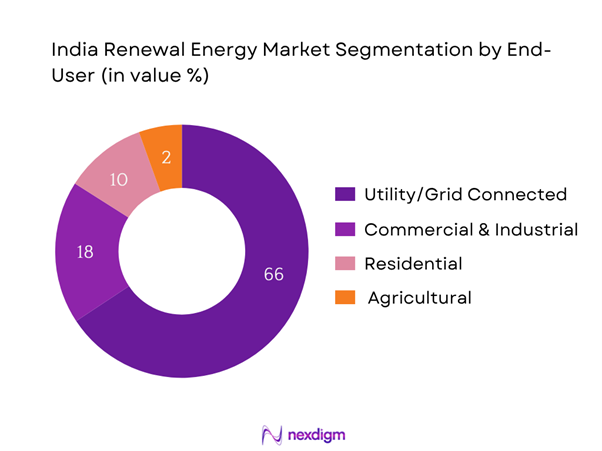
India’s renewable energy market is segmented by end user into residential, commercial & industrial, agriculture, and utility/grid connected. Recently, the utility/grid connected segment dominates the market share due to bulk procurement through competitive bidding, favorable grid-tie regulations, and strong demand aggregation from DISCOMs. State-level tenders for round-the-clock (RTC) renewable power and hybrid energy supply contracts have expanded the footprint of large-scale renewable developers. Projects under SECI and NTPC Renewable Energy Ltd. are largely driven by utility demand, offering long-term PPAs and stable revenue visibility.
Competitive Landscape
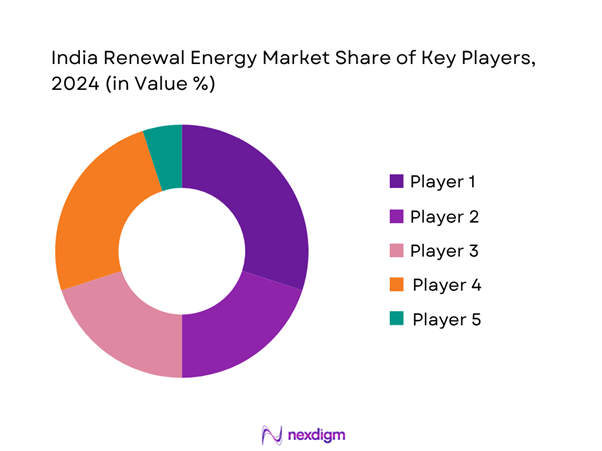
The India renewable energy market is consolidated with a few leading players dominating capacity additions, innovation, and EPC capabilities. Players such as Adani Green, ReNew Power, and Tata Power Renewable Energy have established strong project pipelines, secure power purchase agreements (PPAs), and robust investor confidence. Their ability to offer integrated solutions including storage, hybrid RE, and green hydrogen gives them a strategic edge in India’s decarbonization roadmap.
| Company Name | Establishment Year | Headquarters | Installed RE Capacity (GW) | Number of Projects | Avg. Tariff Offered (₹/kWh) | Equity Funding Source | Presence in Hybrid Projects | Battery Storage Capability | PPA Tenure (Years) |
| Adani Green Energy | 2015 | Ahmedabad | – | – | – | – | – | – | – |
| ReNew Power | 2011 | Gurugram | – | – | – | – | – | – | – |
| Tata Power Renewable | 2007 | Mumbai | – | – | – | – | – | – | – |
| Greenko Group | 2006 | Hyderabad | – | – | – | – | – | – | – |
| NTPC Renewable Energy | 2020 | New Delhi | – | – | – | – | – | – | – |
India Renewable Energy Market Analysis
Growth Drivers
Policy Incentives
India deployed ₹74,000 crores in renewable energy projects in 2023, installing 13.5 GW of capacity through schemes managed by MNRE. Additionally, in June 2024, the World Bank approved a $1.5 billion loan to accelerate low-carbon energy development—including renewables and green hydrogen. These significant public and multilateral financing flows have been directly tied to procurement mechanisms, capital subsidies, and manufacturing-linked incentives, collectively enabling rapid scale in both utility-scale and distributed solar installations. The presence of ₹93,041 crore investment into domestic solar manufacturing (through phased ALMM tranches) further underpins project feasibility.
Net Metering
Rooftop solar PV capacity reached approximately 9 GW, reflecting 13% of India’s total 67 GW solar capacity. State regulators offer net metering compensation—such as excess generation paid ~₹3.14/kWh under RERC rules. This policy creates strong consumer value proposition for residential and commercial rooftop systems, triggering installation rates exceeding 1.4 GW/year. By enabling energy export, net metering supports decentralized investment and builds distributed infrastructure—critical in regions where centralized grid expansion is slower.
Market Challenges
Grid Congestion
India added between 15–20 GW of renewables annually, but regional grid bottlenecks persist. As of April 2025, the CEA reports 3,532 MW of renewable capacity added but transmission lines grew by only 358 circuit‑km. This mismatch has left solar or wind parks stranded without evacuation routes, forcing curtailments and project delays. The Central Electricity Authority’s Uniform Protection Protocol for grid stability aims to integrate 450 GW by 2030, but current infrastructure deficits undermine system reliability and deter capital mobilization.
Land Acquisition
Land acquisition challenges disrupted renewable installations: solar installations fell by 44% in 2023 due to stalled land deals. Noteworthy conflicts, like the Tata Power 100 MW project in Maharashtra, led to public protests and administrative halts. Rural residential rights, unclear documentation, and socio-environmental opposition are persistent barriers. These legal and institutional delays inflate project timelines and block tender execution, hindering India’s broader transition targets.
Opportunities
Green Hydrogen
Under India’s National Green Hydrogen Mission (approved January 2023), the country targets 5 million metric tonnes annual green hydrogen production by 2030. The World Bank’s $1.5 billion financing supports electrolyser deployment and hydrogen production. India’s electrolyser manufacturing incentive scheme, with ₹4,440 crore funding and domestic deployment, targets 7400 MW capacity by late 2024, rising to 16,800 MW by 2025. These numbers reflect immediate industrial push to build end-to-end green hydrogen supply chains and diversify energy mix.
Offshore Wind
Though nascent, India’s offshore wind pipeline is gaining policy traction. As of 2024, national transmission expansions under the Green Grids initiative are being planned to accommodate coastal wind farms . S&P Global reports utility-scale RE surpassing 200 GW, with clean energy investments expected to double to $32 billion by 2025. With high offshore potential along Gujarat and Tamil Nadu coasts, this momentum suggests offshore wind can contribute significantly to India’s next-gen energy mix.
Future Outlook
Over the next 5 years, the India Renewable Energy Market is expected to show significant growth driven by continuous government support, advancements in clean energy technology, and increasing industrial adoption of green power. The aggressive national target of achieving 500 GW of non-fossil capacity by 2030 is expected to create substantial momentum, especially in solar-wind hybrid and RTC tenders. Initiatives such as the National Green Hydrogen Mission, PM-KUSUM for agricultural solarization, and Battery Energy Storage System (BESS) tenders will further deepen the market’s reach. Moreover, evolving policies enabling peer-to-peer energy trading, virtual PPAs, and ISTS waiver extensions will promote demand-side participation from large industrial buyers. Urban and semi-urban households are expected to benefit from residential rooftop solar with net metering, especially as costs fall below grid parity in more states. On the financing side, green bonds, foreign institutional investment, and ESG-driven funds are expected to scale up deployment, while innovation in modular and containerized storage systems will help reduce intermittency concerns.
Major Players
- Adani Green Energy
- ReNew Power
- Tata Power Renewable Energy
- Greenko
- NTPC Renewable Energy Ltd.
- JSW Energy
- Azure Power
- Sembcorp Energy India
- Hero Future Energies
- Ayana Renewable Power
- O2 Power
- NHPC
- Avaada Energy
- Amplus Solar
- Torrent Power
Key Target Audience
- Renewable Energy Developers and EPC Companies
- Independent Power Producers (IPPs)
- State Electricity Distribution Companies (DISCOMs)
- Utility-Scale Battery Storage Providers
- Corporate Buyers with High RE Consumption (C&I Sector)
- Investment and Venture Capitalist Firms
- Government and Regulatory Bodies (MNRE, SECI, CERC, SERCs)
- Foreign Institutional Investors (FII) looking at ESG-aligned infrastructure
Research Methodology
Step 1: Identification of Key Variables
The initial phase involves constructing an ecosystem map encompassing all major stakeholders within the India Renewable Energy Market. This step is underpinned by extensive desk research, utilizing a combination of secondary and proprietary databases to gather comprehensive industry-level information. The primary objective is to identify and define the critical variables that influence market dynamics.
Step 2: Market Analysis and Construction
In this phase, we will compile and analyze historical data pertaining to the India Renewable Energy Market. This includes assessing installed capacities by region and technology, financing mechanisms, and PPA-linked revenue models. Furthermore, we evaluate electricity tariff trends and project implementation timelines to ensure the reliability and accuracy of market estimates.
Step 3: Hypothesis Validation and Expert Consultation
Market hypotheses will be developed and subsequently validated through computer-assisted telephone interviews (CATIs) with industry experts representing a diverse array of stakeholders including developers, DISCOMs, and state regulators. These consultations will provide valuable insights into operational bottlenecks and demand patterns.
Step 4: Research Synthesis and Final Output
The final phase involves direct engagement with RE project developers, investors, and state agencies to acquire real-time insights into hybrid projects, battery deployment, and capital allocation trends. This interaction helps verify data from bottom-up modeling, ensuring the robustness and business relevance of our final report.
- Executive Summary
- Research Methodology
(Market Definitions and Assumptions, Abbreviations, Market Sizing Approach, Consolidated Research Approach, Understanding Market Potential Through In-depth Industry Interviews, Primary Research Approach, Limitations and Future Assumptions)
- Definition and Scope
- Evolution of Renewable Energy in India
- Energy Transition Milestones in India
- Stakeholder Value Chain Analysis (Policy Bodies, Developers, EPCs, OEMs, IPPs, DISCOMs, Consumers)
- Grid Connectivity and Integration Challenges

- Growth Drivers
Policy Incentives
Net Metering
State RPOs
Declining Panel Costs
Carbon Offset Goals - Market Challenges
Grid Congestion
Land Acquisition
Tariff Caps
Payment Delays by DISCOMs - Opportunities
Green Hydrogen
Offshore Wind
Energy Storage
Carbon Credits
Virtual PPAs - Trends
Solar-Wind Hybrids
Round-the-Clock Power Tenders
Battery-Integrated Systems
Digitization of RE - SWOT Analysis
- Stakeholder Ecosystem Mapping
- Porter’s Five Forces
- By Value, 2019-2024
- By Installed Capacity (in GW), 2019-2024
- By Average Tariff (₹/kWh), 2019-2024
- By Technology Type (In Value %)
Solar
– Utility-Scale Solar
– Rooftop Solar
– Floating Solar
Wind
– Onshore Wind
– Offshore Wind
Hydro
– Small Hydro
– Large Hydro
– Pumped Storage
Bioenergy
– Biomass
– Bagasse
– Biogas
Waste-to-Energy
– Municipal Solid Waste Plants
– RDF-based Waste Plants
– Industrial Waste-Based Energy Plants - By End User (In Value %)
Residential
– Rooftop Solar for Independent Homes, Apartments
– Solar Water Heaters, Solar Inverters
– Net/Gross Metering Adoption
Commercial & Industrial (C&I)
– Captive Solar/Wind PPAs
– Rooftop + Battery Storage Solutions
– Open Access RE Procurement
Agricultural
– Solar Water Pumps
– Off-grid Solar for Irrigation and Cold Storage
– Bioenergy for Rural Agro-industries
Utility/Grid Connected
– Central/State Govt-led Solar & Wind Parks
– Renewable Energy Integration under DISCOMs
– Hybrid RE + Storage under SECI tenders - By Mode of Installation (In Value %)
Rooftop
– Net Metered and Gross Metered Models
– C&I Rooftop Installations
– Community Rooftop Projects
Ground-Mounted
– ISTS (Inter-State Transmission System) Connected Projects
– Group Captive Solar/Wind Parks
– Third-party Power Sale under Open Access
Hybrid RE Systems
– Wind + Solar Hybrid
– Solar + Battery Storage Systems
– Wind + Battery + Solar
Off-Grid/Microgrid Systems
– Mini-Grids for Remote Villages (under DDUGJY, Saubhagya)
– Standalone Solar/Biomass Plants
– Community-Based Energy Cooperatives - By State (In Value %)
Rajasthan
Gujarat
Tamil Nadu
Karnataka
Maharashtra - By Source of Financing (In Value %)
Government Subsidized
– Central Financial Assistance
– State subsidies for agri-solar
International Funding
– World Bank
– ADB
– JICA
Green Bonds / Private Equity
– REITs and Infrastructure Investment Trusts
– Green Bond Issuances by NTPC, ReNew Power, etc.
– VC/PE investment in RE startups and OEMs
Corporate Power Purchase Agreements (CPPAs)
– Direct B2B contracts for C&I clients
– Off-site solar parks dedicated to corporates
Captive Consumption Projects
– Self-owned RE assets by manufacturing companies
– Co-located or remote net-metered installations
- Market Share of Major Players (By Installed Capacity & Revenue)
- Cross Comparison Parameters (Installed Capacity (GW), Number of Operational Projects, Avg. Tariff (₹/kWh), Expansion Pipeline, Land Bank Holdings, PPA Duration, Equity Backing, EPC Partnerships, O&M Capabilities)
- SWOT Analysis of Leading Players
- Pricing Benchmark: Tariff Comparison by Technology and State (₹/kWh)
- Detailed Profiles of Major Companies
Adani Green Energy
ReNew Power
Tata Power Renewable Energy
NTPC Renewable Energy
Sembcorp Energy India
Greenko
JSW Energy
Azure Power
Ayana Renewable Power
NHPC
O2 Power
Avaada Energy
Hero Future Energies
Torrent Power
Amplus Solar
- Consumer Energy Needs & Consumption Behaviour
- Investment Appetite for RE Assets
- Barriers to Entry for Residential and C&I Segments
- Rooftop vs Utility Preference Trends
- Key Drivers of Demand
- By Value, 2025-2030
- By Installed Capacity (in GW), 2025-2030
- By Average Tariff (₹/kWh), 2025-2030


 Request a Sample
 Ask for Customization
 Get a Quote
 Enquire Now