
 Download PDF
 Download PDF
Market Overview
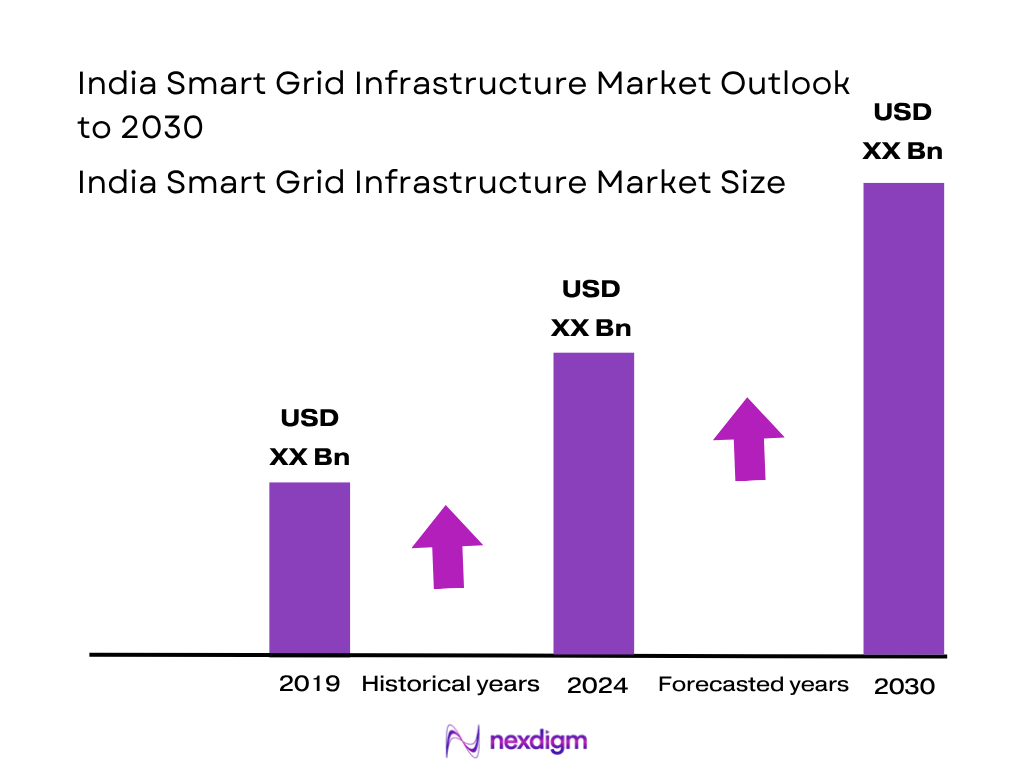
The India Smart Grid Infrastructure Market is valued at USD 578.32 million, based on projection for 2024, following from USD 578.32 million in 2023 and consistent secondary reporting. This market size is driven by increasing utilities’ deployment of advanced metering infrastructure, distribution automation and grid communication systems, supported by National Smart Grid Mission and RDSS initiatives.
Major cities and regions leading deployment include Delhi, Mumbai, Bengaluru, and Chennai, as well as progressive states like Rajasthan and Gujarat. These dominate due to their high urban electricity demand, strong utility fiscal capacity, early adoption of smart meters under state reforms, and pilot smart city grid modernization projects, supported by infrastructure readiness and state-level policy support.
Market Segmentation
By Technology Component
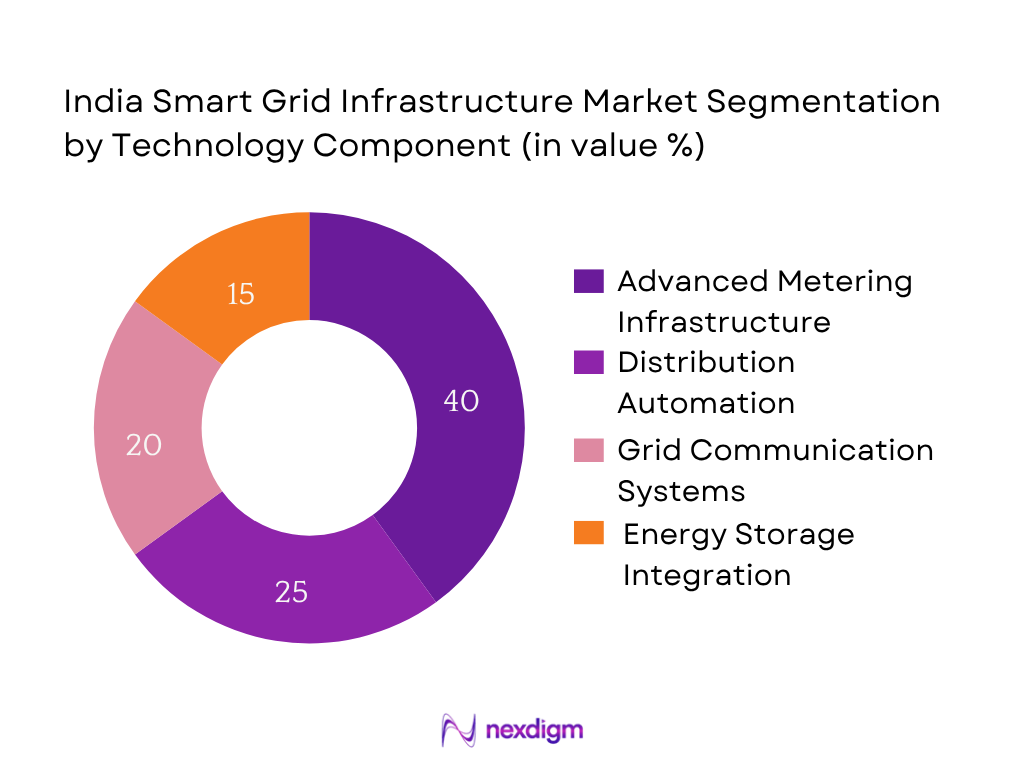
The India Smart Grid Infrastructure Market is segmented by technology component into AMI, distribution automation, energy storage integration, and grid communication systems. AMI holds the dominant market share in 2024 (approx. 40%) due to utilities prioritizing smart meter rollouts under national smart metering mandates. Rapid deployment across urban and semi-urban centers, high billing transparency, billing efficiency, and non-technical loss reduction have made AMI the largest sub‑segment in technology deployment.
By End‑User Segment
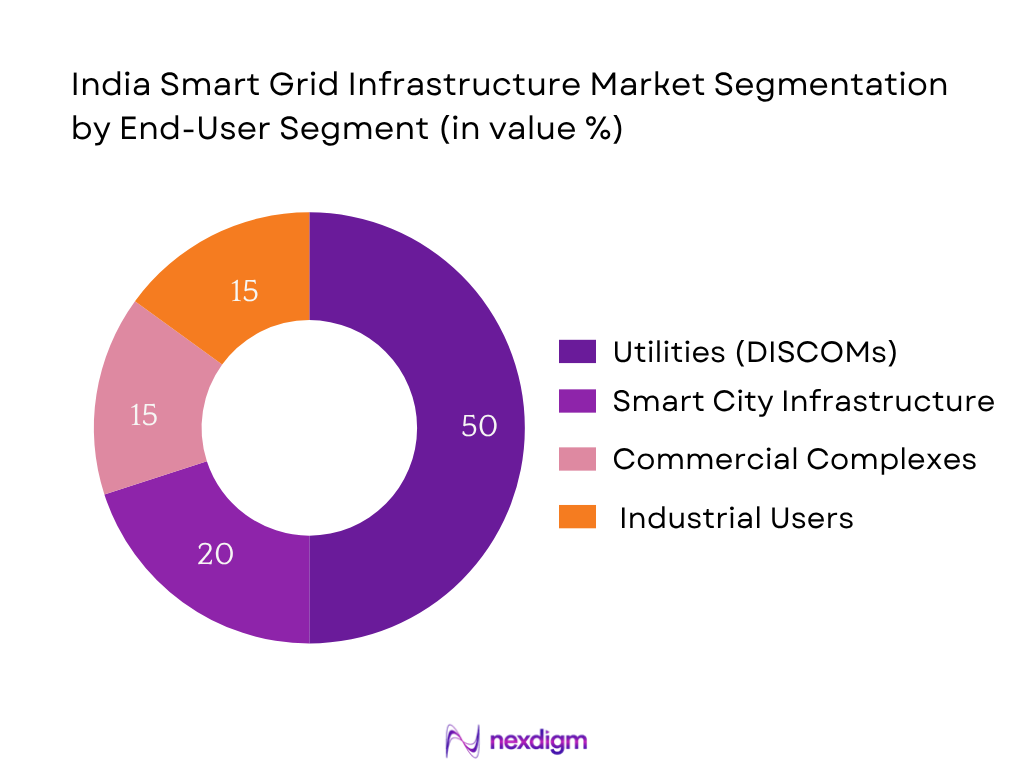
The India Smart Grid Infrastructure Market is segmented by end‑user into utilities, industrial users, commercial complexes, and smart city infrastructure. Utilities (DISCOMs) dominate the market with about 50% share in 2024 as DISCOMs lead procurement and deployment of smart grid infrastructure nationwide. Their access to central funding under RDSS/NSGM, obligation to modernize distribution networks, and scale deployment of smart meters and SCADA systems make them the largest end‑user archetype.
Competitive Landscape
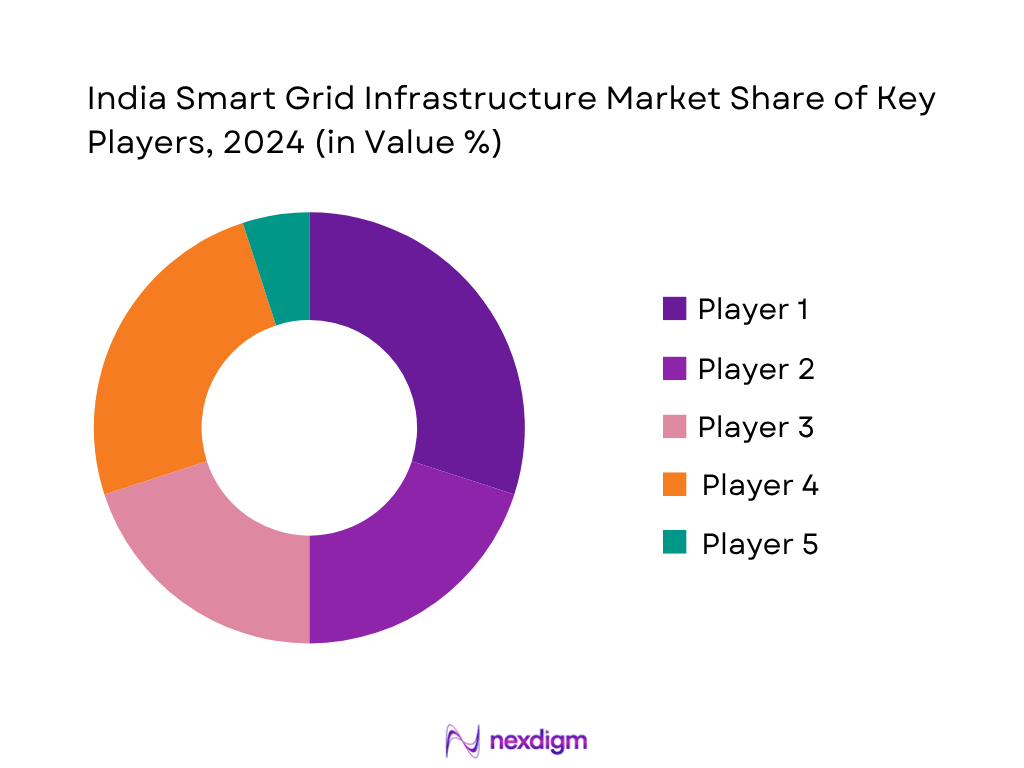
The India Smart Grid Infrastructure Market is shaped by a mix of global technology providers and established system integrators. A handful of major players—including global firms like Schneider Electric, Siemens, ABB, and local infrastructure companies—account for the bulk of smart meter rollouts, distribution automation, and turnkey grid modernisation projects. Strong alliances with DISCOMs, participation in national tenders, and experience in multi-state implementations enable these companies to shape competitive intensity.
| Company | Establishment Year | Headquarters | Smart Meter Deployments (Nos) | State‑Level Project Footprint | SCADA/WAMS Deployments | Strategic Partnerships | Revenue from India (USD Mn) |
| Siemens Ltd. | 1847 | Bengaluru | – | – | – | – | – |
| Schneider Electric India | 1836 | Mumbai | – | – | – | – | – |
| ABB India | 1988 | Vadodara | – | – | – | – | – |
| L&T Electrical & Automation | 1945 | Mumbai | – | – | – | – | – |
| Tata Power‑DDL | 1915 | Delhi | – | – | – | – | – |
India Smart Grid Infrastructure Market Analysis
Growth Drivers
Government Funding under RDSS and NSGM
The Government of India has sanctioned ₹136.95 crore under the National Smart Grid Mission (NSGM) for April 2021–2024, with ₹45.42 crore as budgetary support (30% grant component), to support institutional capacity building and smart grid pilots. Under RDSS, funding includes lump-sum grants of up to ₹900 per smart meter in general and ₹1,350 in special category states, covering 15‑22.5 % of per‑meter costs. As of November 2024, 222.45 million consumer meters have been sanctioned, indicating scale of government-backed rollout.
Push for 24×7 Power and Energy Access
India generated 1,949 TWh of electricity in fiscal 2023–24, with 1,395 kWh per capita consumption. To support universal 24×7 power access, the Government has allocated increased funds for grid infrastructure—solar grid‑connected allocations rose by 79 % in 2024‑25 period over previous year. These macro figures underline the urgent need for smart grid components—smart meters, distribution automation—to improve reliability and meet rising demand.
EV Charging and Load Balancing Integration
While explicit national EV‑load balancing numeric data for 2024 is limited, major smart grid pilots under states like Delhi and Gujarat integrate EV charging stations with distribution automation and demand response systems, supported by NSGM frameworks. NSGM funded 10 smart grid pilot projects with capacity-building and technical roadmaps via ₹45.42 crore grant funding, enhancing utilities’ readiness for EV‑charging load management. These grant‑supported initiatives reflect the macro push to integrate EV demand within grid modernization efforts.
Market Challenges
High Initial Investment and ROI Uncertainty
Smart grid deployments require significant upfront capital. Although RDSS caps government grants at ₹900–1,350 per meter, remaining cost burden (~78–85 %) falls on DISCOMs and private operators. NSGM provided ₹136.95 crore over three years, of which only ₹45.42 crore is grant‑based. Utilities must finance remaining operational and capital costs, while revenue gains from theft mitigation and efficiency must offset investment, creating ROI uncertainty in fiscally stressed states.
Cybersecurity and Data Privacy Issues
Smart grid deployments entail real-time data from 16.83 million installed consumer meters and 0.21 million DT meters sharing sensitive consumption data across networks. The expansion of RF‑mesh, PLC, cellular and IT systems increases vulnerability to cyber-attacks. As the electricity sector generated 1,949 TWh in 2023–24, digital systems managing such scale require robust cybersecurity standards. Government bodies acknowledge need for secure operations but penetration is nascent.
Market Opportunities
AI and ML‑Enabled Grid Predictive Maintenance
Smart meters and sensors generate data—11.6 million consumer meters installed by mid‑2024. Utilities can apply AI/ML on grid telemetry to detect anomalies, forecast faults, and optimize maintenance schedules. National smart grid projects under NSGM have funding (₹45.42 crore) allocated to capacity‑building modules that support AI analytics integration. This opens opportunities for tech vendors to offer predictive solutions to DISCOMs seeking operational efficiency.
Battery Storage for Grid Stabilization
While specific battery storage numbers are yet nascent, NSGM grant scheme allows project cost support up to 30% and full grant for training/technical assistance. India’s electricity generation in FY 2023–24 was 1,949 TWh, with green energy corridor allocation increased to ₹600 crore in 2024‑25 budget (up from ₹434 crore). As renewable integration accelerates, battery storage for frequency regulation, peak load management and inverter‑based support becomes a key future-growth sub-segment within smart grid projects.
Future Outlook
Over the period 2024–2030, the India Smart Grid Infrastructure Market is forecast to grow at a CAGR of 13.24%, with expected value rising to approximately USD 2.43 billion by 2030. Continued momentum in AMI roll‑outs, distribution automation, expansion under smart city programs, and increasing integration with renewable energy systems will fuel growth. Government‑led initiatives and investments in energy storage infrastructure will further accelerate adoption across utilities and end users.
Major Players
- Siemens Ltd.
- Schneider Electric India
- ABB India
- L&T Electrical & Automation
- Tata Power‑DDL
- GE Vernova (India)
- Landis+Gyr India
- Tech Mahindra
- Wipro Limited
- Genus Power Infrastructures
- Secure Meters Ltd.
- Honeywell Automation India
- Kalkitech
- Intellismart Infrastructure
- HPL Electric & Power
Key Target Audience
- Utilities (State and Central DISCOMs)
- Renewable Energy Generators
- Grid Equipment Manufacturers and Vendors
- EPC contractors in power and utilities
- Investments and Venture Capitalist Firms (investing in smart grid technologies)
- Government and Regulatory Bodies (Ministry of Power, CEA, CERC)
- State Transmission and Load Dispatch Centres
- Electric Vehicle Infrastructure Developers
Research Methodology
Step 1: Identification of Key Variables
An ecosystem map was developed covering DISCOMs, smart meter vendors, system integrators, renewable energy generators, regulators, and technology providers via secondary databases and desk research to define core market variables.
Step 2: Market Analysis and Construction
Historical data on installations of smart meters, distribution automation projects, service segments, and value chain revenues were analysed using bottom‑up approaches to estimate market size and validate penetration rates.
Step 3: Hypothesis Validation and Expert Consultation
Hypotheses on deployment growth and technology adoption were validated through telephone and online interviews with utility officials, smart grid project leads and technology vendors for operational and financial data.
Step 4: Research Synthesis and Final Output
Insights were further validated through engagements with major companies across smart grid project portfolios, revenue breakdowns and geographic presence to triangulate bottom‑up data and ensure accuracy.
- Executive Summary
- Research Methodology (Market Definitions and Assumptions, Abbreviations, Market Sizing Approach, Consolidated Research Framework, Primary and Secondary Research Inputs, Expert Interviews, Limitations and Projections)
- Definition and Scope
- Evolution of Smart Grid in India
- Integration with National Power Grid (POSOCO & RLDCs)
- Business Model Analysis (CAPEX, OPEX, BOOT, PPP)
- Regulatory Ecosystem (CEA, MoP, CERC, SERCs)
- Value Chain and Stakeholder Mapping

- Growth Drivers
Government Funding under RDSS and NSGM
Push for 24×7 Power and Energy Access
EV Charging and Load Balancing Integration
Rising Non-Technical Losses and Theft Reduction
Urbanization and Smart City Integration - Market Challenges
High Initial Investment and ROI Uncertainty
Cybersecurity and Data Privacy Issues
Interoperability of Legacy and Smart Systems
Skewed DISCOM Financial Health
Lack of Technical Expertise and Talent Gap - Market Opportunities
AI and ML-Enabled Grid Predictive Maintenance
Battery Storage for Grid Stabilization
Smart Grid-as-a-Service (SGaaS) Models
Renewable Integration into Smart Grids
Demand Side Energy Management - Trends
Advanced Grid Analytics and Digital Twins
AMI 2.0 and Multi-Tariff Billing Innovations
Integration with IoT and Smart Home Devices - Regulatory Framework
Smart Metering Mandates
CEA Interconnection Guidelines
Cybersecurity Frameworks from MoP and CERT-In - SWOT Analysis
- Stakeholder Ecosystem
- Porter’s Five Forces Analysis
- By Value, 2019-2024
- By Volume (Substation Automation, AMI Installations, etc.), 2019-2024
- By Project Count (RDSS, NSGM, State Initiatives), 2019-2024
- By Technology Component (In Value %)
Advanced Metering Infrastructure (AMI)
Distribution Automation
Energy Storage Systems
Wide Area Measurement Systems (WAMS)
Outage Management Systems - By Communication Technology (In Value %)
RF Mesh
Power Line Communication (PLC)
Cellular Networks (4G/5G)
Optical Fiber
Satellite - By End-Use Segment (In Value %)
Utilities (DISCOMs)
Commercial Complexes
Industrial Units
Smart Cities
Renewable Plants - By Application Area (In Value %)
Transmission Network Optimization
Distribution Grid Monitoring
Demand Response
Remote Fault Detection
Electric Vehicle Charging Infrastructure - By Region (In Value %)
North
South
East
West
Northeast
- Market Share by Value and Installations
- Cross Comparison Parameters (Company Overview, Technology Portfolio, Project Footprint (State-Wise), Number of Smart Meters Deployed, Strategic Partnerships, R&D Capabilities, Regulatory Compliance & Certifications, SCADA/WAMS Deployments, Turnkey Capabilities, Revenue from India Market
- SWOT Analysis of Key Players
- Pricing Benchmarking for AMI, DA, and Software Solutions
- Detailed Company Profiles
Siemens Ltd.
GE Vernova
Schneider Electric
Tata Power-DDL
ABB India
Honeywell Automation
L&T Electrical & Automation
Landis+Gyr
Tech Mahindra
Wipro
Genus Power Infrastructures
HPL Electric & Power
Kalkitech
Intellismart Infrastructure
Secure Meters Ltd.
- End User Consumption Patterns and Load Profiles
- Budget Allocation by Utilities and Cities
- Procurement Models (Tenders, PPPs, Turnkey)
- Performance Expectations and Service-Level Agreements (SLAs)
- Digital Readiness and Adoption Barriers
- By Value, 2025-2030
- By Volume, 2025-2030
- By Project Count, 2025-2030


 Request a Sample
 Ask for Customization
 Get a Quote
 Enquire Now