 Market Outlook to 2030")
 Market Outlook to 2030") Download PDF
Download PDF Download PDF
Market Overview
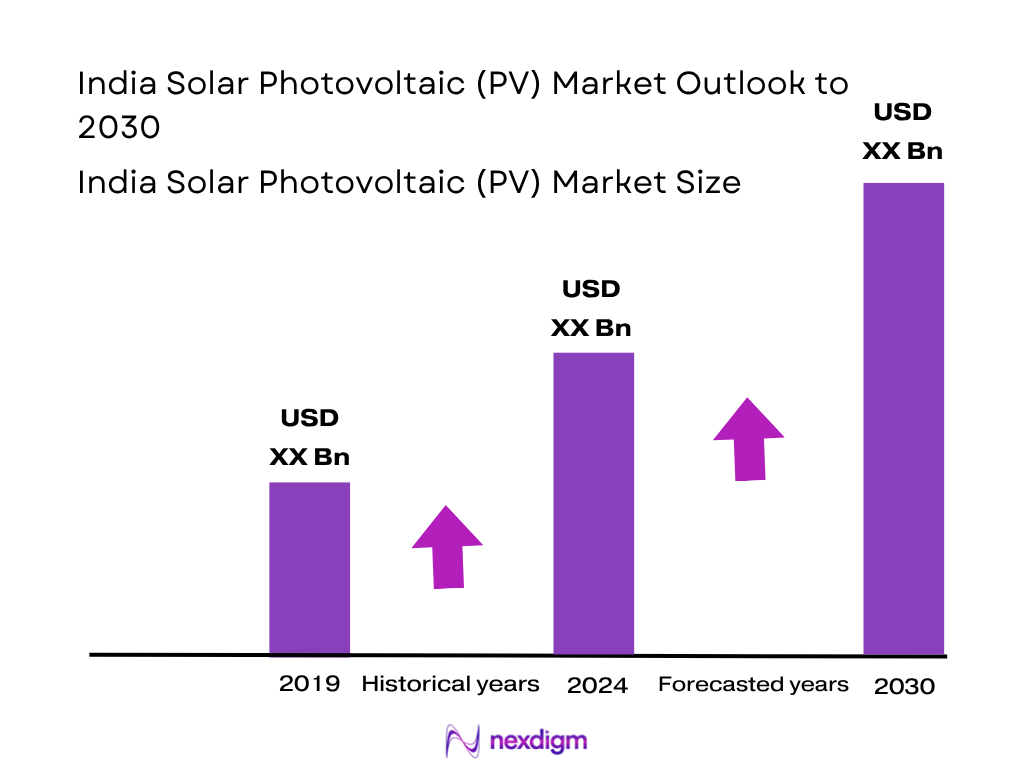
The India Solar PV market is valued at USD 11.7 billion, based on a five‑year historical estimate using data from 2023’s USD 10.4 billion. This growth has been driven by robust government support—especially subsidy schemes and net‑metering policies—declining module costs, and escalating energy demand from commercial, industrial, and residential sectors.
Certain Indian states dominate the solar PV landscape due to favorable climate, land availability, and policy support. Gujarat leads overall installed capacity with over 19,400 MW of solar, owing to early policy adoption and solar parks. Maharashtra’s Nagpur excels in rooftop deployment, credited to strong incentives and streamlined adoption under PM Surya Ghar yojana.
Market Segmentation
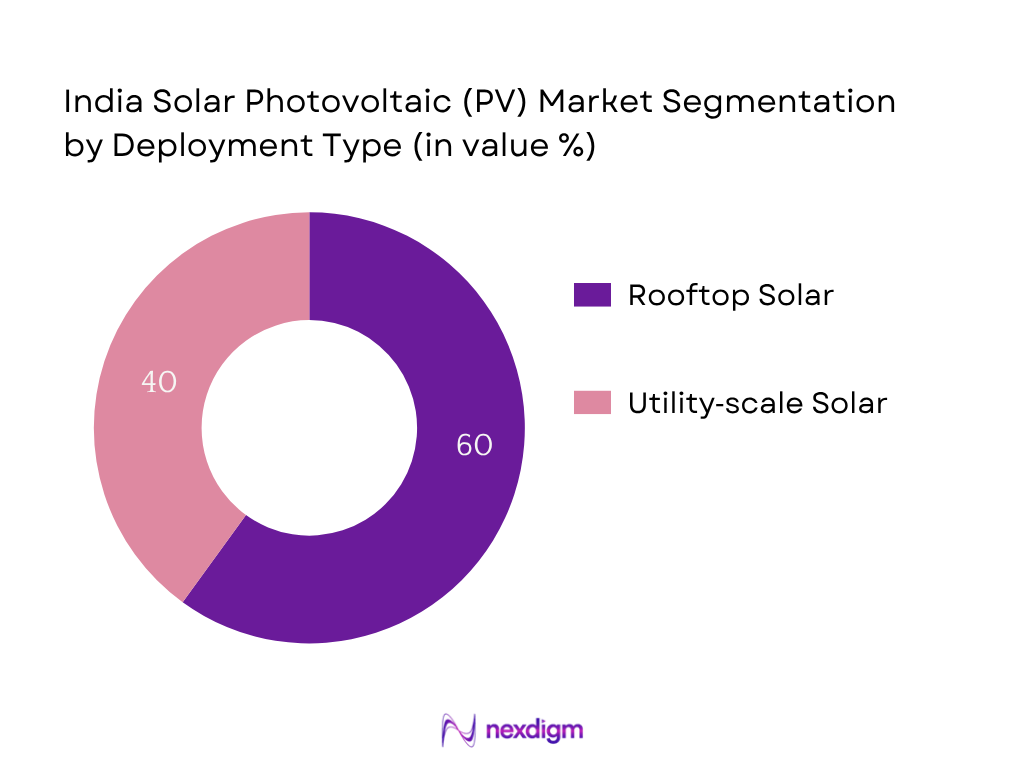
By Deployment Type
The India Solar PV market is segmented by deployment into rooftop and utility‑scale/ground‑mounted. Currently, rooftop solar dominates with approximately 80% share of rooftop installations and over half of rooftop capacity attributed to industrial users (~54%) in 2024. This dominance stems from cost savings on electricity bills for industries, easy rooftop access, and attractive subsidies and net‑metering policies.
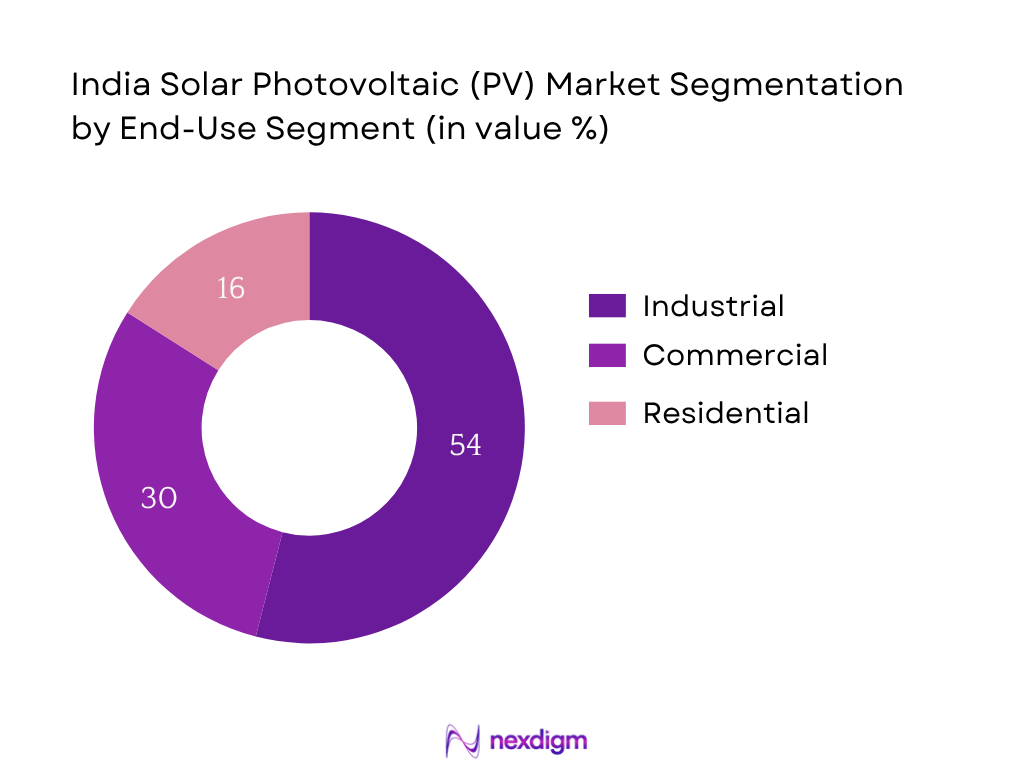
By End‑Use Segment
Within rooftop solar PV, the industrial segment holds a dominant ~54% share in 2024, with an installed capacity of about 8,010 MW. This leadership arises from high power consumption by industrial users, a drive to cut operational energy costs, and large roof areas available for high‑capacity installations. Government incentives targeted at MSMEs further reinforce this segment’s growth.
Competitive Landscape
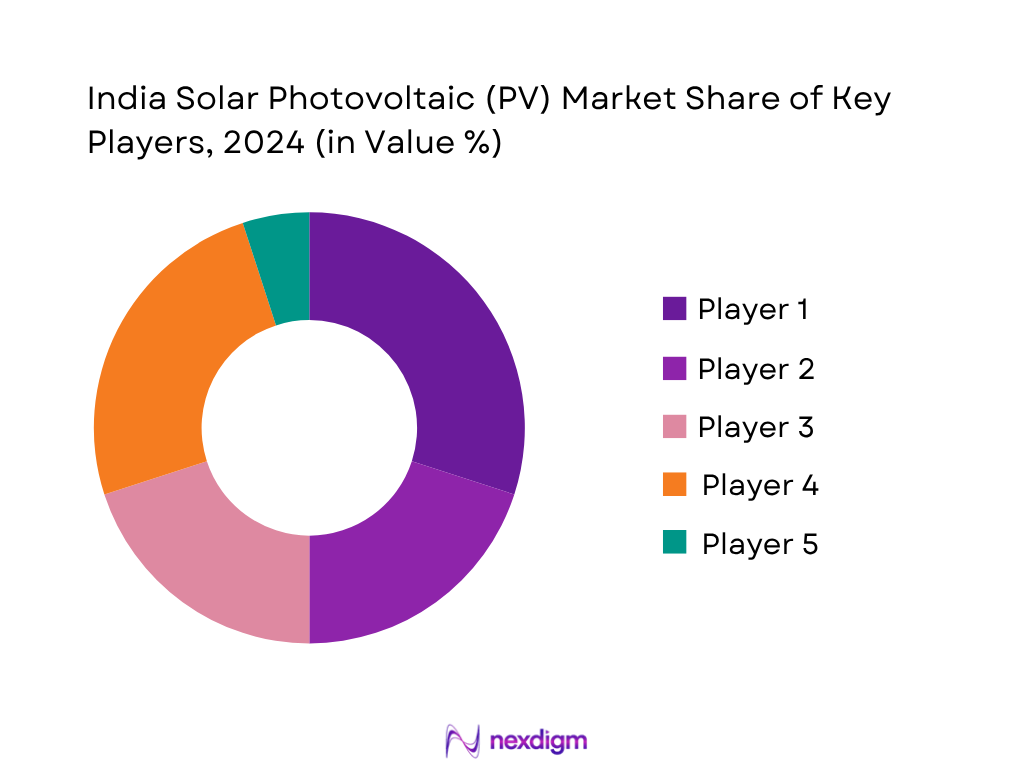
The India Solar PV market is led by several large integrated and regional players, including module makers, EPC firms, and developers. This consolidation reflects the major influence these companies hold in setting standards, pricing, and deployment scale.
| Company | Establishment Year | Headquarters | Solar Module Manufacturing Capacity (GW) | Utility‑scale Projects Commissioned (MW) | Rooftop Installations (MW) | State Presence Coverage | Business Model (EPC / IPP) | PLI Scheme Participation |
| Adani Solar | 2015 | Ahmedabad, Gujarat | – | – | – | – | – | – |
| Tata Power Solar | 1989 | Delhi | – | – | – | – | – | – |
| Vikram Solar | 2006 | Kolkata | – | – | – | – | – | – |
| Waaree Energies | 1989 | Mumbai | – | – | – | – | – | – |
| Azure Power | 2008 | Gurugram, Haryana | – | – | – | – | – | – |
India Solar Photovoltaic (PV) Market Analysis
Growth Drivers
National Solar Mission and Renewable Targets
The country’s installed renewable power capacity reached 105,646 MW of solar as of March 2025, representing 22.6% of total installed generation of 467,885 MW. Under this initiative, allocation of solar tenders surged to over 69 GW of renewables (mostly solar) issued during fiscal 2023‑24 against the government‑mandated target of 50 GW, demonstrating accelerated deployment. This reflects strong public policy backing from the National Solar Mission and accelerated auction volumes. Further, non‑fossil generation capacity reached 228,276 MW (~48.7%) by March 2025, underlining renewable priority in energy planning. These precise figures demonstrate how policy‑driven tender volumes and rising renewable installed share combine to boost the solar PV sector.
Rise in Energy Demand and Peak Load Management
India’s national peak electricity load climbed from 148 GW in 2014 to 250 GW in 2024, a rise of 102 GW, driven by industrial expansion, higher residential/commercial appliance usage, and improved access to electricity. During May 2024, national grids handled record peaks of 246 million kW on May 29 and 250 million kW on May 30, sustaining performance under extreme heatwave conditions. In Delhi, peak demand hit 7,174 MW in May 2024 versus 5,953 MW in May 2023. Such demand spikes necessitate dispatchable renewable capacity, leading commercial and industrial users to adopt solar PV to flatten load curves and reduce reliance on costly peak power. These verified peak demand metrics reinforce ongoing energy stress and the logic behind solar uptake for peak load smoothing and grid reliability.
Market Challenges
Land Acquisition and Grid Infrastructure Bottlenecks
India faces major land acquisition hurdles for utility-scale solar. A high-profile example is a 100 MW solar project in Nandgaon that was halted due to local protests, illustrating how community resistance can block projects despite government support. India’s utility-scale tenders crossed 73 GW in 2024, yet about 38.3 GW (≈19%) of tendered capacity was cancelled or delayed due to lack of transmission readiness or land disputes. At present, solar capacity remains heavily concentrated in nine states (~90% of total), limiting regional diversity and grid resilience. Meanwhile, India’s grid infrastructure has not kept pace: interstate transmission corridors remain underdeveloped, leading to frequent curtailment of ready solar generation during peak periods. These fixed data points underscore how insufficient land access and grid constraints hinder timely project realization and optimal solar power utilization.
Delay in Subsidy Disbursements
Delays in subsidy payments have created cash-flow issues particularly for rooftop solar consumers. Under PM Surya Ghar Yojana in Tamil Nadu, ₹236 crore had been sanctioned by early 2024, but many applicants faced reapplication due to delayed disbursements. Similarly, open-access solar developers installing about 1.8 GW in Q1 2024 under favorable conditions underwent delays in accessing viability gap funding and net‑metering credits, impacting project financial closure. Government press releases confirm that subsidy delays in rooftop solar schemes remain common in multiple states, slowing installations and eroding buyer confidence. These documented subsidy payment bottlenecks across India reflect a structural challenge affecting deployment timelines and developer viability.
Market Opportunities
Solar-Wind Hybrid Projects
In 2024, hybrid tenders combining wind and solar (and often storage) accounted for over 36.5% of the 73 GW utility-scale renewable capacity tendered by MNRE, surpassing solar-only volumes. These hybrid projects capitalize on complementary generation profiles, with wind generation peaking during monsoon and solar in dry months. States like Rajasthan and Gujarat added over 1,068 MW and 1,500 MW respectively in combined capacity during early 2024, reflecting strong developer interest in hybrid models. Government agencies such as SECI floated bids for 2,000 MW of solar projects with integrated battery storage in mid‑2025, signaling increased policy push for hybrid + ESS tenders. The rising volume of hybrid project issuance and growing developer participation demonstrate ample opportunity for hybrid solar‑wind projects to stabilize generation and improve capacity utilization rates.
Green Hydrogen Backed by Solar
Although green hydrogen adoption remains nascent, India’s Ministry of Power and Niti Aayog have identified solar-powered electrolyser hubs as central to scaling up the sector. As of late 2024, India’s non‑fossil fuel capacity was 203 GW of ~452 GW total, with solar comprising ~92 GW operational plus ~48 GW under implementation. States with large solar parks (e.g., Gujarat, Karnataka, Andhra Pradesh) are being evaluated for integrating dedicated solar output for green hydrogen production. Although no large-scale commercial electrolyser facility is yet operational, pilot tenders have begun in 2025. The data on solar capacity scale and Government’s green hydrogen roadmap indicates a growing opportunity to tie solar PV generation with hydrogen production at scale, offering novel demand use-cases and improving load matching, particularly during mid-day solar peaks.
Future Outlook
Over the coming years, the India Solar PV market is poised for strong expansion, fueled by further declines in module costs, accelerating domestic manufacturing, and scheduled auctions under national solar targets. Policy momentum alongside emerging demand from industrial and institutional buyers continues to underpin long‑term growth. Forecasted CAGR is ~13.1% for the capacity side (GW) over 2024–2030 (based on volume growth), while the market value CAGR in USD is around 9.4% over the same period.
Major Players
- Adani Solar
- Tata Power Solar
- Vikram Solar
- Waaree Energies
- Azure Power
- Renew Power
- Jakson Group
- Goldi Solar
- ReNew Power
- Avaada Energy
- Rays Power Infra
- Sterling and Wilson Solar
- RenewSys
- Mahindra Susten
- EMMVEE Solar.
Key Target Audience
- Energy and infrastructure investors and venture capitalist firms
- Ministries of New & Renewable Energy (MNRE) and State Renewable Energy Agencies
- Power utilities and DISCOM strategy teams
- Renewable energy asset managers
- Industrial energy buyers and central procurement firms
- Solar EPC and project development decision units
- Module and cell manufacturing strategic planners
- Financial lenders underwriting solar PV projects
Research Methodology
Step 1: Identification of Key Variables
The initial phase builds a stakeholder ecosystem map covering MNRE, central/state RECs, major developers, manufacturers, DISCOMs, and industrial buyers. Desk research leverages proprietary and secondary databases to define metrics like capacity additions, plan pipelines, tariffs, and policy levers.
Step 2: Market Analysis and Construction
Historical data (2020–2023) on installed capacity (GW), value (USD billion), and segment performance (rooftop vs utility) are collated. Growth drivers, cost trends, and deployment mix are analyzed for accurate trend tracking.
Step 3: Hypothesis Validation and Expert Consultation
Forecasts and assumptions are validated through structured interviews (CATI) with developers, state RECs, and module manufacturers to gain operational insights and ensure alignment with industry realities.
Step 4: Research Synthesis and Final Output
Data is cross‑verified with major solar developers and manufacturers through direct interaction to confirm production capacities, PPA pricing, subsidy uptake, and pipeline status. This integration of bottom‑up and top‑down data ensures final report accuracy.
- Executive Summary
- Research Methodology
(Market Definitions and Assumptions, Abbreviations, Market Sizing Methodology, Primary and Secondary Research Approaches, Industry Expert Interviews, Market Forecasting Techniques, Limitations and Assumptions)
- Definition and Scope
- Market Genesis and Evolution
- Business Lifecycle Analysis
- Solar Energy Value Chain (Polysilicon–Wafer–Cell–Module–System–Services)
- Power Purchase Mechanism (Open Access, Captive, Net Metering, Third-party PPA)

- Growth Drivers
National Solar Mission and Renewable Targets
Rise in Energy Demand and Peak Load Management
Lower Cost of Solar Components
Favorable Regulatory and Tariff Structures
Demand from Industrial and Commercial Decarbonization Goals - Market Challenges
Land Acquisition and Grid Infrastructure Bottlenecks
Delay in Subsidy Disbursements
Module Quality and Performance Degradation
Import Dependency for Cells and Modules
Lack of Storage Integration with Solar Projects - Market Opportunities
Solar-Wind Hybrid Projects
Green Hydrogen Backed by Solar
Solar in Smart Cities and EV Charging
Export of Indian-made PV Modules
Solar Integration in Data Centers and Digital Infrastructure - Market Trends
Bifacial Modules and Tracker Technologies
Domestic Manufacturing Boost via PLI Schemes
Solar-as-a-Service Business Models
Blockchain in Solar Energy Trading
Surge in Floating Solar Installations - Government Policy and Regulation
ALMM Mandate
PM-KUSUM
State-wise Net Metering Regulations
Open Access Solar Policy
Import Duties and BIS Standards - SWOT Analysis
- Stakeholder Ecosystem
- Porter’s Five Forces Analysis
- Industry Value Addition and Margin Mapping
- By Value (USD Million), 2019-2024
- By Installed Capacity (MW), 2019-2024
- By Units Generated (GWh), 2019-2024
- By Technology (In Value %)
Monocrystalline Silicon
Polycrystalline Silicon
Thin-Film (CdTe, CIGS, a-Si)
Passivated Emitter and Rear Cell (PERC)
Heterojunction (HJT) - By Deployment Mode (In Value %)
Utility-Scale
Rooftop (Residential, Commercial, Industrial)
Off-grid and Microgrid Systems
Floating Solar
Hybrid PV-Diesel Systems - By End-Use Industry (In Value %)
Residential
Commercial Buildings
Industrial Facilities
Agriculture (Solar Pumps, Cold Storage)
Government and Public Sector (Railways, Defense, Public Lighting) - By Region (In Value %)
Northern Region
Southern Region
Western Region
Eastern Region
North-Eastern Region - By Distribution Channel (In Value %)
EPC Contractors
OEMs and Module Manufacturers
Government Tenders
Channel Partners and Distributors
Direct-to-Customer (D2C)
- Market Share of Major Players (By Value/Capacity/Installations)
- Cross Comparison Parameters (Company Overview, Solar Module Manufacturing Capacity, Projects Commissioned (MW), Project Pipeline (MW), Key Clients and Sectors, Presence Across States, EPC vs IPP Model, PPA Terms & Duration)
- SWOT Analysis of Key Players
- Procurement Cost Comparison (Per Watt Basis)
- Detailed Profiles of Major Companies:
Adani Solar
Tata Power Solar
Vikram Solar
Renew Power
Waaree Energies
Azure Power
Jakson Group
Goldi Solar
Amp Energy
Avaada Energy
Rays Power Infra
Sterling and Wilson Solar
RenewSys
NHPC (Solar Division)
Harsha Abakus Solar
- Decision-making Cycle of Industrial and Institutional Buyers
- Return on Investment and Payback Period Trends
- Financing Models (CAPEX, OPEX, RESCO)
- Regulatory Adherence and Licensing Procedures
- Customer Pain Point Mapping
- By Value, 2025-2030
- By Installed Capacity, 2025-2030
- By Units Generated, 2025-2030
 Market Outlook to 2030")
 Market Outlook to 2030")
 Market Outlook to 2030")
 Market Outlook to 2030")
 Market Outlook to 2030") Request a Sample
Request a Sample Market Outlook to 2030") Ask for Customization
Ask for Customization Market Outlook to 2030") Get a Quote
Get a Quote Market Outlook to 2030") Enquire Now
Enquire Now Market Outlook to 2030")