
 Download PDF
Market Overview
The India Used Agricultural Implements market current size stands at around USD ~ million, reflecting a structurally significant secondary equipment ecosystem serving value-sensitive farm operators. Demand is sustained by replacement cycles for aging implements, informal resale networks, and rising availability of refurbished machinery through organized dealer formats. Transaction flows are driven by affordability constraints, limited access to new equipment financing, and the need to optimize utilization of mechanical assets across seasonal farming operations, particularly for tractors, tillage tools, and harvesting attachments.
Regional demand concentration is strongest across high-mechanization belts in Punjab, Haryana, western Uttar Pradesh, Maharashtra, Karnataka, and Tamil Nadu, supported by dense dealer networks, refurbishment clusters, and higher equipment utilization intensity. Market depth is reinforced by logistics access, proximity to spare parts ecosystems, and state-level support for mechanization adoption. Districts with custom hiring centers and active farmer producer organizations exhibit faster turnover of used implements due to institutional procurement and coordinated demand aggregation.

Market Segmentation
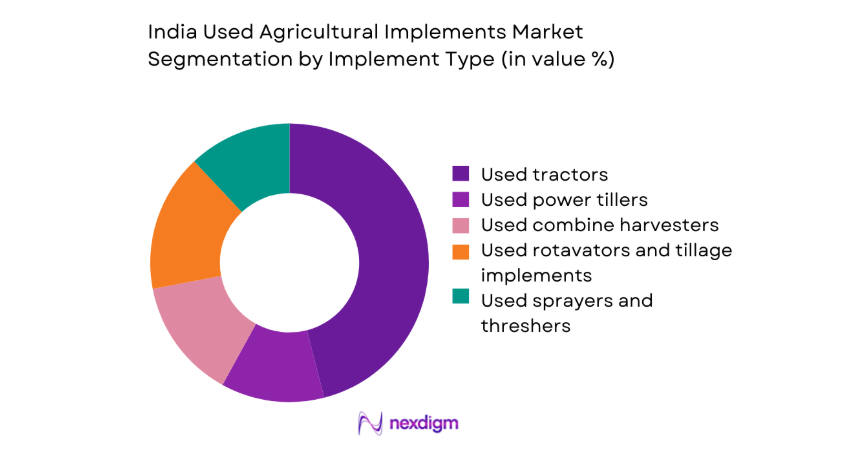
By Implement Type
Used tractors dominate transaction value due to multipurpose utility across tillage, haulage, and PTO-driven operations, creating steady resale liquidity. Harvesting and post-harvest equipment show cyclical demand aligned to cropping intensity and contractor utilization, while soil preparation implements move faster in regions with double-cropping patterns. The refurbishability of tractors and rotavators supports higher resale confidence, whereas sprayers and threshers exhibit shorter refurbishment cycles. Replacement demand is driven by maintenance economics, engine hour thresholds, and compliance with emission upgrades in organized channels.
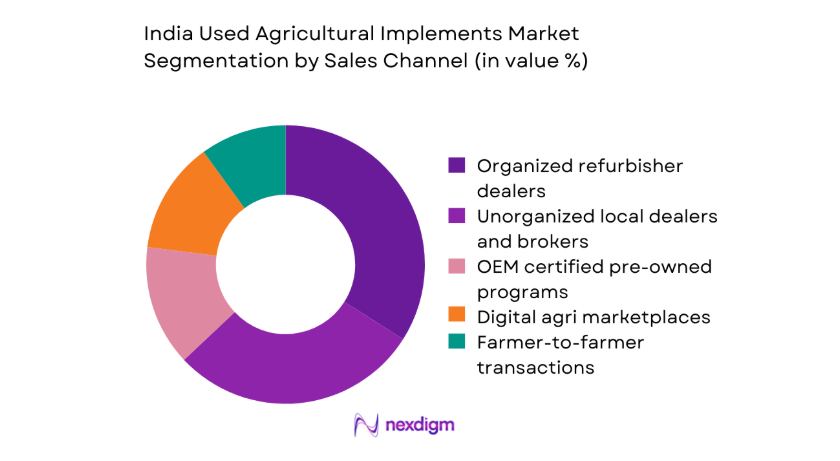
By Sales Channel
Organized refurbisher dealers command higher buyer trust through grading standards, limited warranties, and financing facilitation, driving dominance in higher-ticket categories. Unorganized brokers remain relevant in rural mandis for quick liquidity but face credibility constraints. OEM-certified pre-owned programs gain traction where service infrastructure is dense. Digital marketplaces accelerate discovery and price transparency but rely on offline fulfillment and inspection. Farmer-to-farmer transactions persist in clustered geographies with strong social networks and localized repair ecosystems, influencing faster deal closures.
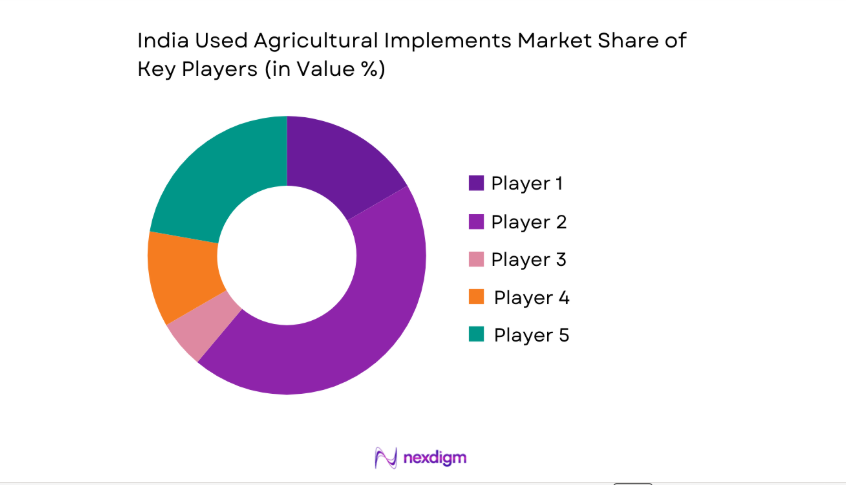
Competitive Landscape
The competitive environment is fragmented, shaped by organized refurbishers, OEM-backed pre-owned programs, and digital platforms integrating discovery with offline service. Differentiation centers on inspection rigor, refurbishment depth, financing access, and after-sales support coverage.
| Company Name | Establishment Year | Headquarters | Formulation Depth | Distribution Reach | Regulatory Readiness | Service Capability | Channel Strength | Pricing Flexibility |
| Mahindra Tractors | 1982 | Mumbai | ~ | ~ | ~ | ~ | ~ | ~ |
| TAFE Tractors | 1960 | Chennai | ~ | ~ | ~ | ~ | ~ | ~ |
| Sonalika International | 1995 | Hoshiarpur | ~ | ~ | ~ | ~ | ~ | ~ |
| John Deere India | 1998 | Pune | ~ | ~ | ~ | ~ | ~ | ~ |
| New Holland Agriculture India | 1998 | Noida | ~ | ~ | ~ | ~ | ~ | ~ |
India Used Agricultural Implements Market Analysis
Growth Drivers
Rising mechanization demand among smallholders
Rising mechanization adoption among smallholders is supported by institutional credit expansion, rural electrification coverage reaching 100 villages in targeted blocks, and road connectivity upgrades spanning 1200 kilometers across agrarian districts. Tractor density increased across high-intensity cropping belts, while mechanized operations per season expanded due to labor availability constraints reported by 4 state departments. Equipment sharing through 3500 custom hiring centers improved access for fragmented landholdings. Irrigated acreage expanded across canal command areas by 180 hectares in select districts, reinforcing demand for tillage and haulage capacity during peak cycles.
High price sensitivity favoring pre-owned equipment
High price sensitivity among marginal and small farmers is reinforced by tightening disposable incomes during volatile monsoon cycles affecting 6 agro-climatic zones. Formal credit disbursements through rural lending branches increased by 4200 accounts across priority sectors, while loan ticket sizes remained constrained, shifting preference toward pre-owned assets. Repair workshops numbered 870 across district clusters, enabling lifecycle extension for used equipment. Seasonal migration reduced available labor by 9000 workers in peak months, elevating reliance on affordable mechanization options for timely operations across sowing and harvest windows.
Challenges
Inconsistent quality and refurbishment standards
Inconsistent refurbishment standards persist due to uneven certification adoption across 11 major agricultural states, with inspection protocols implemented by only 240 organized outlets. Absence of uniform grading leads to information asymmetry, increasing transaction risk for buyers. Workshop capacity varies widely, with 3 to 7 technicians per facility limiting turnaround times during peak seasons. Spare part authenticity issues were flagged by 18 district-level enforcement drives, constraining confidence. Logistics bottlenecks across 260 kilometers of secondary roads delay inter-district movement, exacerbating downtime during narrow sowing and harvesting windows.
Limited availability of spare parts for older models
Spare part constraints for legacy models persist as component production cycles shorten, with 14 discontinued engine variants affecting serviceability. Authorized parts depots are concentrated in 52 urban nodes, leaving peripheral blocks underserved. Inventory replenishment cycles extend to 21 days during peak seasons, increasing equipment idle time. Informal parts circulation creates fitment risks, evidenced by 320 reported breakdown incidents logged by district agriculture offices. Limited technician training coverage across 28 training centers constrains diagnostics for older hydraulics and transmission systems, elevating lifecycle maintenance uncertainty for used equipment buyers.
Opportunities
OEM-certified pre-owned program expansion
OEM-certified pre-owned expansion is supported by dealership network densification across 640 rural outlets and technician skilling programs training 2800 personnel. Structured inspection protocols aligned with emission compliance enable safer resale of refurbished units. Integration with financing channels improved approval throughput across 1900 rural branches, reducing transaction friction. Telematics retrofitting pilots across 420 units enhanced condition transparency, improving buyer confidence. Institutional procurement by 260 custom hiring centers creates anchor demand, enabling faster inventory rotation and standardized refurbishment cycles, strengthening formal channel penetration in under-served districts.
Aggregation of used equipment through digital platforms
Digital aggregation opportunities expand as smartphone penetration surpassed 2 billion connections nationwide and 4G coverage reached 95 percent of rural blocks, enabling discovery and price benchmarking. Platform-led inspections standardized across 180 service nodes reduce information asymmetry. Integrated logistics partners operate across 72 hubs, shortening fulfillment cycles. Embedded financing onboarding digitized 6000 applications in recent cycles, improving access for remote buyers. Data-led matching aligns seasonal demand peaks across 12 crop calendars, enabling cross-regional inventory balancing and improving asset utilization rates within organized secondary markets.
Future Outlook
The market trajectory will be shaped by formalization of refurbishment standards, deeper financing integration, and expansion of organized channels into under-penetrated agrarian districts. Policy support for mechanization and digital infrastructure will reinforce discovery and trust. Demand patterns will increasingly align with custom hiring center expansion and regional crop cycles, strengthening secondary market liquidity through structured resale pathways.
Major Players
- Mahindra Tractors
- TAFE Tractors
- Sonalika International
- John Deere India
- New Holland Agriculture India
- Swaraj Tractors
- Kubota Agricultural Machinery India
- Tractors and Farm Equipment Limited
- AgriBazaar
- Mahindra First Choice Wheels
- BigHaat
- DeHaat
- Kisaan Parivar
- Gramophone
- EM3 Agri Services
Key Target Audience
- Farm equipment dealers and refurbishers
- Custom hiring center operators
- Farmer producer organizations and cooperatives
- Rural NBFCs and agricultural lenders
- Digital agri marketplace operators
- Investments and venture capital firms
- Government and regulatory bodies with agency names such as Ministry of Agriculture and Farmers Welfare and State Agriculture Departments
- Agri logistics and warehousing operators
Research Methodology
Step 1: Identification of Key Variables
Core variables covered implement categories, refurbishment depth, dealer network density, service coverage, and financing access. State-level mechanization policies and compliance requirements were mapped to identify regulatory friction points.
Supply chain nodes, logistics corridors, and spare parts availability were defined to scope operational constraints.
Step 2: Market Analysis and Construction
Primary insights were synthesized from dealer interviews, refurbisher audits, and service center capacity mapping. Secondary datasets from institutional records and mechanization programs informed demand intensity by district clusters.
Scenario frameworks linked cropping intensity with seasonal equipment utilization cycles to construct demand pathways.
Step 3: Hypothesis Validation and Expert Consultation
Hypotheses were validated through consultations with state mechanization officers, service technicians, and financing partners. Field checks across refurbishment hubs assessed grading consistency and inspection rigor.Cross-validation ensured alignment between logistics reach, service readiness, and buyer risk tolerance.
Step 4: Research Synthesis and Final Output
Findings were triangulated across supply, demand, and policy lenses to ensure coherence. Insights were structured into actionable themes for channel strategy, service design, and financing integration. Outputs were reviewed for consistency, applicability across regions, and strategic relevance for stakeholders.
- Executive Summary
- Research Methodology (Market Definitions and used farm implement classification, Dealer and refurbisher interviews across key agri states, Farmer surveys by landholding and crop pattern, Price benchmarking across mandis and digital marketplaces, Trade flow analysis of inter-state used equipment movement, Financing and NBFC data triangulation, Regulatory and RTO compliance review)
- Definition and Scope
- Market evolution
- Usage and ownership pathways
- Ecosystem structure
- Supply chain and channel structure
- Regulatory environment

- Growth Drivers
Rising mechanization demand among smallholders
High price sensitivity favoring pre-owned equipment
Expansion of custom hiring centers
Increasing availability of organized refurbishers
Growth of digital agri-commerce platforms
Improving rural credit access through NBFCs - Challenges
Inconsistent quality and refurbishment standards
Limited availability of spare parts for older models
Fragmented unorganized dealer network
Financing constraints for informal buyers
Trust deficit in peer-to-peer transactions
Regulatory and RTO transfer complexities - Opportunities
OEM-certified pre-owned program expansion
Aggregation of used equipment through digital platforms
Structured refurbishment and warranty offerings
Leasing and pay-per-use models for implements
Penetration into eastern and north-eastern states
Integration with custom hiring center networks - Trends
Formalization of used equipment retail channels
Data-led pricing and condition grading
Growth of online discovery with offline fulfillment
Bundled financing and insurance offerings
Increased demand for mid-HP tractors
Refurbishment hubs near agri clusters - Government Regulations
- SWOT Analysis
- Stakeholder and Ecosystem Analysis
- Porter’s Five Forces Analysis
- Competition Intensity and Ecosystem Mapping
- By Value, 2020–2025
- By Volume, 2020–2025
- By Installed Base, 2020–2025
- By Average Selling Price, 2020–2025
- By Implement Type (in Value %)
Used tractors
Used power tillers
Used combine harvesters
Used seed drills and planters
Used rotavators and tillage implements
Used sprayers and crop protection equipment
Used threshers and balers - By Power Rating (in Value %)
Below 30 HP
31–50 HP
51–70 HP
Above 70 HP - By Sales Channel (in Value %)
Organized refurbisher dealers
Unorganized local dealers and brokers
OEM certified pre-owned programs
Digital agri marketplaces
Farmer-to-farmer transactions - By Buyer Farm Size (in Value %)
Marginal farmers
Small farmers
Medium farmers
Large farmers and estates
Custom hiring centers and FPOs - By Geography (in Value %)
North India
West India
South India
East and North-East India
- Market structure and competitive positioning
Market share snapshot of major players - Cross Comparison Parameters (geographic reach, refurbishment capability, inventory breadth, pricing transparency, financing tie-ups, warranty coverage, digital presence, service network)
- SWOT Analysis of Key Players
- Pricing and Commercial Model Benchmarking
- Detailed Profiles of Major Companies
Mahindra Tractors
TAFE Tractors
Sonalika International
John Deere India
New Holland Agriculture India
Swaraj Tractors
Kubota Agricultural Machinery India
Tractors and Farm Equipment Limited
AgriBazaar
Mahindra First Choice Wheels
BigHaat
DeHaat
Kisaan Parivar
Gramophone
EM3 Agri Services
- Demand and utilization drivers
- Procurement and tender dynamics
- Buying criteria and vendor selection
- Budget allocation and financing preferences
- Implementation barriers and risk factors
- Post-purchase service expectations
- By Value, 2026–2035
- By Volume, 2026–2035
- By Installed Base, 2026–2035
- By Average Selling Price, 2026–2035


 Request a Sample
 Ask for Customization
 Get a Quote
 Enquire Now