
 Download PDF
 Download PDF
Market Overview
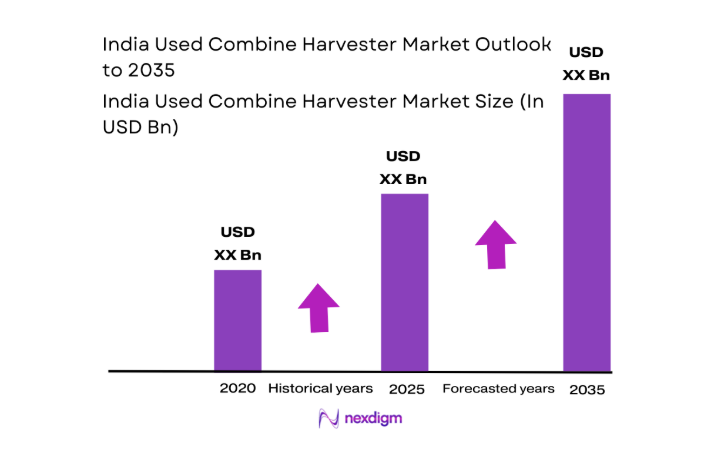
The India Used Combine Harvester market current size stands at around USD ~ million, shaped by persistent demand for cost-efficient mechanization among small and mid-sized farm operators. Transaction activity is driven by seasonal harvesting cycles, resale of contractor fleets, and equipment life extension through refurbishment. Price discovery remains fragmented due to informal resale channels, while certified pre-owned programs are emerging. Financing access influences purchase timing, and service availability affects utilization continuity. Supply availability is constrained by model obsolescence and variable machine condition.
Northern agrarian belts anchored by Punjab, Haryana, and western Uttar Pradesh dominate transactional density due to high cereal cropping intensity and mechanization maturity. Western regions around Maharashtra and Madhya Pradesh show growing activity linked to custom hiring centers and inter-state fleet movement. Southern clusters across Telangana and Andhra Pradesh benefit from paddy-focused demand and organized dealer networks. Eastern corridors, including Bihar and West Bengal, are constrained by fragmented landholdings, weaker service reach, and limited refurbishment ecosystems, shaping slower formal market penetration.
Market Segmentation
By Combine Type
Self-propelled and multi-crop used combine harvesters dominate transaction flows due to adaptability across wheat, paddy, and maize cycles, reducing idle periods for owners. Track-type units show rising interest in waterlogged paddy belts where terrain constraints favor traction stability. Mini combines are increasingly adopted by smallholders and custom hiring centers serving fragmented plots, supported by easier transportability and lower operational complexity. Buyers prioritize versatility, serviceability, and parts availability over brand lineage. Inter-state redeployment of self-propelled units enhances liquidity during peak seasons, while contractors rotate fleets to optimize uptime. Refurbishment programs further elevate preference for mainstream types with standardized components and technician familiarity.

By Sales Channel
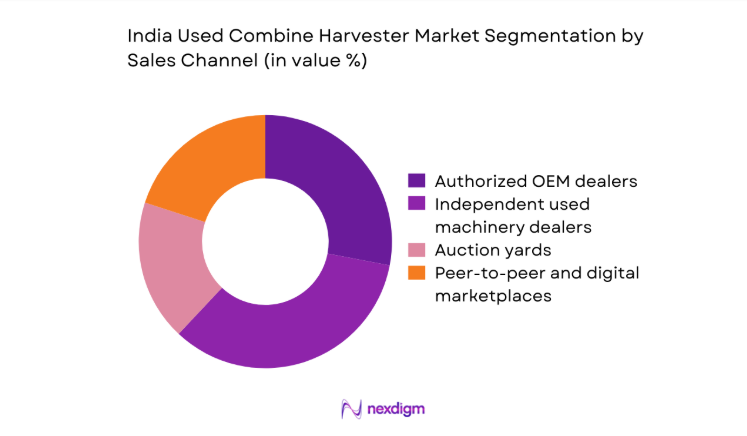
Authorized dealers and organized used machinery dealers account for growing transaction formalization through refurbishment, basic warranties, and financing tie-ups. Auction yards facilitate bulk liquidation by large contractors, improving supply visibility during post-harvest cycles. Peer-to-peer and digital marketplaces enable pan-regional discovery, particularly for inter-state fleet movement, but face trust and condition-verification gaps. Informal brokers continue to influence rural discovery through localized networks, though documentation and after-sales support remain weak. Channel preference hinges on assurance of machine condition, service access, and financing facilitation. Organized channels are increasingly bundling service contracts to reduce downtime risks for buyers.
Competitive Landscape
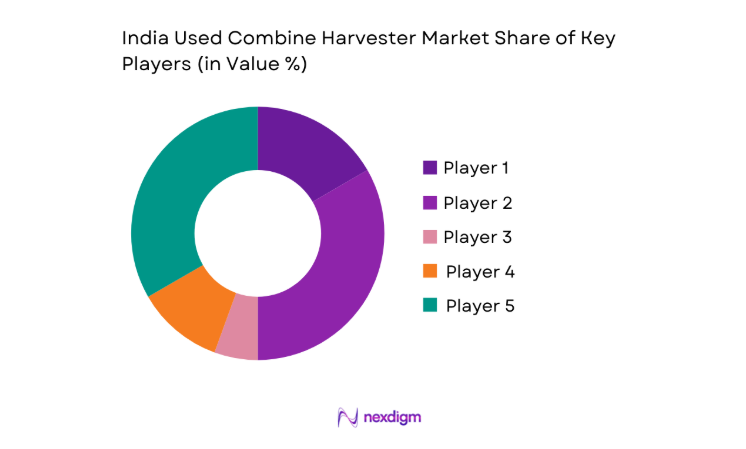
The competitive environment is shaped by organized dealer networks, refurbishment capability, service reach across agrarian belts, and financing partnerships. Differentiation centers on machine certification processes, spare parts availability, and turnaround time for seasonal readiness, with channel strength influencing transaction velocity during peak harvest windows.
| Company Name | Establishment Year | Headquarters | Formulation Depth | Distribution Reach | Regulatory Readiness | Service Capability | Channel Strength | Pricing Flexibility |
| Mahindra & Mahindra | 1945 | Mumbai, India | ~ | ~ | ~ | ~ | ~ | ~ |
| TAFE | 1960 | Chennai, India | ~ | ~ | ~ | ~ | ~ | ~ |
| John Deere India | 1998 | Pune, India | ~ | ~ | ~ | ~ | ~ | ~ |
| CNH Industrial India | 1999 | Gurugram, India | ~ | ~ | ~ | ~ | ~ | ~ |
| Kubota Agricultural Machinery India | 2008 | Noida, India | ~ | ~ | ~ | ~ | ~ | ~ |
India Used Combine Harvester Market Analysis
Growth Drivers
Mechanization adoption among small and marginal farmers
Small and marginal holdings below 2 hectares increased operational reliance on shared machinery during 2024 and 2025, driven by rural wage pressures recorded in state labor bulletins showing monthly indices above 110 across agrarian districts. Custom hiring center registrations expanded across 18 states, while rural electrification coverage exceeded 97 settlements, enabling workshop proliferation. Public farm mechanization schemes reported 42 district-level equipment clusters operational in wheat belts, shortening access distance. Seasonal harvesting windows compressed to 14 days in several regions, intensifying demand for readily available machines. Migration outflows from agrarian blocks surpassed 120000 workers in peak months, reinforcing mechanization uptake.
Rising labor shortages during peak harvesting seasons
Peak-season labor availability declined across 2024 and 2025 as construction employment absorbed 310000 rural workers in northern corridors, according to state employment exchanges. Harvesting windows for wheat narrowed to 12 days in high-yield districts due to weather volatility, raising urgency for machine availability. Inter-state movement restrictions during episodic outbreaks disrupted seasonal labor flows across 7 border districts. Rural male participation rates in on-farm labor fell to 48 in multiple blocks, while female labor availability fluctuated during school examination months. These dynamics elevated demand for used combines to ensure timely harvesting and reduce post-harvest losses measured at 6 quintals per hectare in flood-prone tracts.
Challenges
Limited availability of quality-assured used machines
Supply of quality-assured used combines tightened in 2024 and 2025 as contractor fleet replacement cycles extended beyond 6 years amid credit constraints. Workshop capacity for certified refurbishment remained limited to 240 facilities nationwide, constraining throughput during peak turnover months. Machine downtime due to component fatigue rose to 9 days per season in older units, increasing buyer risk. Inter-state transfers faced documentation delays averaging 21 days, affecting seasonal readiness. Parts discontinuation affected 17 legacy models, elevating cannibalization practices. Absence of standardized inspection protocols resulted in uneven condition grading across 5 major agrarian clusters, dampening buyer confidence.
High refurbishment and maintenance costs for older units
Refurbishment lead times averaged 28 days in 2024 and 2025 due to technician shortages, with certified mechanics density at 1 per 320 machines across wheat belts. Component replacement cycles for threshing drums shortened to 18 months in high-intensity usage zones, increasing maintenance frequency. Fuel injector and hydraulic failures rose by 14 incidents per 100 machines annually in flood-affected regions. Logistics disruptions across 4 eastern corridors delayed parts delivery beyond 9 days during monsoon periods. Workshop electricity outages exceeded 22 hours monthly in rural grids, slowing repair throughput and increasing operational uncertainty for buyers dependent on seasonal readiness.
Opportunities
Organized dealer-led refurbishment and warranty programs
Dealer-led certification can scale rapidly as 2024 registrations of organized machinery dealers expanded across 64 new district nodes. Training capacity for technicians increased through 12 regional skill centers, producing 840 certified mechanics in 2025. Digital service logs now cover 19000 machines, enabling transparent condition histories and predictive maintenance scheduling. Warranty-backed resale reduced first-season breakdowns by 7 incidents per 100 machines in pilot districts. Institutional credit onboarding for refurbished units improved approval turnaround to 10 working days. Integration with custom hiring centers across 9 states supports fleet pooling, enhancing seasonal availability and stabilizing utilization cycles.
Digital marketplaces enabling pan-India equipment discovery
Digital discovery platforms expanded listings coverage across 23 states during 2024 and 2025, with verified listings exceeding 18000 units. Geotagged inventory reduced buyer search radius from 210 kilometers to 75 kilometers in pilot corridors. Integrated logistics coordination shortened inter-state transfers to 8 days on average. Remote inspection protocols using video audits lowered pre-purchase visits by 3 trips per transaction. Digital documentation reduced registration processing to 5 working days in compliant states. Payment escrow mechanisms improved transaction completion rates to 92 in trial clusters, strengthening buyer confidence and accelerating liquidity across seasonal demand peaks.
Future Outlook
The market is expected to formalize steadily through certified refurbishment programs, wider digital discovery, and expanding service networks across emerging agrarian corridors. Policy alignment around mechanization support and financing facilitation will improve transaction confidence. Inter-state fleet rotation is likely to deepen as logistics and documentation streamline. Adoption momentum will strengthen in eastern and central regions as service density improves. Technology-enabled inspection and service records will shape buyer preference.
Major Players
- Mahindra & Mahindra
- TAFE
- John Deere India
- CNH Industrial India
- Kubota Agricultural Machinery India
- Preet Agro Industries
- Sonalika (International Tractors)
- Kartavya Agro Industries
- Dasmesh Mechanical Works
- Balkar Agro Industries
- Agroking Tractors & Implements
- Fieldking (Beri Udyog)
- New Holland Agriculture India
- CLAAS India
- VST Tillers Tractors
Key Target Audience
- Custom hiring center operators
- Farm equipment rental aggregators
- Large agricultural contractors
- Farmer Producer Organizations
- Cooperative societies and procurement federations
- State agriculture departments and regional transport offices
- Public sector rural development agencies
- Investments and venture capital firms
Research Methodology
Step 1: Identification of Key Variables
Primary variables included equipment age, condition grading, refurbishment cycles, service network density, financing access, and inter-state transfer frictions. Secondary variables captured seasonal demand windows, labor availability signals, and cropping intensity patterns across agrarian corridors.
Step 2: Market Analysis and Construction
Transaction flows were mapped across organized dealers, auctions, and digital channels. Supply pipelines from contractor fleet rotations were aligned with refurbishment throughput and service readiness to construct seasonal availability scenarios.
Step 3: Hypothesis Validation and Expert Consultation
Field consultations with service technicians, dealer managers, and custom hiring center operators validated downtime drivers, parts constraints, and financing frictions. Institutional inputs corroborated documentation timelines and compliance bottlenecks.
Step 4: Research Synthesis and Final Output
Findings were synthesized into demand-supply linkages, regional dynamics, and operational constraints. Scenario narratives were constructed to reflect evolving formalization pathways and service ecosystem maturation.
- Executive Summary
- Research Methodology (Market Definitions and used combine harvester classification by type and age, Dealer inventory audits and refurbishment pipeline tracking, Farmer and FPO primary interviews across rice-wheat belts, Auction yard and resale platform transaction analysis, State-wise RTO registration and deregistration mapping, OEM service network and parts availability assessment, Financing and NBFC resale credit flow analysis)
- Definition and Scope
- Market evolution
- Usage and ownership pathways
- Ecosystem structure
- Supply chain and channel structure
- Regulatory environment

- Growth Drivers
Mechanization adoption among small and marginal farmers
Rising labor shortages during peak harvesting seasons
Lower capital outlay versus new combine harvesters
Expansion of custom hiring centers and rental operators
Government support for farm mechanization financing
High resale liquidity in cereal-producing belts - Challenges
Limited availability of quality-assured used machines
High refurbishment and maintenance costs for older units
Spare parts constraints for discontinued models
Informal resale market and price opacity
Financing constraints for second-hand equipment buyers
Regulatory variations in inter-state equipment movement - Opportunities
Organized dealer-led refurbishment and warranty programs
Digital marketplaces enabling pan-India equipment discovery
Growth of custom hiring centers in eastern and central India
Retrofit and upgrade services for fuel efficiency and safety
OEM-certified pre-owned programs
Bundled financing and insurance for used equipment - Trends
Shift toward mini and track-type combines in fragmented landholdings
Rising preference for younger used machines with service records
Seasonal inventory pooling by dealers across states
Integration of telematics and condition monitoring retrofits
Growth of auction-based liquidation by large contractors
Increasing role of NBFCs in used farm equipment finance - Government Regulations
- SWOT Analysis
- Stakeholder and Ecosystem Analysis
- Porter’s Five Forces Analysis
- Competition Intensity and Ecosystem Mapping
- By Value, 2020–2025
- By Shipment Volume, 2020–2025
- By Active Systems, 2020–2025
- By Average Selling Price, 2020–2025
- By Combine Type (in Value %)
Self-propelled combine harvesters
Track-type combine harvesters
Mini combine harvesters
Multi-crop combine harvesters - By Crop Application (in Value %)
Wheat harvesting
Paddy harvesting
Maize harvesting
Pulses and oilseeds harvesting
Multi-crop usage - By Power Rating (in Value %)
Below 60 HP
60–100 HP
Above 100 HP - By Machine Age (in Value %)
Less than 3 years
3–5 years
6–8 years
Above 8 years - By Sales Channel (in Value %)
Authorized OEM dealers
Independent used machinery dealers
Auction yards
Peer-to-peer and digital marketplaces - By Geography (in Value %)
North India
West India
South India
East India
Central India
- Market structure and competitive positioning
Market share snapshot of major players - Cross Comparison Parameters (brand presence, refurbishment capability, service network reach, financing tie-ups, warranty offerings, inventory depth, geographic coverage, pricing transparency)
- SWOT Analysis of Key Players
- Pricing and Commercial Model Benchmarking
- Detailed Profiles of Major Companies
Mahindra & Mahindra
TAFE
John Deere India
CNH Industrial India
Kubota Agricultural Machinery India
Preet Agro Industries
Sonalika (International Tractors)
Kartavya Agro Industries
Dasmesh Mechanical Works
Balkar Agro Industries
Agroking Tractors & Implements
Fieldking (Beri Udyog)
New Holland Agriculture India
CLAAS India
VST Tillers Tractors
- Demand and utilization drivers
- Procurement and tender dynamics
- Buying criteria and vendor selection
- Budget allocation and financing preferences
- Implementation barriers and risk factors
- Post-purchase service expectations
- By Value, 2026–2035
- By Shipment Volume, 2026–2035
- By Active Systems, 2026–2035
- By Average Selling Price, 2026–2035


 Request a Sample
 Ask for Customization
 Get a Quote
 Enquire Now