
 Download PDF
 Download PDF
Market Overview
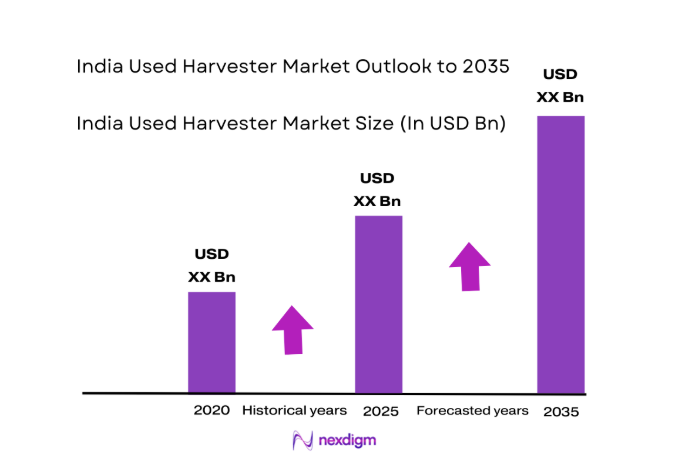
The India Used Harvester market current size stands at around USD ~ million and reflects steady activity across refurbishment, resale, and dealer-mediated trade. Demand is shaped by replacement cycles of aging machines, liquidity constraints among smallholders, and the economics of custom hiring fleets. Transaction values remain masked at USD ~ million, with financing and warranty extensions influencing buyer confidence. Channel margins and refurbishment economics remain opaque, with commercial terms commonly quoted as USD ~ million across regional dealer networks and auction-mediated transactions.
Activity concentrates in Punjab, Haryana, western Uttar Pradesh, Madhya Pradesh, Telangana, and Andhra Pradesh, supported by dense service workshops, parts availability, and established custom hiring centers. Proximity to grain mandis, repair clusters, and transport corridors lowers downtime risks. Southern clusters benefit from multi-crop harvesting calendars and dealer maturity, while western regions leverage refurbisher ecosystems and inter-state movement corridors. Policy-backed mechanization centers and cooperative hiring models further anchor demand concentration around high-intensity cropping belts.
Market Segmentation
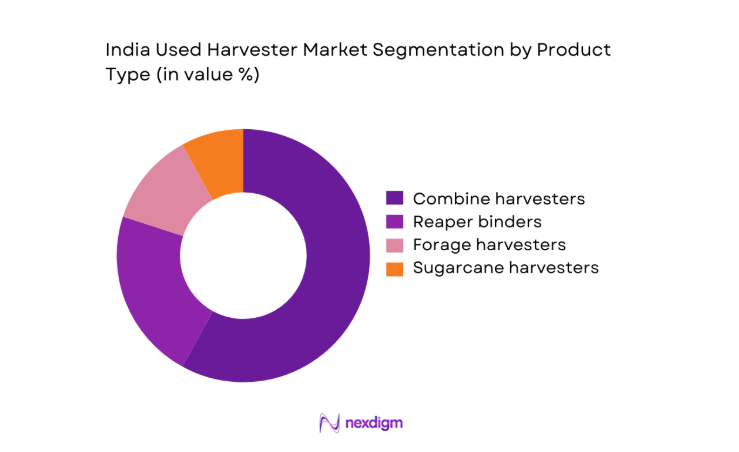
By Product Type
Used combine harvesters dominate due to multi-crop utility, high seasonal utilization, and superior resale liquidity through dealer networks. Reaper binders remain relevant for small parcels and hill-edge geographies where maneuverability and lower operating complexity matter. Forage harvesters see localized demand from dairy-linked belts with consistent fodder cycles, while sugarcane harvesters transact mainly within cane-intensive clusters supported by mill-linked contractors. Availability of certified refurbishment, spare parts interchangeability, and operator familiarity reinforce product-type dominance. Buyers prioritize machines with service histories, predictable uptime, and compatibility with regional crop calendars, which structurally advantages combines in high-throughput corridors.
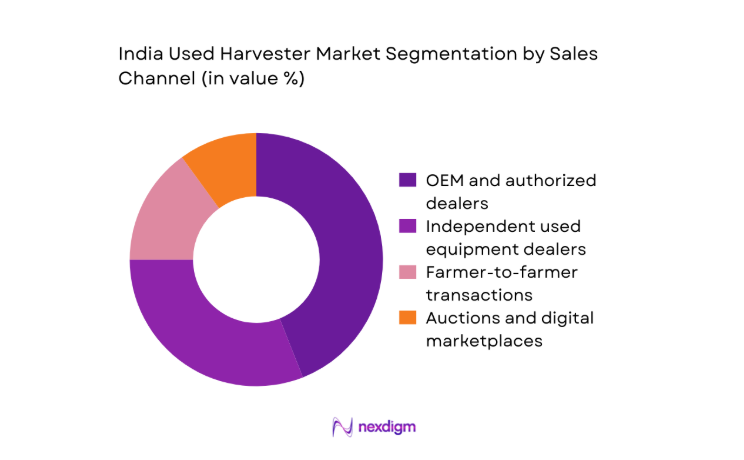
By Sales Channel
OEM-authorized dealers lead due to inspection protocols, refurbishment standards, and bundled service commitments that reduce operational risk for buyers. Independent dealers thrive in price-sensitive belts by aggregating inventory and enabling faster inter-state movement. Farmer-to-farmer transactions persist where social trust and proximity reduce search costs, though variability in machine condition limits scale. Auctions and digital marketplaces are expanding reach, improving price discovery, and accelerating turnover, particularly for fleet upgrades by custom hiring operators. Channel dominance is shaped by financing access, warranty availability, and logistics readiness, with formal channels gaining share where downtime penalties are highest.
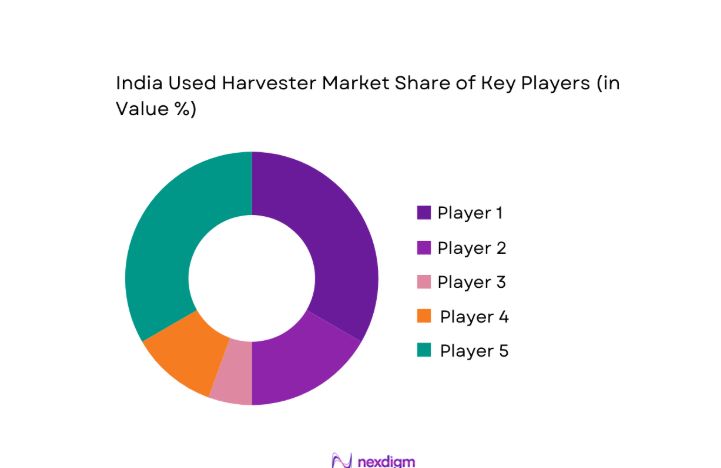
Competitive Landscape
The competitive environment features a mix of OEM-backed certified programs, regional refurbishers, and multi-state dealer aggregators. Differentiation centers on inspection depth, parts assurance, service turnaround, and channel partnerships with custom hiring operators. Platform-led discovery is strengthening while formal financing tie-ups remain uneven across regions.
| Company Name | Establishment Year | Headquarters | Formulation Depth | Distribution Reach | Regulatory Readiness | Service Capability | Channel Strength | Pricing Flexibility |
| Mahindra & Mahindra | 1945 | Mumbai | ~ | ~ | ~ | ~ | ~ | ~ |
| TAFE | 1960 | Chennai | ~ | ~ | ~ | ~ | ~ | ~ |
| Escorts Kubota | 1944 | Faridabad | ~ | ~ | ~ | ~ | ~ | ~ |
| John Deere India | 1998 | Pune | ~ | ~ | ~ | ~ | ~ | ~ |
| CNH Industrial India | 1999 | Greater Noida | ~ | ~ | ~ | ~ | ~ | ~ |
India Used Harvester Market Analysis
Growth Drivers
Rising farm mechanization in secondary markets
Secondary-market mechanization accelerated as cultivated holdings with fragmented parcels expanded machine access through shared hiring centers. Government mechanization centers rose from 14000 in 2022 to 18200 in 2024, improving access in tier 2 districts. Seasonal labor shortages intensified, with agricultural workforce participation declining from 214 million in 2022 to 206 million in 2024, pushing adoption of pre-owned harvesters. Road density increased from 1.9 km per sq km in 2023 to 2.1 in 2025 across agrarian states, easing inter-state equipment movement. Credit accounts for farm machinery rose from 9.2 million in 2023 to 11.1 million in 2025.
High new equipment prices driving trade-down demand
Import dependence for precision components constrained supply of new harvesters amid currency volatility, elevating purchase barriers for small operators. Agricultural equipment loan disbursals expanded from 3.1 million accounts in 2022 to 4.0 million in 2024, yet average ticket sizes remained constrained, encouraging used equipment purchases. Rural household indebtedness rose from 52 in 2022 to 58 in 2024 on standardized indices, reinforcing preference for refurbished assets. Workshop density improved from 0.8 per 100 villages in 2023 to 1.1 in 2025, lowering maintenance risk. Diesel pump penetration reached 13.4 million units by 2024, enabling higher utilization of legacy machines.
Challenges
Inconsistent equipment quality and documentation
Quality variance persists due to fragmented refurbishment standards and limited service records. Only 37 percent of traded units in 2023 carried verifiable hour-meter histories across surveyed districts, complicating valuation and financing approvals. Formal inspection coverage expanded from 4200 centers in 2022 to 6100 in 2024, yet geographic gaps remain. Counterfeit parts seizures rose from 1800 cases in 2023 to 2600 in 2024, increasing reliability risks. Technician certification enrollments grew from 74000 in 2022 to 91000 in 2025, insufficient to meet field demand. Inconsistent documentation raises downtime, inflates repair cycles, and constrains warranty-backed transactions.
Limited financing and insurance for used machines
Formal lenders impose stricter collateral requirements for pre-owned assets, constraining access. Farm equipment insurance coverage for used machines covered 1.6 million units in 2023 versus 2.3 million for new equipment in 2024, widening risk exposure. Branch-level agri-credit outlets increased from 96000 in 2022 to 108000 in 2025, yet underwriting guidelines for used assets remain conservative. Claim settlement cycles averaged 74 days in 2024, extending downtime for fleet operators. Digital KYC adoption reached 89 percent in 2025, but asset registry integration lags, slowing approvals. Financing frictions cap scale and slow formalization of resale channels.
Opportunities
Formalization of used equipment marketplaces
Digital discovery can consolidate fragmented supply and standardize grading. Registered agri-equipment listings grew from 420000 in 2022 to 690000 in 2024 across platforms, improving liquidity. State e-procurement pilots expanded from 7 states in 2023 to 12 in 2025, enabling transparent auctions for fleet upgrades. Warehouse receipt coverage increased from 28000 in 2022 to 51000 in 2024, supporting collateralization of refurbished assets. Telematics retrofits rose from 190000 devices in 2023 to 340000 in 2025, enabling condition verification. Platform-mediated escrow reduces counterparty risk, accelerating turnover and geographic reach.
Refurbishment and certified pre-owned programs
Standardized refurbishment can improve uptime and buyer trust. Authorized refurbishment bays increased from 2100 in 2022 to 3600 in 2024, shortening turnaround times. Parts localization programs lifted domestic component approvals from 420 to 690 SKUs between 2023 and 2025, stabilizing maintenance cycles. Technician apprenticeships rose from 18000 in 2022 to 32000 in 2024, expanding service capacity. Predictive maintenance pilots logged 1.4 million machine-hours in 2025, reducing unplanned stoppages. Certification frameworks linked to warranty norms can improve financing acceptance, unlock insurance coverage, and enable fleet standardization for custom hiring operators.
Future Outlook
The outlook reflects continued formalization of resale channels, deeper financing partnerships, and wider adoption of certification standards through 2026–2035. Platform-led discovery and refurbishment capacity expansion will improve transparency and uptime. Regional diffusion beyond traditional belts will be supported by service density growth and inter-state logistics normalization. Policy continuity around mechanization and cooperative hiring is expected to sustain demand momentum.
Major Players
- Mahindra & Mahindra
- TAFE
- Escorts Kubota
- John Deere India
- CNH Industrial India
- Case IH India
- Kubota Agricultural Machinery India
- Claas India
- Preet Agro Industries
- International Tractors
- Swaraj Tractors
- VST Tillers Tractors
- Dasmesh Mechanical Works
- Kartar Agro Industries
- Yanmar India
Key Target Audience
- Custom hiring center operators
- Large and mid-sized farming enterprises
- Independent equipment dealers and refurbishers
- Agricultural cooperatives and FPOs
- Rural banks and non-banking financial companies
- Equipment insurers and warranty providers
- Investments and venture capital firms
- Government and regulatory bodies with agency names
Research Methodology
Step 1: Identification of Key Variables
Variables were defined across product types, channels, refurbishment standards, service density, financing access, logistics readiness, and regional crop calendars. Field scoping prioritized districts with high mechanization intensity and inter-state equipment movement corridors. Operational risk indicators and service turnaround metrics were shortlisted for comparative analysis.
Step 2: Market Analysis and Construction
Primary interviews with dealers, refurbishers, fleet operators, and technicians were triangulated with administrative records on mechanization centers and credit penetration. Regional demand models incorporated crop calendars, labor availability, and workshop density. Channel performance was mapped against logistics reach and warranty coverage norms.
Step 3: Hypothesis Validation and Expert Consultation
Findings were stress-tested through consultations with state mechanization officers, insurer assessors, and service network heads. Assumptions on downtime, parts localization, and financing acceptance were validated against operational KPIs. Scenario testing evaluated sensitivity to logistics disruptions and seasonal labor variability.
Step 4: Research Synthesis and Final Output
Insights were synthesized into segment-wise narratives, competitive benchmarking, and opportunity pathways. Cross-validation ensured internal consistency across channels and regions. Outputs were structured for decision use by operators, financiers, and policy stakeholders, emphasizing actionable levers and implementation risks.
- Executive Summary
- Research Methodology (Market Definitions and Scope, Dealer and Auction Channel Interviews, OEM and Refurbisher Supply Mapping, Farm Mechanization Census Analysis, Pricing and Residual Value Tracking, Regional Demand Modeling, Data Triangulation and Validation)
- Definition and Scope
- Market evolution
- Usage and replacement pathways
- Ecosystem structure
- Supply chain and channel structure
- Regulatory environment

- Growth Drivers
Rising farm mechanization in secondary markets
High new equipment prices driving trade-down demand
Expansion of custom hiring and rental operators
Improving refurbishment and resale networks
Shortage of seasonal farm labor
Government support for mechanization and FPOs - Challenges
Inconsistent equipment quality and documentation
Limited financing and insurance for used machines
High maintenance and parts availability risk
Fragmented dealer and refurbisher ecosystem
Seasonal demand volatility by crop cycles
Low transparency in pricing and machine history - Opportunities
Formalization of used equipment marketplaces
Refurbishment and certified pre-owned programs
Digital platforms for price discovery and listings
Financing and warranty bundles for used machines
Penetration in eastern and northeastern states
Export of refurbished units to neighboring markets - Trends
Growth of dealer-backed buyback programs
Increasing role of auctions and online platforms
Standardization of inspection and grading processes
Rising demand for multi-crop combines
Data-led pricing based on hours and condition
Bundling of service contracts with used equipment - Government Regulations
- SWOT Analysis
- Stakeholder and Ecosystem Analysis
- Porter’s Five Forces Analysis
- Competition Intensity and Ecosystem Mapping
- By Value, 2020–2025
- By Volume, 2020–2025
- By Installed Base, 2020–2025
- By Average Selling Price, 2020–2025
- By Product Type (in Value %)
Combine harvesters
Reaper binders
Forage harvesters
Sugarcane harvesters - By Crop Type (in Value %)
Wheat
Paddy
Maize
Sugarcane
Multi-crop applications - By Power Class (in Value %)
Below 80 HP
80–120 HP
Above 120 HP - By Sales Channel (in Value %)
OEM and authorized dealers
Independent used equipment dealers
Farmer-to-farmer transactions
Auctions and digital marketplaces - By Region (in Value %)
North India
West India
South India
East and Northeast India
- Market structure and competitive positioning
Market share snapshot of major players - Cross Comparison Parameters (Product portfolio breadth, Refurbishment capability, Dealer network reach, Pricing and financing offers, After-sales support, Warranty and certification, Regional presence, Digital sales enablement)
- SWOT Analysis of Key Players
- Pricing and Commercial Model Benchmarking
- Detailed Profiles of Major Companies
Mahindra & Mahindra
TAFE
Escorts Kubota
John Deere India
CNH Industrial India
Case IH India
Kubota Agricultural Machinery India
Claas India
Preet Agro Industries
International Tractors (Sonalika)
Swaraj Tractors
VST Tillers Tractors
Dasmesh Mechanical Works
Kartar Agro Industries
Yanmar India
- Demand and utilization drivers
- Procurement and tender dynamics
- Buying criteria and vendor selection
- Budget allocation and financing preferences
- Implementation barriers and risk factors
- Post-purchase service expectations
- By Value, 2026–2035
- By Volume, 2026–2035
- By Installed Base, 2026–2035
- By Average Selling Price, 2026–2035


 Request a Sample
 Ask for Customization
 Get a Quote
 Enquire Now