
 Download PDF
 Download PDF
Market Overview
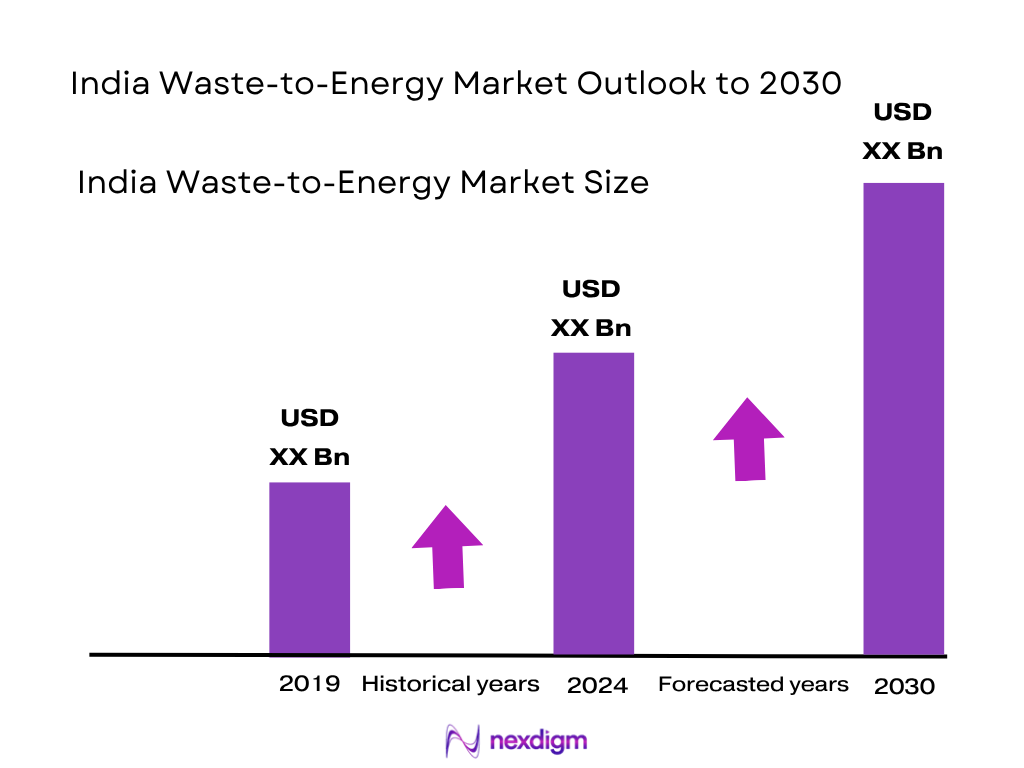
The India Waste‑to‑Energy market is valued at USD 1,516.63 million in 2024. This reflects a steady rise from USD ~1,050 million in 2023. Growth is propelled by rising municipal solid waste generation in urban centers, limited landfill capacity, increasing demand for renewable energy, and proactive policy support such as Swachh Bharat Mission and bio‑CNG incentives. Rising private sector capital deployment and PPP‑based waste management projects further underpin expansion.
Western and Central India lead the domestic Waste‑to‑Energy landscape due to higher levels of urbanization, stronger municipal infrastructure, and extensive policy implementation at state and city levels. Major metropolises in these regions have higher waste generation volumes, stronger grid connectivity, and active PPP models in place, making them focal points for large‑scale WTE installations. Industrial clusters and better fiscal capacity also support quicker project deployment in these areas.
Market Segmentation
By Technology Type
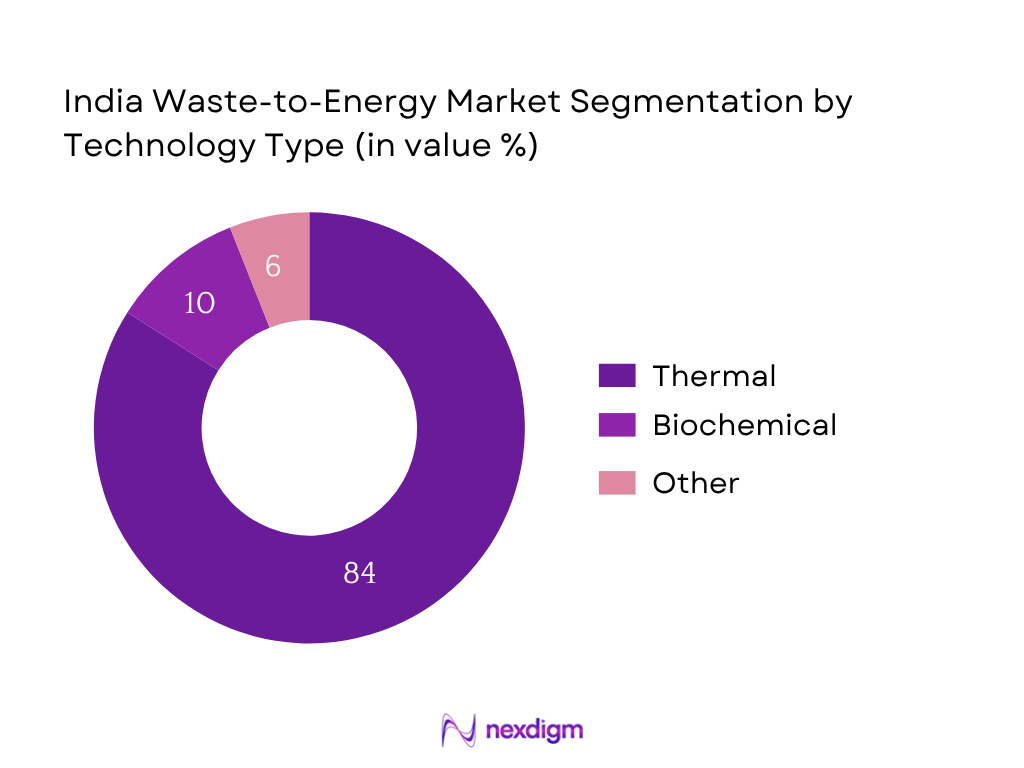
Thermal technologies dominate the India Waste‑to‑Energy market in 2024 with approximately 84% share, driven by wide adoption of incineration and gasification systems across major urban centres. Their prevalence stems from the ability to handle high volumes of mixed municipal waste efficiently, deliver rapid waste volume reduction, and yield steady electricity output. Additionally, thermal systems benefit from lower per‑unit capital cost and established EPC supply chains. Enhanced flue gas treatment systems and better emission controls have further increased adoption trust among municipalities.
By Waste Type
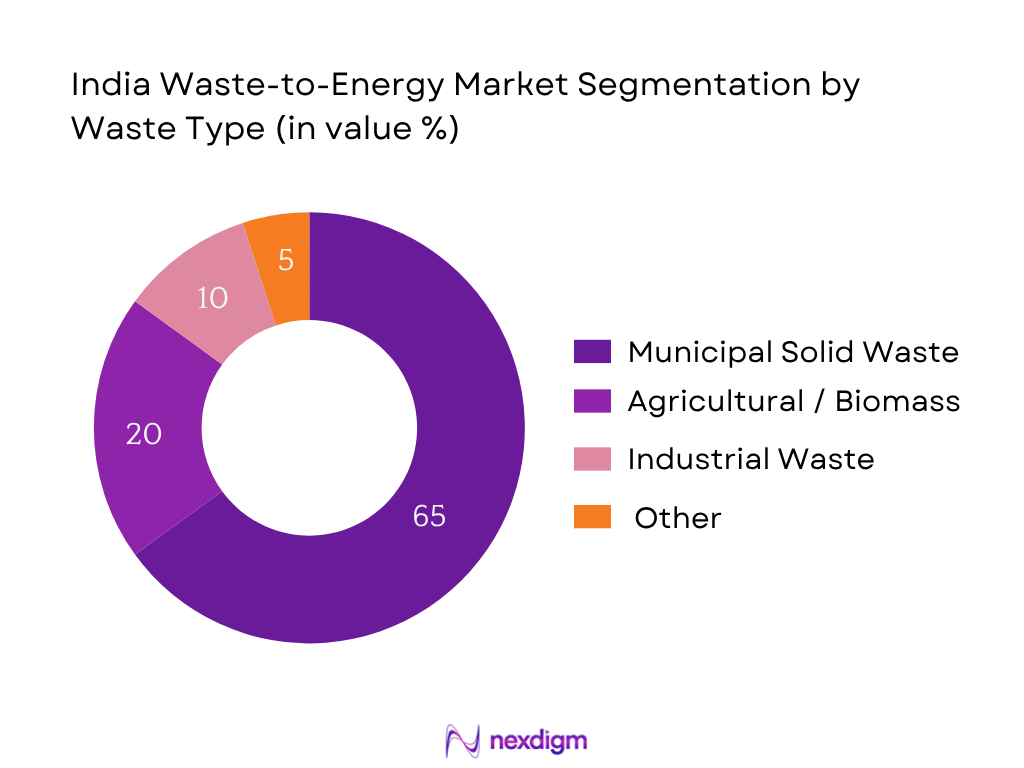
Municipal Solid Waste (MSW) contributes the largest portion of revenue, with an estimated ~65% share in 2024, reflecting its dominance as input feedstock for WTE facilities. Rapid urban growth and rising per capita waste generation (currently over 1 kg per person per day in metros) ensures abundant MSW feedstock. Government mandates under SWM rules enforce source segregation and channel MSW toward WTE plants. Urban local bodies increasingly partner with private developers to convert MSW into electricity or bio‑CNG, further entrenching MSW’s dominance.
Competitive Landscape
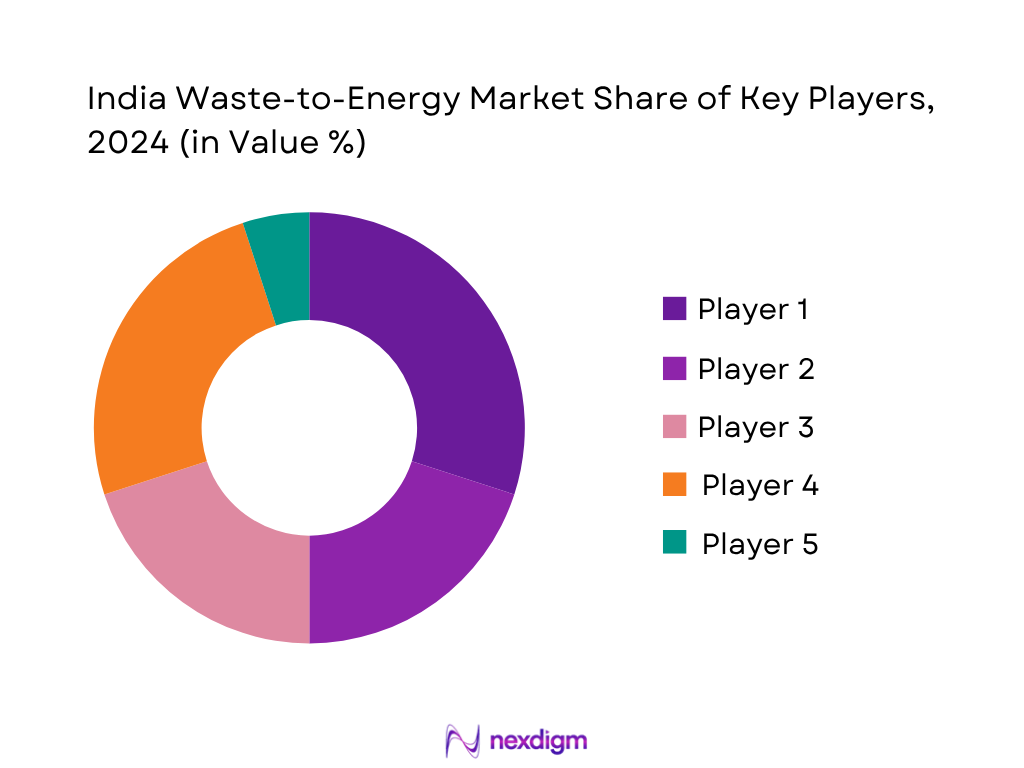
The India Waste‑to‑Energy market is consolidated around a handful of major technology providers and project developers. Key domestic and international firms compete based on technology capability, project execution, emission compliance, and plant efficiency. The competitive dynamics are shaped by government tenders, state utilities, and PPP contracts.
| Company | Establishment Year | Headquarters | Installed Capacity (MW) | Waste Processed (TPD) | Technology Focus | Regulatory Approvals | Efficiency / Emission Control |
| Ramky Enviro Engineers | 1996 | Hyderabad, India | – | – | – | – | – |
| Essel Infraprojects | 1998 | Mumbai, India | – | – | – | – | – |
| IL&FS Environment | 1987 | New Delhi, India | – | – | – | – | – |
| Abellon Clean Energy | 2007 | Ahmedabad, India | – | – | – | – | – |
| Eco Green Energy | 2009 | Bengaluru, India | – | – | – | – | – |
India Waste‑to‑Energy Market Analysis
Growth Drivers
Urban Solid Waste Generation Surge
India generates approximately 62 million tonnes of municipal solid waste annually, of which only 43 million tonnes are collected and 12 million tonnes treated, leaving 31 million tonnes sent to landfills. In 2024, smart cities alone produced around 160,039 tonnes per day (TPD) of MSW, according to recent urban tracking studies. Rapid urbanization and changing consumption patterns drive this volume, creating consistent feedstock supply for waste‑to‑energy (WTE) plants focused on municipal solid waste. Such high-volume waste streams are critical inputs enabling economies of scale and justifying capital investment in thermal or biochemical conversion technologies.
National Bio‑Energy and Waste Management Policies
India’s Municipal Solid Waste (Management and Handling) Rules, updated in 2016 and enforced nationwide, mandate source segregation, composting, and energy recovery for collected waste via structured frameworks. In fiscal 2024, the Ministry of Power reported achievement of 99.94% national electricity access, implying improved enabling grid infrastructure for WTE projects. These regulatory mandates combined with nearly universal electrification ensure waste‑to‑energy projects can connect reliably to grid systems. Policy clarity on segregation and co‑treatment incentivizes municipalities to channel segregated waste into WTE setups under PPP or private ownership models.
Market Challenges
Capital‑Intensive Infrastructure
Waste‑to‑Energy projects require significant upfront investment—for example, incineration plants demand expenditure on flue gas treatment units, boilers, grid interconnection, and land procurement. Government records show that inter‑state transmission infrastructure worth ₹60,676 crore was allocated in 2024 for similar grid projects. This reflects the scale of capital required. Smaller municipalities or tier‑2 cities often face financial constraints in raising such infrastructure-level funding, resulting in delays or project non‑viability unless supplemented by central/state grants or PPP structures with private equity involvement.
Feedstock Quality and Segregation Issues
While India generates 62 million tonnes of MSW annually, only 43 million tonnes is collected, and 31 million tonnes is sent to landfills; segregation success is inconsistent across cities. In Ahmedabad for example, more than 10% of waste from households is plastic improperly mixed, contributing to contamination. Poor segregation leads to heterogeneous feedstock, increasing operational downtime, reducing combustion efficiency, and elevating emissions. WTE plant operators must invest in sorting lines and pre‑treatment units, increasing costs and requiring strong municipal coordination, which is uneven across local bodies.
Market Opportunities
Rising Focus on Circular Economy
India’s waste generation stands at 62 million tonnes annually, with households contributing 42–66% of municipal solid waste in states like Maharashtra and Rajasthan, where significant portions are processed through composting, waste‑to‑energy, and recycling channels. Efforts in cities like Ahmedabad to segregate plastic waste at the source (10% of city waste) enable circular pathways by converting plastics or wet waste into energy instead of landfilling. WTE models integrated with composting and recycling create downstream resource recovery loops, positioning this sector at the heart of circular economy initiatives and attracting green financing and sustainability-linked loans.
Industrial Waste Energy Recovery
EPA and government data indicate that 40% of solid waste in states like Maharashtra is generated by industries (including hazardous, biomedical, e‑waste components), with the remainder from households and commercial sectors. Industrial clusters in states like Gujarat generate 2.71 lakh tonnes (271,000 tonnes) of plastic waste annually (2022‑23) alone in Ahmedabad region. This high‑calorific industrial and plastic waste stream presents potential for energy recovery via gasification or RDF pellets. Proximity to industrial zones also ensures captive consumption opportunities, making WTE projects co‑located in industrial parks financially and logistically viable.
Future Outlook
Over the next five to six years, the India Waste‑to‑Energy market is poised for steady expansion, supported by rising urban solid waste flows, national commitments to renewable energy targets, and increasing efficiency in waste segregation and collection systems. Government is launching schemes to incentivize decentralized biogas and biomethanation units, especially in Tier‑2/3 cities. Technological upgrades in emission control and real‑time monitoring will raise plant efficiency, while private capital inflows and infrastructure funding will enable new projects across regions beyond traditional hubs. Projected market growth is expected at a CAGR of ~2.56% for 2025–2030, based on Nexdigm’s forecast. This would bring the market from USD 1,516.63 million in 2024 toward approx. USD 1.9 billion–USD 2.0 billion by 2030.
Major Players
- Ramky Enviro Engineers
- Essel Infraprojects
- IL&FS Environment
- Abellon Clean Energy
- Eco Green Energy
- Hitachi Zosen India
- Jindal ITF
- Antony Lara Enviro Solutions
- Ashoka Biogreen Energy
- Re Sustainability
- Zonta Infratech
- Tamil Nadu Waste‑to‑Energy Limited
- SUEZ Group India
- A2Z Group
- Sembcorp Green Infra (or Sembcorp Energy India)
Key Target Audience
- Municipal Corporations (especially urban local bodies in Western and Central States)
- State Urban Development / Environment Departments (e.g. Ministry of Housing and Urban Affairs, State Pollution Control Boards)
- Utilities and Power Distribution Companies
- Industrial Park Developers and SEZ Authorities
- Real Estate and Smart City Developers
- Waste Management Service Providers
- Investments and Venture Capitalist Firms
- Government and Regulatory Bodies (MNRE, MoEF&CC)
Research Methodology
Step 1: Identification of Key Variables
We developed an ecosystem map comprising stakeholders such as municipal authorities, technology vendors (thermal and biochemical), EPC contractors, feedstock suppliers, and finance partners. Secondary sources included energy ministry dashboards, and state-level policy documents. The goal was to identify variables like installed capacity, waste input volumes, technology types, and regulatory frameworks.
Step 2: Market Analysis and Construction
Historical data (2019–2023) were collated and validated via secondary databases. We analyzed installed capacity growth, segmental revenue share (by technology, feedstock), and waste processing metrics. This was cross‑checked against Ministry of Power capacity breakdown and municipal waste generation trends to confirm revenue build-up.
Step 3: Hypothesis Validation and Expert Consultation
Market hypotheses—for example dominance of thermal segment and MSW feedstock share—were validated through interviews with project developers, municipal engineers, and technology providers. Computer‑assisted interviews (CATI) provided operational efficiency data, capex trends, and insight on regulation compliance and project KPIs.
Step 4: Research Synthesis and Final Output
We engaged directly with leading waste‑to‑energy firms to verify capacity numbers, technology deployment, and future project pipelines. This bottom‑up interaction helped triangulate secondary data with real operational metrics, ensuring accuracy and depth in the final market sizing and segment analysis.
- Executive Summary
- Research Methodology (Market Definitions and Assumptions, Abbreviations, Market Sizing Approach, Consolidated Research Approach, Understanding Market Potential Through In-Depth Industry Interviews, Primary Research Approach, Limitations and Future Conclusions)
- Definition and Scope
- Market Genesis and Evolution
- Timeline of Government Policies and Projects
- Business Cycle Analysis
- Waste Management to Energy Conversion Flow (Waste Collection to Power Grid Injection)
- Value Chain and Stakeholder Mapping

- Growth Drivers
Urban Solid Waste Generation Surge
National Bio-Energy and Waste Management Policies
Rising Electricity Demand in Tier-2/3 Cities
Decline in Landfill Availability
Carbon Credit and Green Energy Push - Market Challenges
Capital-Intensive Infrastructure
Feedstock Quality and Segregation Issues
Limited Grid Connectivity in Rural Projects
Regulatory Hurdles at Local Levels
Technical Failures and Low Efficiency Projects - Market Opportunities
Rising Focus on Circular Economy
Industrial Waste Energy Recovery
Regional Investment Corridors and Smart Cities
Potential for Biogas Export and RNG Integration - Key Trends
Integration of AI/IoT for Smart Waste Management
PPP Expansion in Metro Cities
Technology Transfer from Europe & Japan
Mobile Waste-to-Energy Units - Regulatory Environment
Ministry of New and Renewable Energy (MNRE) Guidelines
State Electricity Board Feed-in Tariffs
SWM Rules 2016 and Updates
Incentives under SATAT and PLI Schemes - SWOT Analysis
- Stakeholder Ecosystem
- Porter’s Five Forces Analysis
- By Value, 2019-2024
- By Volume (Tons of Waste Converted per Day), 2019-2024
- By Installed Capacity (MW), 2019-2024
- By Plant Efficiency Ratio, 2019-2024
- By Technology Type (In Value %)
Incineration
Gasification
Pyrolysis
Anaerobic Digestion
Refuse-Derived Fuel (RDF) - By Feedstock Type (In Volume %)
Municipal Solid Waste (MSW)
Agricultural Waste
Industrial Waste
E-Waste
Biomedical Waste - By End Use Application (In Value %)
Electricity Generation
Heat Generation
Combined Heat and Power (CHP)
Biofuel/Biogas Production - By Ownership Model (In Value %)
Government-Owned
Public-Private Partnership (PPP)
Private Sector Operated - By Region (In Value %)
North India
South India
East India
West India
Central India
- Market Share Analysis by Revenue and Installed Capacity
- Cross Comparison Parameters (Company Overview, Business Model, Recent Projects, Installed Capacity (MW), Daily Waste Processed (TPD), Geographical Presence, Technology Used, Feedstock Focus, Regulatory Approvals, Plant Efficiency (%), Emission Control Standards)
- SWOT Analysis of Key Players
- Pricing and Tariff Comparison (Power Output vs Cost of Generation per kWh)
- Detailed Company Profiles
Ramky Enviro Engineers
Essel Infraprojects
Hitachi Zosen India
Jindal ITF
EverEnviro Resource Management
IL&FS Environment
Eco Green Energy
Abellon Clean Energy
Antony Lara Enviro Solutions
Ashoka Biogreen Energy
Zonta Infratech
Re Sustainability
Tamil Nadu Waste-to-Energy Limited
Organic Recycling Systems
Ramky Enviro (ReWaste Energy)
- Industrial Buyers
- Municipal Corporations
- Real Estate/SEZs
- Energy Utilities and Grid Operators
- EPCs and Infra Investors
- By Value, 2025-2030
- By Volume, 2025-2030
- By Installed Capacity, 2025-2030
- By Plant Efficiency (Waste Processed vs Energy Output), 2025-2030


 Request a Sample
 Ask for Customization
 Get a Quote
 Enquire Now