
 Download PDF
 Download PDF
Market Overview
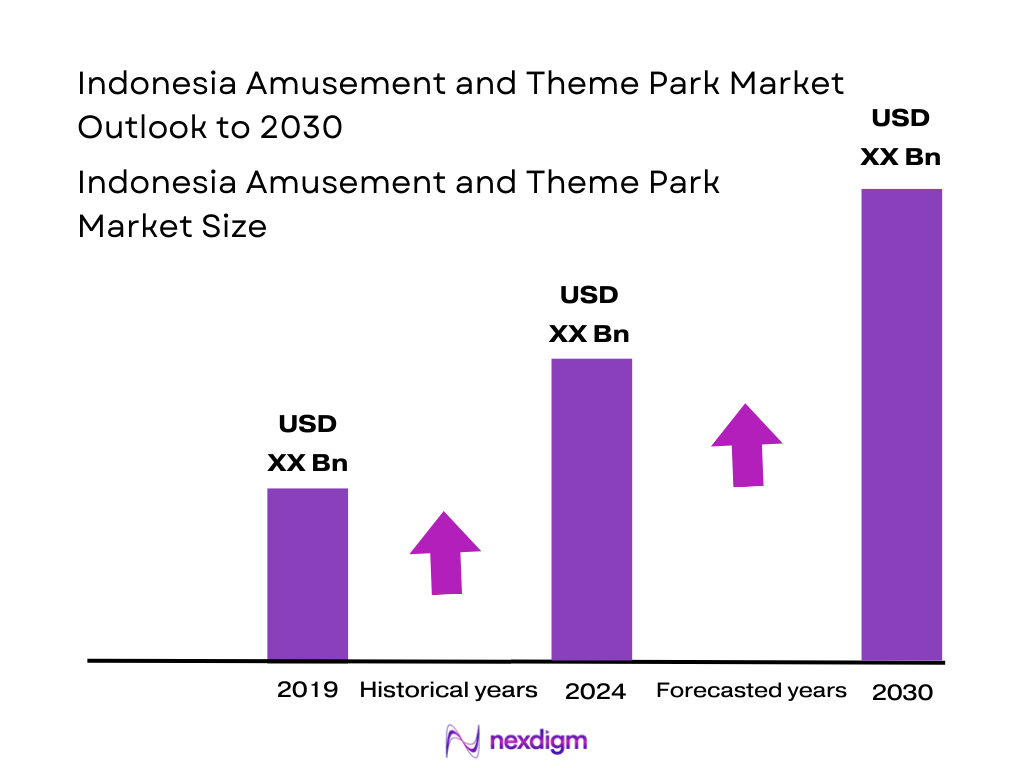
The Indonesia amusement & theme park market has attained a substantial revenue scale in the current period, as indicated by insights derived from regional and local research assessments. Growth in 2023–2024 was driven by a rebound in domestic tourism after COVID restrictions, expansion of new ride attractions, and rising per‐visitor spending on F&B, merchandise, and premium passes. The increasing middle class and improved infrastructure (transport, airports, hotels) nudged more Indonesians and regional tourists to include theme parks in vacation plans.
The dominance in this market is concentrated in major urban and tourist hubs such as Greater Jakarta (Java), Bali, and Surabaya / East Java. Jakarta hosts large parks like Ancol Dreamland and Dunia Fantasi, benefiting from dense population, ease of accessibility, and high income concentration. Bali draws international tourists, enhancing demand for premium experiences and integrated resort parks. East Java’s Jatim Park cluster captures domestic travelers from neighboring provinces and benefits from strong intercity transport links. These cities command dominance due to scale, infrastructure, and high tourist footfall.
Market Segmentation
By Park Type
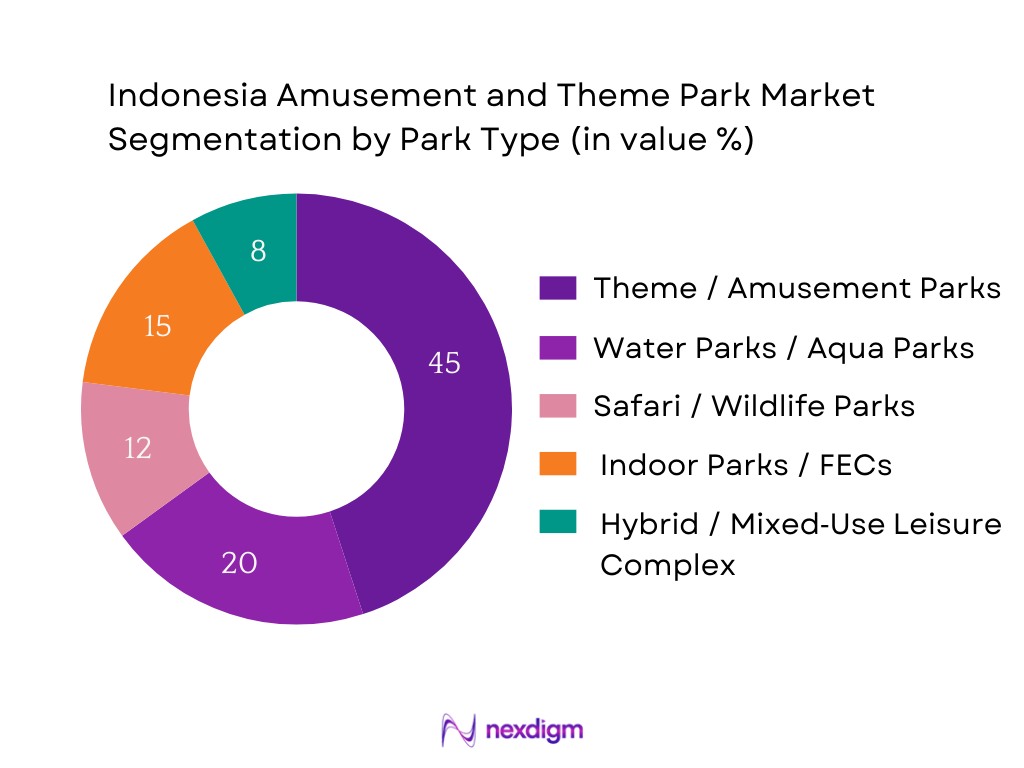
Theme / Amusement Parks currently dominate Indonesia’s market share (≈ 45 % in 2024) due to their broad appeal across age groups, large scale, brand recognition, and more diversified ride portfolios. Major destinations like Dufan (Jakarta), Trans Studio (Bandung, Makassar), and Jatim Park have established strong reputations and attract both locals and tourists. These parks can capture higher ARPU through tiered tickets, seasonal events, and bundled packages. Water parks follow as complementary seasonal attractions especially in coastal and resort locations; indoor FECs gain traction in dense urban zones as satellite offerings. Safari/wildlife parks draw niche educational tourism, and hybrid complexes combine theme, hotel, retail and entertainment operations to boost synergies.
By Revenue Source / Component
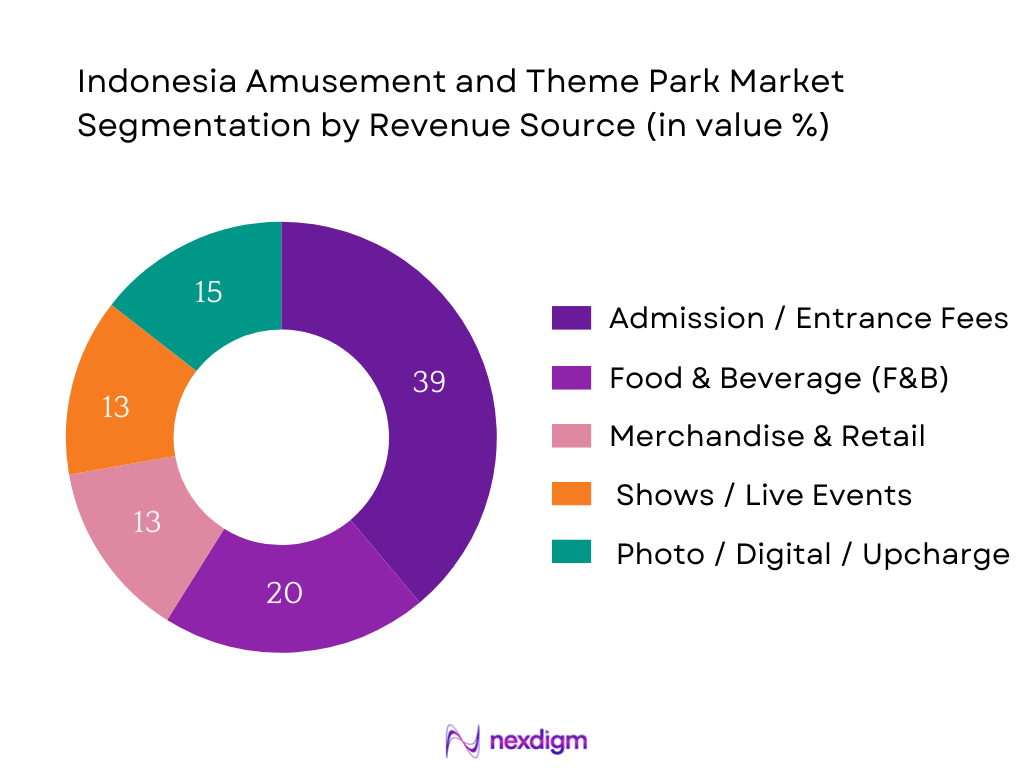
Within this segmentation, Admission / Entrance Fees take the lion’s share (≈ 35 % in 2024) because ticketing is the foundation of park revenue and ensures baseline cash flow. Every visitor must pass through to access attractions, making entrance yield indispensable. However, the more rapidly growing components are F&B and Merchandise & Retail, together capturing ~30 %. Many parks are optimizing in‑park spending through themed restaurants, branded merchandise, photo booths, and AR/VR upsells. The Shows & Live Events/Experiences segment (~12 %) is increasing as parks host concerts, seasonal festivals, parades, and nighttime spectacles to lengthen dwell time. Photo / Digital Upcharges (~13 %) act as margin boosters, particularly in high footfall parks leveraging brand tie‑ups and digital monetization.
Competitive Landscape
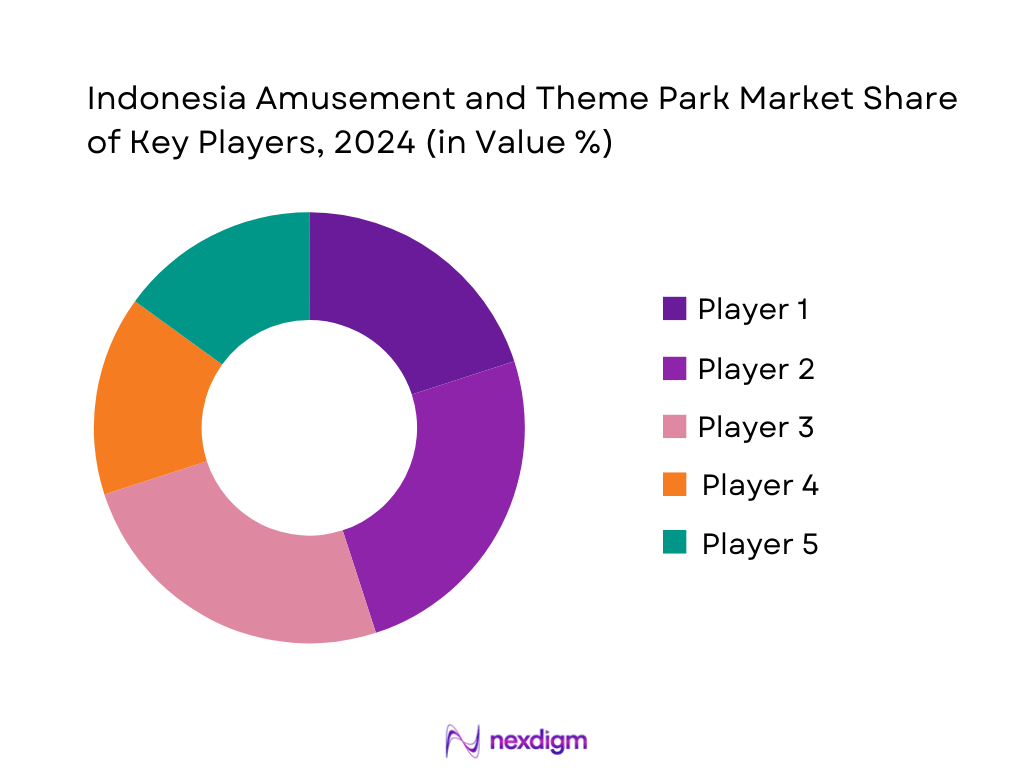
The Indonesia amusement & theme park market is moderately consolidated, with a handful of large operators dominating flagship venues, while numerous smaller regional or FEC operators compete in secondary markets. The major players deploy significant capital in ride development, branding, loyalty programs, and event marketing, creating barriers to entry. New entrants must match experiential quality, safety standards and marketing muscle to compete.
| Operator / Group | Year Established | Headquarters | Number of Parks | Average Footfall per Park | ARPU (USD / visitor) | Technology Adoption (RFID / App) | Ownership / Business Model |
| PT Pembangunan Jaya Ancol (Ancol / Dufan) | 1966 | Jakarta | – | – | – | – | – |
| Trans Corp (Trans Studio chain) | 1985 | Jakarta | – | – | – | – | – |
| PT Graha Andrasentra Propertindo (JungleLand) | 2008 | Bogor / Jakarta | – | – | – | – | – |
| Taman Safari Indonesia (Safari Parks) | 1990s | Bogor / Central Java | – | – | – | – | – |
| Jawa Timur Park Group (Jatim Park 1/2/3) | 1980s–1990s | East Java | – | – | – | – | – |
Indonesia Amusement and Theme Park Market Analysis
Growth Drivers
Expanding Middle Class and Disposable Income
Indonesia is classified as an upper-middle income country (GNI per capita between USD 4,496 and USD 13,935) under World Bank’s 2024 classification. As national economic growth resumed around 5.0 % in nominal GDP terms in 2024, household incomes have broadly improved. While recent reports highlight some contraction in the formal “middle class” population (from ~60 million in prior years to ~47.9 million mid‑2024) due to costs and inflation, many households with moderate incomes still ascend into discretionary spending tiers. That rising disposable income—measured in rising per capita GDP and broader consumption—supports demand for experiential leisure. For amusement parks, this means more families able to allocate funds beyond essentials toward recreation, particularly in metro areas where income levels are relatively higher.
Domestic Tourism Push and Infrastructure Boost
Indonesia’s own tourism statistics (via Indonesia’s BPS, the national statistics agency) report consistent tracking of domestic visitor counts, overnight stays, and tourism expenditure, though latest months unpublished in open summary. The government has actively promoted domestic tourism as recovery from global travel shocks. Meanwhile, investment in infrastructure (roads, airports, connectivity)—notably the new capital project Nusantara in East Kalimantan, backed by ~USD 35 billion in multi‑phase spending —improves access to regions that previously were unreachable for mass recreation. In addition, major metropolitan connectivity (e.g. Jakarta, Bandung, Surabaya) supports spillover visitor flows. With improved accessibility, more parks in peripheral or secondary cities become viable, and existing parks in tourist corridors benefit from easier access for local tourists.
Market Challenges
High Initial Capital & Long Payback Periods
Launching a full-scale amusement or theme park demands capital for land acquisition, ride procurement, civil works, utilities, and safety infrastructure. While macroeconomic growth presents favorable conditions, mobilizing such capital remains challenging. Many developers require multi‑year financing or partnerships to justify scale. Given that Indonesia’s economic reports show investment growth struggles (e.g. slower private investment growth in recent quarters), access to affordable capital is constrained. Because revenue ramp-up is gradual, recouping costs often spans many years—this long payback horizon deters many potential entrants or expansions, especially in secondary cities.
Weather Dependence & Seasonality
Indonesia’s tropical climate brings wet/dry season cycles—heavy rainfall months reduce outdoor attraction utilization. Visitor footfall drops significantly during monsoon or rainy months, compressing peak season income. Because parks are exposed to weather, revenue volatility is high. Already, tourism industry research notes that attractions in coastal or inland regions experience pronounced seasonal swings. Given uneven distribution of rainfall and storms across Java, Bali, Sumatra, parks must manage low‑demand months. This dependence on weather increases risk and requires buffer capital or adaptive offerings (indoor attractions).
Emerging Opportunities
Indoor Parks in Urban Centers
Urban density and space scarcity in Jakarta, Bandung, Surabaya, and other large metros create demand for compact, year‑round indoor amusement or family entertainment centers (FECs). These indoor models mitigate weather seasonality risk and better cater to daily foot traffic. As urban population share rises (urban population ~ 52 % of total), many consumers prefer entertainment within city limits. Indoor parks can be integrated into malls or mixed developments, costing lower land acquisition capital and generating steady weekday traffic outside peak tourism flows. For example, large malls across Indonesia already host FECs and VR zones; scaling full indoor amusement brands is a scalable extension. This segment is thus a robust pathway for expansion in densely populated zones.
Water‑Based & Safari Concepts in Tourist Corridors
Regions with strong tourism appeal—Bali, Nusa Tenggara, Sumatra coasts, and nature corridors—offer fertile ground for water parks, aquaparks, and safari / wildlife leisure experiences. Coastal resorts, beach destinations, and islands already host visitors seeking beach and water recreation; water parks provide complementary offerings. Safari parks and wildlife attractions tie into Indonesia’s biodiversity tourism. Tourism trend studies show ecotourism and diversified local tourism villages are rising trends in Indonesia. In those corridors, land is more available and visitor demand already exists. Parks focusing on water or nature experiences incur different capital profiles and may draw tourists longer dwell times. Entry risk is lower than full mega parks. As visitor numbers in those corridors increase, water and safari concepts can scale effectively and serve as feeders to broader amusement networks.
Future Outlook
Over the forecast horizon to 2030, the Indonesia amusement & theme park market is projected to maintain robust expansion, driven by accelerated domestic tourism, growing consumer preference for experiential recreation, and rising per capita disposable spending. Investment in tech innovations (RFID, mobile apps, VR/AR attractions), IP licensing deals, and integrated resort models will further fuel differentiation and monetization. The advancement of regional infrastructure (roads, airports, connectivity) is expected to open new catchment areas for mid‑tier parks, while mature parks will compete on upgrading guest experience and revenue optimization.
Major Players
- PT Pembangunan Jaya Ancol (Dufan / Dunia Fantasi)
- Trans Corp (Trans Studio Bandung, Makassar, Cibubur)
- PT Graha Andrasentra Propertindo (JungleLand)
- Taman Safari Indonesia (I / II / III)
- Jawa Timur Park Group (Jatim Park 1/2/3)
- Saloka Theme Park
- Bali Safari & Marine Park
- KidZania Jakarta
- Timezone Indonesia (indoor FEC chain)
- Funworld Indonesia
- KPIG / MNC Theme Park (Paramount Park Bali / projects)
- Ciputra Group (leisure / entertainment arm)
- Taman Wisata Candi Borobudur / Borobudur complex (theme + heritage)
- SnowBay Waterpark (BSD / Jakarta area)
- IndoPlay / local indoor play & entertainment operators
Key Target Audience
- Theme park developers & operators (domestic and international)
- Real estate & mixed‑use leisure developers
- Entertainment / media & IP licensing companies
- Ride / attraction manufacturers & suppliers
- Hotel & resort operators integrating leisure (e.g., Bali / Jakarta resort chains)
- Investment & venture capital firms (interested in tourism / entertainment assets)
- Government & regulatory bodies (Ministry of Tourism Indonesia, local provincial tourism offices)
- Tourism boards & destination marketing organizations
Research Methodology
Step 1: Identification of Key Variables
We map the entire value chain of the Indonesia amusement & theme park market—operators, ride suppliers, F&B/retail concessionaires, regulators, visitor segments—through desk research into published reports, government tourism statistics, industry databases, and trade associations, to define variables such as attendance, ARPU, yield mix.
Step 2: Market Data Collection & Historical Analysis
We gather historical revenue, visitor, pricing, cost, and operational metrics (load factors, seasonality) from public sources, industry publications, and local park disclosures, and cleanse and standardize this data to construct time‐series trends.
Step 3: Expert Interviews & Validation
We conduct structured and semi‑structured interviews (via CATI / in‑person) with park operators, local tourism authorities, concession vendors, ride manufacturers, and financial analysts to validate assumptions, gather forward insight, and refine revenue/attendance models.
Step 4: Forecasting & Sensitivity Modeling
Using a bottom‑up model, we project attendance growth, yield progression, and cost escalations to derive revenue forecasts. We build scenario analyses (base, upside, downside) to test sensitivity to key drivers like per‑visitor spend, discounting, and capex constraints. Final numbers are triangulated with top‑down validation from regional amusement park growth rates.
- Executive Summary
- Research Methodology
(Market Definitions and Assumptions, Abbreviations, Market Sizing Approach, Consolidated Research Approach, Understanding Market Potential Through In-Depth Industry Interviews, Primary Research Approach, Limitations and Future Conclusions)
- Definition and Scope
- Overview Genesis
- Timeline of Major Park Launches
- Business Cycle & Seasonality
- Supply Chain and Value Chain Analysis

- Key Growth Drivers
Expanding Middle Class and Disposable Income
Domestic Tourism Push and Infrastructure Boost
Growing Urbanization and Youth Demographics
Investment in Integrated Mixed-Use Leisure Projects
Social Media & Experience-Driven Consumption - Key Market Challenges
High Initial Capital & Long Payback Periods
Weather Dependence & Seasonality
Land Acquisition & Urban Planning Restrictions
Safety, Regulation, and Compliance Costs
Talent Retention and Training in Hospitality Services - Emerging Opportunities
Indoor Parks in Urban Centers
Water-Based and Safari Concepts in Tourist Corridors
Licensing Deals with Global IPs
Digital Innovation in Queuing and Personalization
Regional Expansion in Tier-2 Tourist Destinations - Market Trends
Gamification & Personalization Experiences
Tech Integration: RFID, VR, Mobile Apps
Loyalty Programs and Direct-to-Consumer Engagement
Rise in Theme Park-Integrated Resorts
Sustainability and Green Theme Park Models - Government Regulations
Tourism Zoning and Park Approvals
Park Safety and Ride Standards
Foreign Investment & Licensing Norms
Labor Law Compliance
Environmental and Land Use Regulation - SWOT Analysis
- Stake Ecosystem
- Porter’s Five Forces
- By Value, 2019-2024
- By Volume (Visitor Footfall), 2019-2024
- By ARPU (Average Revenue per Visitor), 2019-2024
- By Park Type (In Value %)
Theme / Amusement Parks
Water Parks / Aqua Parks
Safari & Wildlife Parks
Indoor Theme Parks / Family Entertainment Centers (FECs)
Hybrid Leisure & Mixed-Use Parks - By Region (In Value %)
Greater Jakarta & West Java
Bali & Nusa Tenggara
Sumatra
Kalimantan, Sulawesi & Eastern Indonesia
Secondary Cities (e.g., Surabaya, Bandung, Makassar) - By Visitor Type (In Volume %)
Domestic Local Visitors
Domestic Tourists (Intercity)
International Tourists
Group/Educational Visitors
Corporate & MICE Visitors - By Revenue Source (In Value %)
Admission Fees
Food & Beverage (F&B)
Merchandise & Retail
Shows/Live Events/Experiences
Sponsorships, Ads, Licensing & Ancillary Sales - By Ticketing Tier (In Value %)
Standard Tickets
VIP/Express/Fast Pass Tickets
Season Passes/Memberships
Bundled Packages (Tour + Park)
Promotional/Discounted Entry
- Cross Comparison Parameters (Ownership Type, Number of Attractions, Park Size, Technology Adoption, Ticketing Model, Guest Satisfaction, Park Rating, Pricing Strategy)
- SWOT Analysis of Major Players
- Pricing Analysis Based on Ticket Types and F&B Bundles
- Detailed Profiles of Major Companies
PT Pembangunan Jaya Ancol (Dufan – Dunia Fantasi)
PT Graha Andrasentra Propertindo (Jungleland)
Trans Corp (Trans Studio Bandung, Cibubur, Makassar)
Taman Safari Indonesia
MNC Land (MNC Theme Park Bali – upcoming)
Jawa Timur Park Group (Jatim Park 1/2/3)
Saloka Theme Park
Bali Safari & Marine Park
Kidzania Jakarta
Timezone Indonesia (Indoor FEC Chain)
Funworld Indonesia
Ciputra Group (Leisure Developments)
Plaza Indonesia FEC Projects
Global Indoor Theme Parks
International Collaborations (Paramount, Universal – potential/future entries)
- Visitor Motivation and Travel Purpose
- Budget Allocation and Spending Habits
- Touchpoint Journey and Digital Influence
- Group and Family Behavior Patterns
- Visitor Pain Points and Satisfaction Scores
- By Value, 2025-2030
- By Volume, 2025-2030
- By ARPU, 2025-2030


 Request a Sample
 Ask for Customization
 Get a Quote
 Enquire Now