
 Download PDF
 Download PDF
Market Overview
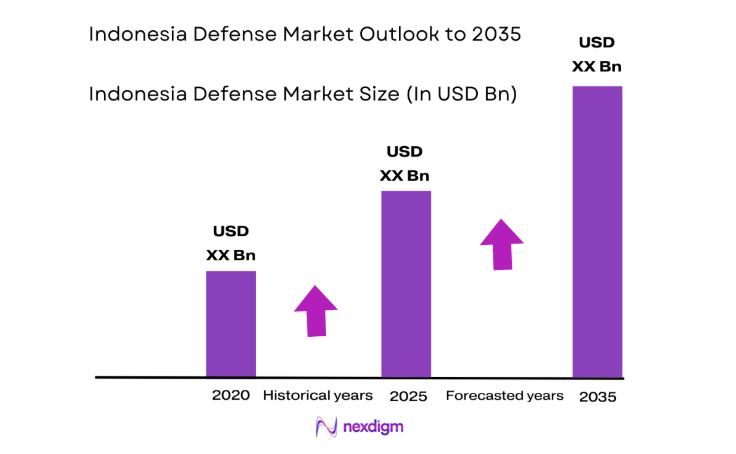
The Indonesia Defense market current size stands at around USD ~ million, reflecting sustained procurement cycles, modernization programs, and platform sustainment requirements across land, naval, air, cyber, and ISR domains. Budget allocations are channeled into fleet upgrades, domestic production mandates, and interoperability enhancements. Ongoing lifecycle support, spares localization, and mission system integration underpin demand continuity. Industrial participation rules and technology transfer frameworks reinforce local assembly, MRO capacity, and subsystem manufacturing.
Demand concentration is highest in Jakarta and West Java due to headquarters functions, system integration hubs, and proximity to defense SOEs. Naval requirements cluster around Surabaya and Batam, supported by shipyards and maintenance facilities. Airbase-centric demand is prominent in Java and Sulawesi where fleet sustainment and upgrades concentrate. Eastern provinces show rising surveillance needs driven by archipelagic coverage. Policy support, infrastructure maturity, and supplier ecosystems in these regions accelerate deployment, sustainment, and training throughput.
Market Segmentation
By Domain
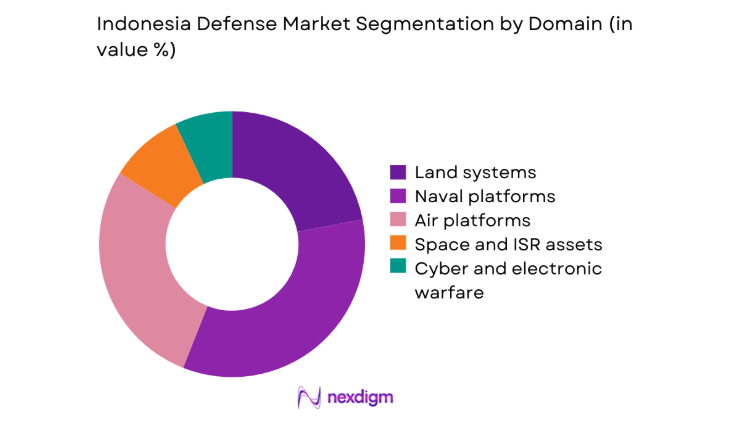
The domain-based structure is dominated by maritime and air platforms given Indonesia’s archipelagic security priorities and expansive EEZ surveillance needs. Naval surface combatants, patrol vessels, and ASW systems attract sustained demand, reinforced by shipyard upgrades and fleet life-extension programs. Air platforms emphasize maritime patrol aircraft, fighters, and ISR integration to close coverage gaps across dispersed geographies. Land systems maintain relevance for border security and mobility in remote terrain, while cyber and EW investments expand to protect networks and spectrum operations. Space and ISR assets gain traction as satellite tasking, data fusion, and sensor interoperability mature within command architectures, strengthening joint-force situational awareness.
By Procurement Type
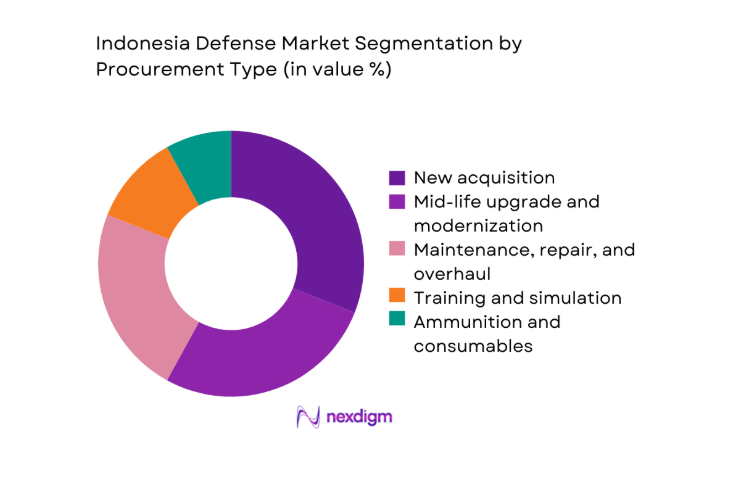
Procurement is shaped by a balance between new acquisitions and modernization cycles addressing aging fleets. Mid-life upgrades account for a significant share as avionics refresh, sensor replacement, and propulsion overhauls extend service life. MRO demand is structurally strong due to multi-origin fleets requiring localized spares, depot-level maintenance, and reliability improvements. Training and simulation expand alongside network-centric operations to improve readiness and reduce live-asset utilization. Ammunition and consumables remain steady, reflecting readiness postures and operational tempo. Domestic content policies increasingly steer procurement toward licensed production and local MRO partnerships, improving sustainment resilience.
Competitive Landscape
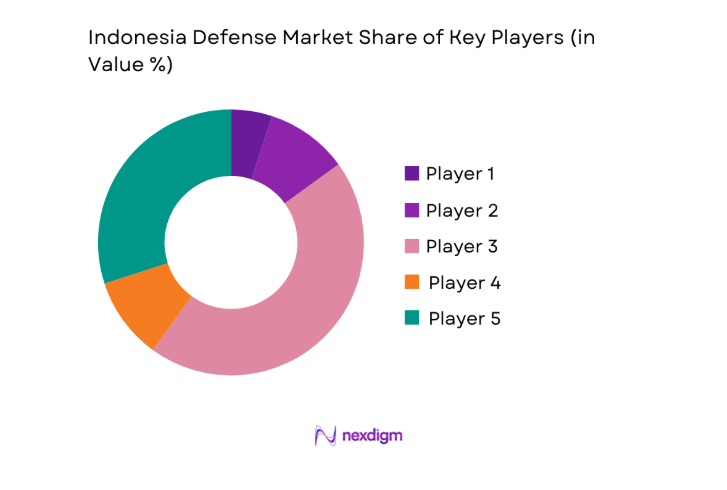
Competition is shaped by domestic SOEs partnering with global OEMs to meet local content rules, technology transfer mandates, and sustainment requirements. Platform breadth, lifecycle support depth, and regulatory readiness influence positioning across naval, air, and land programs.
| Company Name | Establishment Year | Headquarters | Formulation Depth | Distribution Reach | Regulatory Readiness | Service Capability | Channel Strength | Pricing Flexibility |
| PT Pindad | 1983 | Bandung, Indonesia | ~ | ~ | ~ | ~ | ~ | ~ |
| PT PAL Indonesia | 1980 | Surabaya, Indonesia | ~ | ~ | ~ | ~ | ~ | ~ |
| PT Dirgantara Indonesia | 1976 | Bandung, Indonesia | ~ | ~ | ~ | ~ | ~ | ~ |
| Thales | 1893 | Paris, France | ~ | ~ | ~ | ~ | ~ | ~ |
| Leonardo | 1948 | Rome, Italy | ~ | ~ | ~ | ~ | ~ | ~ |
Indonesia Defense Market Analysis
Growth Drivers
Rising defense budget aligned with Minimum Essential Force roadmap
Indonesia’s defense planning institutions expanded program approvals across maritime surveillance, air defense integration, and fleet sustainment during 2022, 2023, 2024, and 2025. Parliamentary defense commission sessions increased from 18 to 27 annually, accelerating approvals for multi-year contracts. The Ministry of Defense finalized 14 inter-ministerial coordination memoranda to streamline acquisition governance. TNI readiness exercises rose from 96 to 142 events across three services, increasing demand for platforms, spares, and training systems. Shipyard utilization rates improved at two state facilities, while 9 new depot-level maintenance lines were certified. These indicators signal execution capacity growth supporting sustained modernization priorities nationwide.
Maritime domain security requirements across archipelagic waters
Indonesia administers 17,000 islands and operates patrol coverage across 3 operational sea lanes. Between 2022 and 2025, naval patrol days increased from 21,400 to 28,700, while maritime air sorties rose from 6,300 to 9,100. The national maritime security tasking center expanded data fusion nodes from 4 to 9, improving ISR cueing for interdiction. Port security inspections climbed from 12,600 to 19,200 annually, reflecting elevated compliance activity. Fleet availability improved as average turnaround time at two naval bases fell from 46 to 31 days, enabling sustained presence and domain awareness operations across remote zones.
Challenges
Budget execution delays and procurement bureaucracy
Acquisition timelines remain constrained by multi-agency approvals and tender sequencing. Average contract award cycles extended from 214 days in 2022 to 287 days in 2024, with 2025 preliminary audits indicating 241 days despite procedural streamlining. Inter-ministerial sign-offs per program averaged 11, creating rework loops. Vendor prequalification queues grew from 63 to 104 applicants across key categories, slowing onboarding. Annual procurement appeals increased from 27 to 41 cases, diverting administrative capacity. Delivery acceptance testing backlogs expanded at three depots, pushing fielding schedules by 2 to 4 months and compressing training windows for operational units.
Technology transfer constraints in OEM partnerships
Offset execution faces limitations in absorptive capacity and IP scope. From 2022 to 2025, certified local engineers in avionics integration increased from 312 to 489, while composite manufacturing technicians grew from 146 to 238, lagging planned targets. Joint R&D projects approved annually declined from 9 to 6 due to licensing constraints. Local content verification audits increased from 18 to 33, revealing documentation gaps in 11 cases. Prototype-to-production transition cycles extended from 14 to 22 months at two facilities, delaying subsystem localization and sustaining reliance on imported engines, sensors, and mission computers for critical platforms.
Opportunities
Local production and offsets under domestic content rules
Domestic content policies incentivize licensed production and supplier localization. Between 2022 and 2025, vendor qualification for Tier-2 components expanded from 41 to 79 firms, while ISO-certified defense suppliers increased from 58 to 91. Apprenticeship intake at defense SOEs rose from 420 to 860 trainees, improving skills pipelines. Two new materials testing labs achieved accreditation, cutting validation lead times from 90 to 45 days. Offset compliance audits increased from 12 to 26 annually, clarifying localization pathways. These institutional shifts enable faster scale-up of assemblies, wiring harnesses, and structural components across programs.
Co-development programs with strategic partners
Co-development frameworks broaden access to design authority and exportable variants. From 2022 to 2025, bilateral defense cooperation working groups expanded from 5 to 11, while joint design reviews increased from 14 to 29 sessions annually. Digital engineering tool adoption across two primes rose from 22 to 67 active licenses, accelerating configuration control. Wind-tunnel and hydrodynamic test campaigns doubled from 18 to 36 runs per year, shortening validation cycles. Skilled exchange placements grew from 64 to 143 engineers, improving systems integration competencies and paving pathways for modular upgrades adaptable to regional operating environments and future mission sets.
Future Outlook
The market outlook emphasizes sustained modernization aligned with maritime security, ISR integration, and lifecycle sustainment priorities. Policy continuity, local content enforcement, and co-development frameworks are expected to strengthen domestic industrial capacity. Network-centric operations, unmanned systems adoption, and depot-level MRO localization will shape capability pathways. Regional security dynamics and interoperability needs will continue to guide procurement sequencing and partner selection.
Major Players
- PT Pindad
- PT PAL Indonesia
- PT Dirgantara Indonesia
- Thales
- Lockheed Martin
- Airbus Defence and Space
- BAE Systems
- Leonardo
- Rheinmetall
- Naval Group
- Saab
- Korea Aerospace Industries
- Hanwha Aerospace
- ASELSAN
- Indra Sistemas
Key Target Audience
- Ministry of Defense of the Republic of Indonesia
- Indonesian National Armed Forces TNI procurement directorates
- State-owned defense enterprises procurement units
- Prime contractors and tier-one subsystem integrators
- Fleet sustainment and MRO operators
- Systems integrators for C4ISR and EW
- Investments and venture capital firms
- National public procurement agency and defense offset authorities
Research Methodology
Step 1: Identification of Key Variables
Program approvals, fleet readiness indicators, patrol tempo, depot capacity, and certification throughput are identified across land, naval, air, cyber, and ISR domains. Policy instruments, offset compliance mechanisms, and supplier accreditation metrics frame variable selection. Institutional reporting cycles and audit trails guide variable normalization.
Step 2: Market Analysis and Construction
Operational tempo, base infrastructure utilization, and maintenance backlogs are synthesized with procurement pipelines. Capability gaps are mapped against platform age profiles and interoperability requirements. Domestic content pathways and co-development structures inform scenario construction.
Step 3: Hypothesis Validation and Expert Consultation
Program managers, logistics officers, and integration leads validate assumptions on readiness constraints and localization feasibility. Iterative reviews reconcile depot performance data with platform availability and training throughput. Governance workflows are tested against approval cycle evidence.
Step 4: Research Synthesis and Final Output
Findings are triangulated across institutional indicators, operational metrics, and policy instruments. Scenario narratives are refined for procurement sequencing and sustainment localization. Outputs prioritize actionable insights for program design, partnerships, and capability roadmaps.
- Executive Summary
- Research Methodology (Market Definitions and force structure mapping, Primary interviews with TNI stakeholders and MoD officials, Analysis of defense budget and procurement disclosures, Platform-level installed base and fleet inventory assessment)
- Definition and Scope
- Market evolution
- Usage and operational doctrines
- Ecosystem structure
- Supply chain and channel structure

- Growth Drivers
Rising defense budget aligned with Minimum Essential Force roadmap
Maritime domain security requirements across archipelagic waters
Modernization of aging air and naval fleets - Challenges
Budget execution delays and procurement bureaucracy
Technology transfer constraints in OEM partnerships
Dependence on imported subsystems and engines - Opportunities
Local production and offsets under domestic content rules
Co-development programs with strategic partners
ISR and maritime surveillance system expansion - Trends
Shift toward network-centric and C4ISR integration
Fleet life-extension and mid-life upgrades
Increased adoption of UAVs and UUVs - Government Regulations
- SWOT Analysis
- Porter’s Five Forces
- By Value, 2020–2025
- By Volume, 2020–2025
- By Active Systems, 2020–2025
- By Average Selling Price, 2020–2025
- By Domain (in Value %)
Land systems
Naval platforms
Air platforms
Space and ISR assets
Cyber and electronic warfare - By Capability (in Value %)
Combat platforms
C4ISR systems
Air defense and missile systems
Unmanned systems
Logistics and sustainment - By Procurement Type (in Value %)
New acquisition
Mid-life upgrade and modernization
Maintenance, repair, and overhaul
Training and simulation
Ammunition and consumables - By Platform Origin (in Value %)
Domestic manufacturing
Licensed production and co-development
Direct imports
- Market share of major players
- Cross Comparison Parameters (platform breadth, local content compliance, technology transfer depth, lifecycle support capability, pricing competitiveness, delivery timelines, financing options, combat-proven references)
- SWOT Analysis of Key Players
- Pricing and Commercial Model Benchmarking
- Detailed Profiles of Major Companies
PT Pindad
PT PAL Indonesia
PT Dirgantara Indonesia
Thales
Lockheed Martin
Airbus Defence and Space
BAE Systems
Leonardo
Rheinmetall
Naval Group
Saab
KAI
Hanwha Aerospace
ASELSAN
Indra Sistemas
- Demand and utilization drivers
- Procurement and tender dynamics
- Buying criteria and vendor selection
- Budget allocation and financing preferences
- Implementation barriers and risk factors
- By Value, 2026–2035
- By Volume, 2026–2035
- By Active Systems, 2026–2035
- By Average Selling Price, 2026–2035


 Request a Sample
 Ask for Customization
 Get a Quote
 Enquire Now