
 Download PDF
 Download PDF
Market Overview
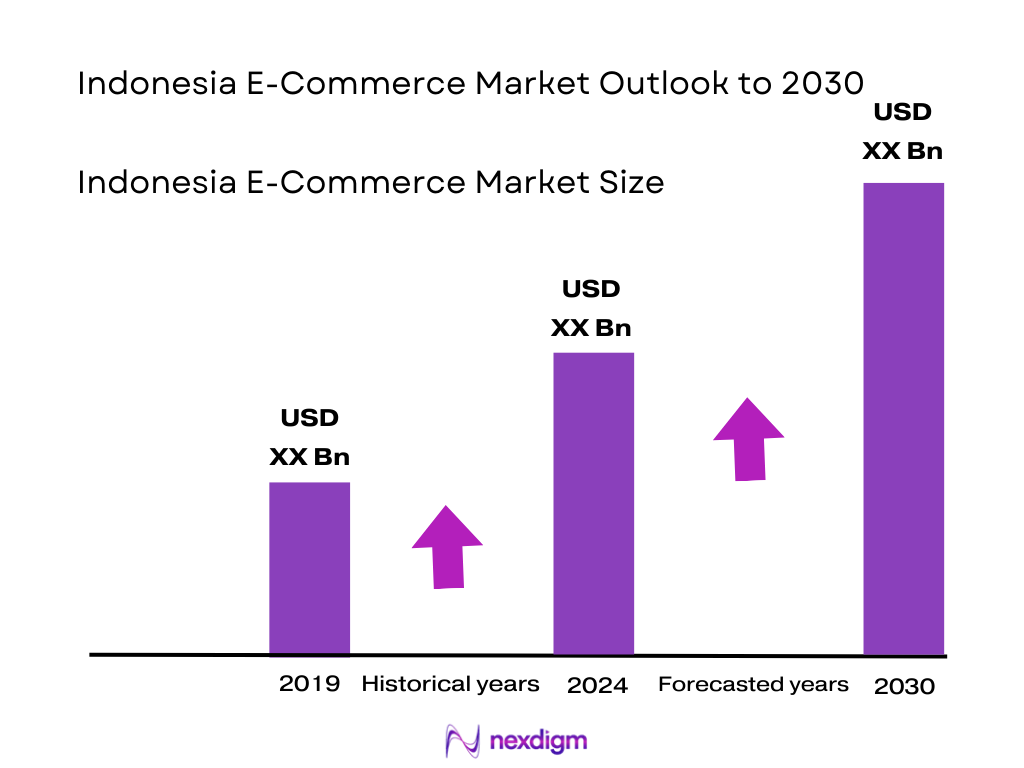
The Indonesia e‑commerce market is valued at USD 75.1 billion. This reflects robust digital adoption and rapidly expanding online consumption. A complementary GMV estimate places it around USD 73 billion. Growth is driven by rising smartphone and internet penetration, increasing disposable incomes, and enhanced logistics and payment infrastructure, enabling broader access and convenience.
Java—especially Jakarta—leads the market due to its dense population, advanced digital infrastructure, and high purchasing power. Sumatra, Kalimantan, and Sulawesi are emerging as high-potential regions, supported by improving internet connectivity, growing middle-class income, and expanding logistics frameworks.
Market Segmentation
By Product Category
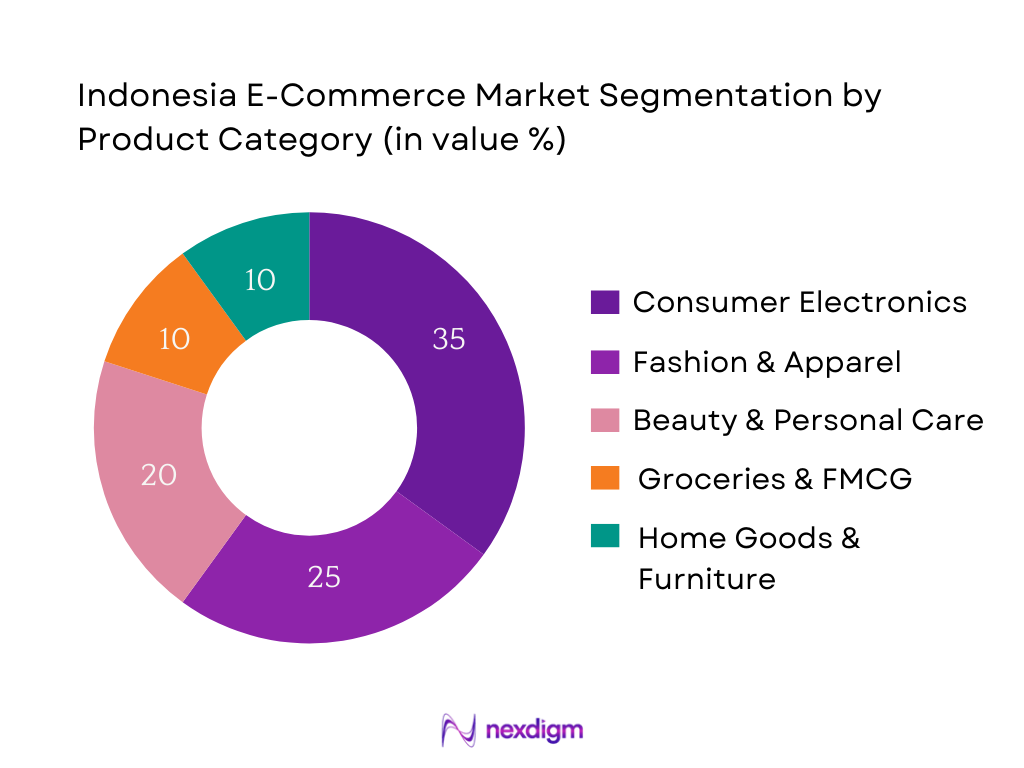
Indonesia’s e‑commerce market is segmented into several verticals including Consumer Electronics, Fashion & Apparel, Beauty & Personal Care, Groceries & FMCG, Home & Living. Consumer Electronics holds the largest share—35% in 2024—driven by high demand for smartphones, laptops, and accessories, as tech becomes essential in daily life and remote work scenarios. Meanwhile, Fashion & Apparel continues to thrive, propelled by strong consumer preferences shaped by trends and influencer marketing, especially among younger demographics. Groceries & FMCG is rapidly growing due to rising urban convenience needs and improving cold‑chain logistics. Beauty & Personal Care benefits from the prevalence of social commerce and online tutorials, while Home Goods gain traction as families seek convenience and variety through digital platforms.
By Payment Method
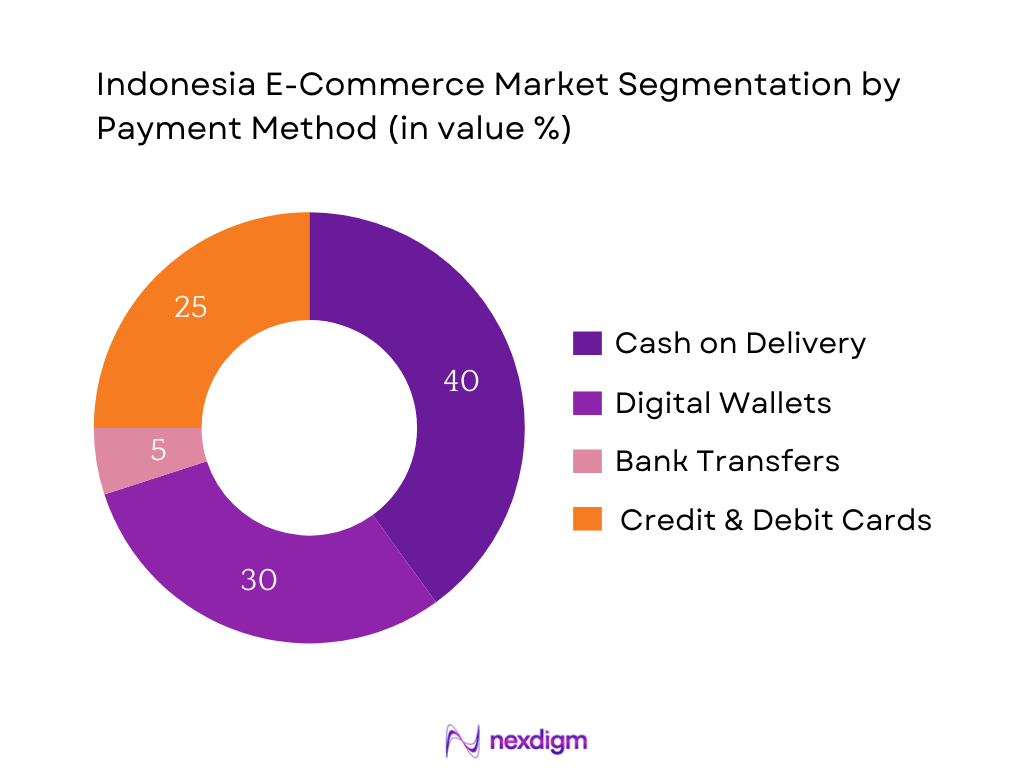
The market is segmented into Cash on Delivery (COD), Digital Wallets, Bank Transfers, and Cards. Cash on Delivery remains dominant, particularly valued in rural and lower‑trust environments, offering convenience and confidence to first‑time online buyers. Meanwhile, Digital Wallets like GoPay, OVO, DANA, and ShopeePay are the fastest‑growing segment, especially in urban centers, thanks to seamless mobile experiences, cashback incentives, and integration with app ecosystems. Bank Transfers and Cards make up smaller portions, often used for higher‑value purchases or by tech‑savvy consumers, though their adoption is gradually increasing as trust in digital payments improves.
Competitive Landscape
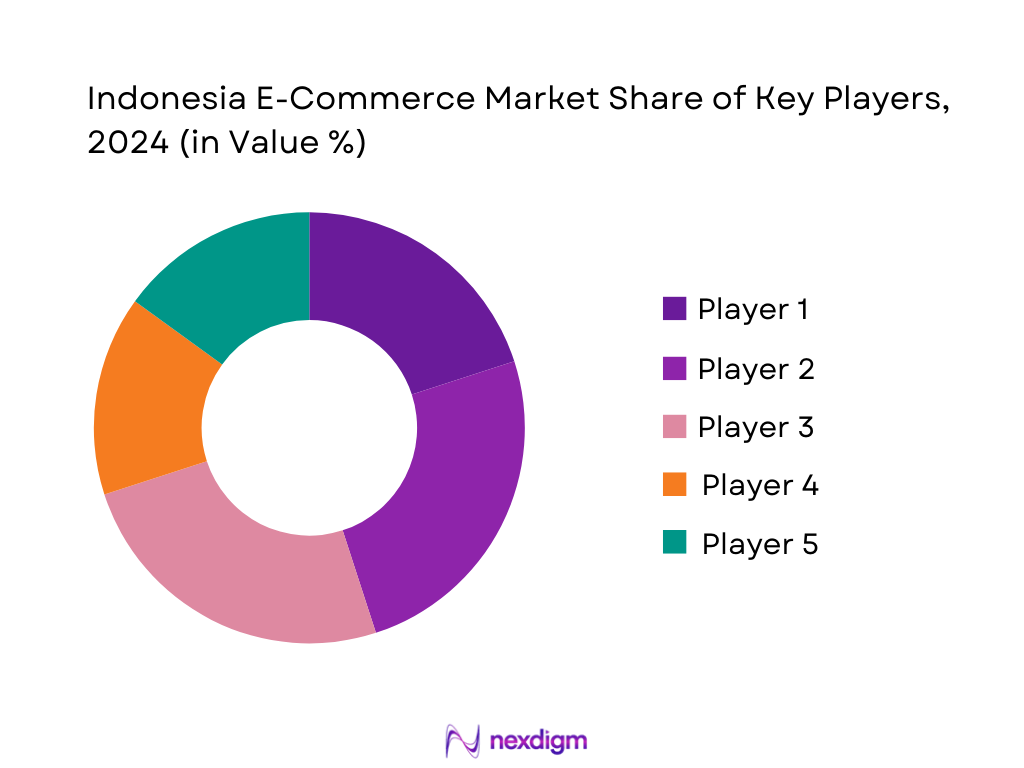
Indonesia’s e‑commerce market is dominated by a handful of large platforms, such as Shopee, Tokopedia, Lazada, Bukalapak, and Blibli. This consolidation underscores the influence of these major players, reflecting network effects in logistics, payments, and seller ecosystems.
| Company | Establishment Year | Headquarters | Key Parameter 1 | Key Parameter 2 | Key Parameter 3 | Key Parameter 4 | Key Parameter 5 | Key Parameter 6 |
| Shopee | 2015 (Sea Group) | Jakarta | – | – | – | – | – | – |
| Tokopedia | 2009 | Jakarta | – | – | – | – | – | – |
| Lazada | 2012 (Alibaba) | Jakarta | – | – | – | – | – | – |
| Bukalapak | 2010 | Jakarta | – | – | – | – | – | – |
| Blibli | 2011 | Jakarta | – | – | – | – | – | – |
Indonesia E-Commerce Market Analysis
Growth Drivers
Smartphone & Internet Penetration
Indonesia’s online retail flywheel turns on a vast connected base: the country counts 283,487,931 people and 221,563,479 internet users, giving merchants unmatched reach and sellers a steady funnel of new buyers. On the supply side, network build-out underpins always-on shopping: BAKTI reports 5,321 operational 4G BTS in remote locations, enhancing app reliability in last-mile areas and shrinking “offline” pockets that once stalled checkouts. These hard counts show why product discovery increasingly begins on a screen and why sellers can scale nationally from day one—because digital demand now exists from Java’s metros to outer-island districts.
QRIS & Digital Payments
Checkout conversion benefits from the ubiquity of Bank Indonesia’s QRIS rails. As of late-year policy briefings, QRIS counted 52,550,000 users and 33,770,000 merchants (August) and rose to 54,100,000 users and 34,700,000 merchants (October), reflecting deep acceptance among micro and formal sellers alike. These are not shares—they are raw counts that translate into fewer cart abandons and broader acceptance for everything from groceries to high-ticket electronics. Together with a wholesale backbone hosting 134 BI-RTGS participants, this density ensures continuity when volumes spike during mega-campaigns, enabling faster funds availability for marketplace sellers and MSMEs.
Market Challenges
High RTO (Return-to-Origin)
Geography and addressing complexity elevate first-attempt failure risk, pushing reships and RTOs. The archipelago spans 17,380 named islands, dispersing demand across sea lanes and air bridges. BPS’s PODES census counts 84,276 village-level administrative areas across 7,281 sub-districts and 514 regency/city governments, illustrating the sheer number of locality formats couriers must parse. Even with robust arterials—2,893 km of toll roads—outer-island lanes still pivot on ferry schedules and weather windows. Each missed drop compounds handling days and customer service touches. These structural counts explain why address intelligence, localized 3PL routing, and dynamic COD/QRIS flows are essential to bend RTO down.
Fraud
Trust frictions manifest in measurable incidents across payments and commerce. OJK disclosed consumer losses from illegal financial scams reaching Rp2.5 trillion, while its portal logged 17,003 consumer complaints between 1 January–31 July, with fintech and banking leading volumes—pressure points that spill into e-commerce checkouts and disbursements. National cyber-defense monitoring recorded 122,790,000 cyber attack anomalies in January–August, and 403,990,813 anomalies in the prior full year, underscoring a high-noise environment for account takeovers, fake stores, and phishing. These raw incident counts justify heavier KYC at seller onboarding, mandatory 2FA, and escrow/repudiation safeguards to protect buyers.
Market Opportunities
Category White Space
Large, quantifiable product universes remain under-served online. BPS records 125,305,332 registered motorcycles—each needs consumables and spares—forming a massive aftermarket ripe for SKU long-tailing and scheduled replenishment. MSMEs, the country’s commercial backbone, number 66,400,000+ units; onboarding programs are steadily funneling warungs and specialty sellers onto marketplaces, expanding assortment in groceries, crafts, and professional supplies. With 283,487,931 consumers and a flourishing QRIS acceptance base (over 33,770,000 merchants), sellers can bring niche categories online, from two-wheeler parts to regional fashion and home-improvement SKUs, backed by clear counts that validate TAM without using revenue estimates.
Rural Enablement
Connectivity and acceptance rails in non-metro areas already show scale. BAKTI cites 5,321 operational 4G BTS in remote zones, shrinking blackspots that once blocked checkout and delivery apps. Village-level administration reaches 84,276 units, offering a defined scaffold for PUDO lockers, micro-FCs, and community agents. QRIS’s merchant base above 33,770,000 means rural kiosks can receive digital payments—crucial for COD-to-prepaid migration. With 2,893 km of toll roads accelerating trunk movement into provincial capitals, the opportunity is to stitch rural spokes with scheduled milk-runs and offline-to-online seller onboarding, leveraging these hard counts rather than projections to justify investment.
Future Outlook
Over the next years, the Indonesia e-commerce market is expected to continue its robust expansion, fueled by rising digital literacy, deeper mobile penetration, and improved logistics and payment infrastructure. Platforms will increasingly leverage live commerce, AI personalization, and integrated financial services to capture deeper consumer engagement and higher basket values. Regional tier-2 and tier-3 cities—having seen rapid digital adoption—will be focal points, while B2B and grocery segments will further mature, offering diversification beyond core categories.
Major Players
- Shopee (Sea Group)
- Tokopedia
- Lazada Indonesia
- Bukalapak
- Blibli
- id
- Zalora Indonesia
- Bhinneka
- Ralali
- GudangAda
- Orami
- Sociolla
- Mapemall
- Indomaret Klik
- Akulaku
Key Target Audience
- E-Commerce Platform Executives
- Retail & Consumer Brands (local and global)
- Venture Capital & Investment Firms
- Payment & Logistics Service Providers
- Digital Payment Providers (e-wallets, BNPL)
- E-Commerce Regulators & Governmental Bodies (e.g., Kementerian Perdagangan, OJK)
- UMKM Digital Enablers & Aggregators
- Cross-border Trade Facilitators
Research Methodology
Step 1: Identification of Key Variables
We began by mapping all key ecosystem stakeholders—platforms, sellers, payment providers, and logistics players—using comprehensive desk research from secondary sources such as government data (BPS), industry reports, and platform disclosures. The goal was to define critical variables influencing market size and structure.
Step 2: Market Analysis and Construction
Historical data on GMV, order volume, AOV, and payment method shares were collated from reputable publishers. We analyzed platform-level financials where available, triangulated with macro indicators like internet penetration and GDP per capita to quantify revenue and activity trends.
Step 3: Hypothesis Validation and Expert Consultation
We formulated hypotheses on growth drivers (e.g., mobile adoption, regional expansion) and tested them through CATI interviews with industry experts from major e-commerce platforms, logistics firms, and digital payments providers—gaining operational and financial perspectives to refine assumptions.
Step 4: Research Synthesis and Final Output
Finally, engagements with select platforms and enablers enabled validation of segment-level insights—such as category performance, payment mix shifts, and regional penetration—ensuring our bottom-up data aligned with real-world business realities.
- Executive Summary
- Research Methodology (Market Definitions & Scope, Abbreviations, Market Sizing Approach, Top-down & Bottom-up Triangulation, Demand-side & Supply-side Primary Research, Expert Interviews with Platforms & Sellers, Data Sources – BPS/APJII/BI, Forecasting Framework, Limitations)
- Definition & Scope
- Market Evolution & Milestones
- Timeline of Major Developments
- Business Cycle Analysis
- Supply Chain & Value Chain Mapping

- Growth Drivers (Smartphone & Internet Penetration, QRIS & Digital Payments, Logistics Density, UMKM Digitization, Live Commerce Adoption, Cross-border Expansion)
- Market Challenges (High RTO, Fraud, SLA in Outer Islands, Subsidy Cuts, Customs Delays)
- Market Opportunities (Category White Space, Rural Enablement, Private Labels, B2B Restocking, Embedded Finance)
- Trends (Pay-for-Performance Ads, Creator Commerce, AI Search & Personalization, Sustainable Packaging)
- Government Regulations (GR 80 PMSE, MOT 31, PDP Law, E-commerce VAT, Data Localization)
- SWOT Analysis
- Stakeholder Ecosystem (Platforms, 3PL/CEP, Payment PJPs, BNPL, UMKM, Regulators)
- Porter’s Five Forces Analysis
- By Value (GMV), 2019-2024
- By Orders (Volume), 2019-2024
- By Average Order Value (AOV), 2019-2024
- By Take-Rate, 2019-2024
- By Platform Model (In Value %)
Marketplace
Retail/1P
Social Commerce/Live
D2C
O2O
B2B Wholesale
Quick Commerce - By Product Category (In Value %)
Electronics & Mobiles
Fashion & Apparel
Beauty & Personal Care
Groceries & FMCG
Home & Living
Automotive Spares
Baby/Kids/Toys
Digital Goods/Top-ups - By Fulfilment Model (In Value %)
Seller-fulfilled
Platform-fulfilled
Cross-dock
Dark-store
Drop-ship
By Customer Cohort
New vs Repeat
Age Bands
Income Bands
Urban vs Rural
PayLater users
COD users - By Seller Cohort (In Value %)
UMKM Micro/Mini
SMB
Enterprise/Brand Flagship
Cross-border merchants
Aggregators/Enablers - By Region/City Tier (In Value %)
Jabodetabek
Java non-JKT
Sumatra
Kalimantan incl. IKN
Sulawesi
Bali–Nusa Tenggara
Maluku–Papua
Tier-1/2/3 cities - By Payment Instrument (In Value %)
E-wallets
BNPL
VA/Bank transfer
Cards
COD - By Delivery SLA (In Value %)
Instant ≤2h
Same-day
Next-day
Economy 2–5 days
Pickup/locker
- Market Share of Major Players (By GMV, By Orders, By Category, By Region)
- Cross-Comparison Parameters (GMV, Orders, AOV, Take-rate, Active Sellers, Same-day Coverage, Live-commerce Share, Ad ARPU)
- SWOT of Major Players
- Pricing & Fee Structure Analysis (Commission, MDR, Shipping Fees, Ad Costs)
- Detailed Profiles of Major Companies
Shopee (Sea Group)
Tokopedia × TikTok Shop
Lazada Indonesia
Bukalapak
Blibli
Zalora Indonesia
Bhinneka
Ralali
GudangAda
Orami
Sociolla
Mapemall
Indomaret Klik
Alfagift/Alfamart Klik
Akulaku
- Penetration by Cohort
- Frequency & Basket
- Device Usage
- Payment Preferences
- Urban vs Non-Urban Patterns
- Pain Points
- By Value (GMV), 2025-2030
- By Orders (Volume), 2025-2030
- By Average Order Value (AOV), 2025-2030
- By Take-Rate, 2025-2030


 Request a Sample
 Ask for Customization
 Get a Quote
 Enquire Now