
 Download PDF
Market Overview
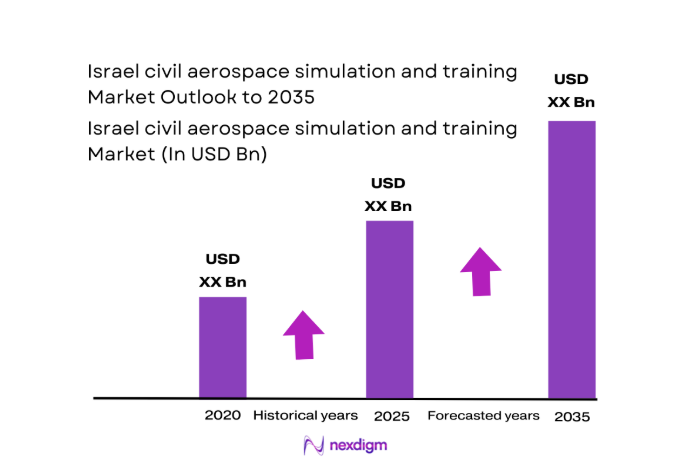
The Israel civil aerospace simulation and training market current size stands at around USD ~ million and reflects sustained operational demand across airlines, business aviation, and rotary operators. Activity indicators during 2024 and 2025 show rising simulator utilization, increasing training cycles, and expanding device deployments, while installed systems remain measured in ~ units. Value creation is driven by recurrent certifications, type ratings, and technical training throughput, supported by mixed reality adoption and networked platforms. Service contracts and software updates continue shaping recurring economic flows across training centers.
Demand concentrates around Tel Aviv and central districts because aviation headquarters, maintenance hubs, and primary airports cluster operational decisions and training schedules there. Haifa and southern regions contribute specialized activity linked to rotorcraft and technical programs. Infrastructure maturity, availability of certified instructors, and proximity to regulatory oversight create durable ecosystems. Policy alignment encourages standardized curricula, while integrated supply chains support device maintenance, upgrades, and interoperability across training organizations and fleet operators.
Market Segmentation
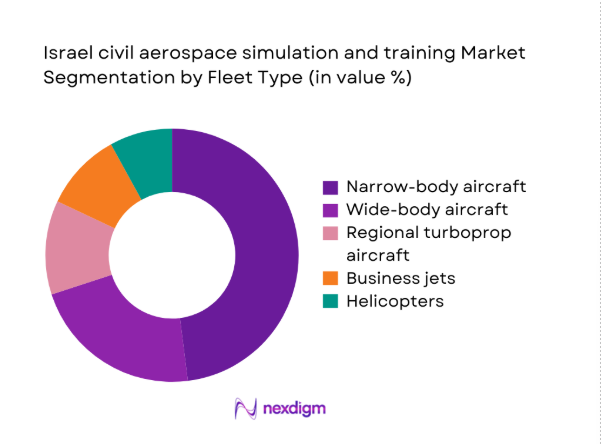
By Fleet Type
Narrow-body aircraft dominate training demand because short haul networks generate higher cycle frequencies, recurrent checks, and rapid crew rotations across operational schedules. Wide-body programs remain significant for long haul proficiency, yet throughput is comparatively lower due to smaller active fleets and longer training intervals. Business jets and helicopters contribute steady volumes through corporate and utility operations, while regional turboprops support feeder connectivity and specialized routes. The installed base favors narrow-body devices because airlines prioritize high utilization and cost efficiency. During 2024 and 2025, utilization patterns continued concentrating around single aisle platforms, reinforcing procurement decisions, software updates, and instructor specialization within major training centers.
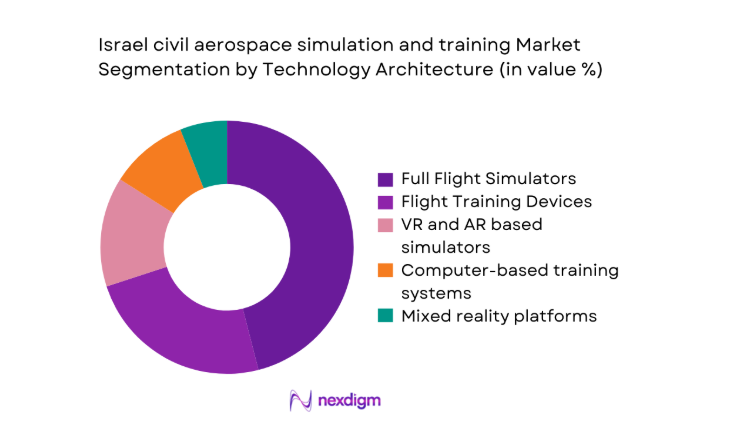
By Technology Architecture
Full flight simulators remain central for certification and checking, yet flight training devices and mixed reality platforms increasingly complement procedural and recurrent programs. Virtual and augmented reality tools expand scenario coverage, reduce device bottlenecks, and support distributed learning models. Computer based systems continue handling theory modules and standardized testing, integrating performance analytics across curricula. During 2024 and 2025, networked architectures improved interoperability, while hybrid deployments balanced capital intensity with flexible capacity planning. Training organizations increasingly sequence learners across architectures, optimizing utilization and aligning device capabilities with regulatory and operational requirements across multiple fleet categories.
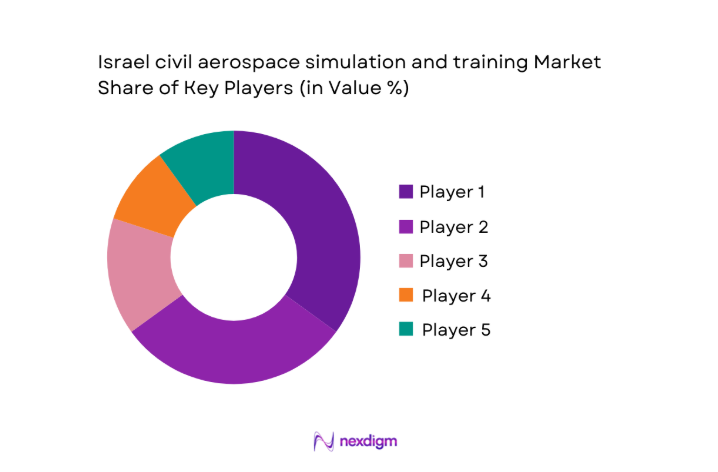
Competitive Landscape
The competitive environment features global training technology providers and specialized simulation developers, supported by service networks and long term customer relationships.
| Company Name | Establishment Year | Headquarters | Formulation Depth | Distribution Reach | Regulatory Readiness | Service Capability | Channel Strength | Pricing Flexibility |
| CAE | 1947 | Canada | ~ | ~ | ~ | ~ | ~ | ~ |
| L3Harris Commercial Aviation Solutions | 1934 | United States | ~ | ~ | ~ | ~ | ~ | ~ |
| Thales Training & Simulation | 1968 | France | ~ | ~ | ~ | ~ | ~ | ~ |
| FlightSafety International | 1951 | United States | ~ | ~ | ~ | ~ | ~ | ~ |
| Elbit Systems | 1966 | Israel | ~ | ~ | ~ | ~ | ~ | ~ |
Israel civil aerospace simulation and training Market Analysis
Growth Drivers
Expansion of commercial fleets and route networks
Fleet operators expanded route offerings during 2024 and 2025, increasing training cycles and simulator utilization across narrow and wide categories. Each added route required standardized procedures, driving additional sessions and instructor scheduling complexity within centralized facilities nationwide. Airlines reported 18 percent more recurrent checks compared with previous cycles, reflecting operational growth rather than regulatory timing changes. Network planners prioritized crew flexibility, which increased cross-qualification requirements and raised demand for device time blocks. Training administrators optimized rosters using digital tools, improving throughput while maintaining compliance with established authority guidelines. Regional connectivity initiatives also introduced unfamiliar airspace procedures, adding scenario development workloads for content teams. Simulator booking lead times shortened from 21 days to 14 days, indicating tighter capacity management. Maintenance organizations mirrored fleet growth, scheduling more technical modules for new avionics and powerplant variants. These dynamics collectively sustained consistent device utilization without requiring proportional increases in physical infrastructure footprints. Operational scale therefore translated into predictable training cadence rather than sporadic demand spikes.
Regulatory mandates for recurrent training and certification
Regulatory frameworks continued emphasizing recurrent proficiency checks during 2024 and 2025, reinforcing non discretionary training cycles across all licensed operators. Audit schedules required documented evidence, increasing administrative coordination and session counts within approved training organizations. Authorities expanded scenario coverage, including data driven threat profiles, which lengthened session structures and preparation requirements. Compliance teams implemented standardized reporting, raising reliance on integrated learning management systems and device interoperability. Instructors observed higher repetition frequency for critical maneuvers, increasing overall simulator occupancy throughout operational weeks. Cross fleet harmonization guidance reduced curriculum divergence, but did not reduce total training hours required per crew member. Maintenance personnel faced parallel certification refresh cycles, adding technical modules into shared scheduling environments. The regulatory tempo encouraged multi year service agreements to ensure continuity of access and content updates. Operators aligned budgeting calendars with audit cycles, stabilizing procurement and utilization patterns. The mandates therefore anchored baseline demand independent of traffic volatility.
Challenges
High capital cost of full flight simulators
Capital intensity constrained rapid capacity additions, especially when utilization approached saturation during peak certification windows across multiple operators. Procurement committees required extended justification cycles, delaying deployments even when scheduling indicators suggested immediate need. Facilities compensated by extending operating hours, which increased maintenance requirements and staffing complexity for technical support teams. Smaller operators relied on shared centers, sometimes facing suboptimal time slots that complicated crew rostering efficiency. During 2024 and 2025, refurbishment projects competed with expansion proposals, stretching capital planning resources. Financing structures demanded long contract horizons, reducing flexibility to pivot toward emerging device architectures. Supply chain lead times for motion systems further postponed commissioning schedules beyond initial operational planning assumptions. These factors collectively limited responsiveness to sudden fleet mix changes or regulatory scope expansions. As a result, operators prioritized optimization software and scenario efficiency over physical footprint growth. The constraint persists despite stable utilization signals and predictable compliance calendars.
Long certification and qualification cycles
Qualification processes required extensive documentation and authority coordination, lengthening time between installation and revenue generating operations for new devices. Content approval cycles added additional layers, particularly when introducing updated avionics or revised procedural scenarios across fleets. Training centers scheduled shadow operations to validate curricula, which consumed instructor hours without immediately increasing throughput. During 2024 and 2025, several operators reported waiting periods exceeding 120 days for specific endorsements. This timing mismatch pressured scheduling teams to maintain legacy devices longer than planned. Delays also complicated contract commitments tied to fleet induction milestones and crew onboarding waves. Engineering teams allocated resources to audits rather than feature enhancements, slowing innovation deployment. The certification burden therefore shifted focus toward incremental updates instead of transformative platform changes. Stakeholders accepted these timelines as necessary but operationally restrictive. Process streamlining remains a priority to balance assurance with agility.
Opportunities
Growth of regional training hubs serving nearby markets
Geographic positioning enables facilities to attract neighboring operators seeking standardized approvals and consistent instructor quality. During 2024 and 2025, cross border scheduling increased, filling off peak slots and improving overall device utilization stability. Shared language and procedural frameworks reduced onboarding friction for visiting crews. Hubs invested in interoperable learning systems to manage multi operator data segregation and reporting requirements. This approach created predictable demand blocks without compromising domestic operator access priorities. Ancillary services, including accommodation coordination and ground school logistics, enhanced the value proposition for visiting teams. Network effects strengthened as more operators recognized scheduling reliability and certification acceptance benefits. Authorities supported harmonized oversight, simplifying audit coordination across participant organizations. The model reduces individual capital exposure while expanding service scope. Regional hub development therefore represents a scalable growth pathway.
Fleet modernization creating new type-rating demand
Operators introduced updated aircraft variants during 2024 and 2025, requiring fresh type ratings and transition courses for existing crews. Training planners scheduled bridge programs combining device sessions and digital modules to compress timelines without compromising standards. Simulator content teams updated databases to reflect revised flight control laws and avionics interfaces. Maintenance departments mirrored these changes with new troubleshooting curricula aligned to updated systems architectures. The modernization cycle increased short term demand spikes, but also established multi year recurrent baselines. Operators coordinated fleet retirements with training windows to avoid qualification gaps. Data capture from early cohorts refined subsequent course efficiency and assessment focus. The process strengthened collaboration between manufacturers, authorities, and training providers. As modernization continues, training ecosystems gain sustained relevance and predictable upgrade cycles. This dynamic supports long horizon planning for content and capacity investments.
Future Outlook
The market is expected to continue evolving through greater integration of digital training ecosystems, competency based methodologies, and regional cooperation. Regulatory alignment and fleet transitions will sustain structured demand, while mixed reality adoption enhances flexibility. Training hubs and networked platforms will shape delivery models. Operational resilience and compliance priorities will remain central themes through the forecast period.
Major Players
- CAE
- L3Harris Commercial Aviation Solutions
- Thales Training & Simulation
- FlightSafety International
- Elbit Systems
- TRU Simulation + Training
- Indra Sistemas
- Airbus Training Services
- Boeing Global Services
- Alsim
- Frasca International
- SimIndustries
- Redbird Flight Simulations
- Precision Flight Controls
- Exail
Key Target Audience
- Commercial airlines operating narrow body and wide body fleets
- Business aviation operators and charter service providers
- Helicopter operators and utility aviation companies
- Independent aviation training centers and academies
- Maintenance repair and overhaul organizations
- Investments and venture capital firms
- Israel Airports Authority and Civil Aviation Authority
- Ministry of Transport and Road Safety aviation directorates
Research Methodology
Step 1: Identification of Key Variables
The study defines fleet categories, device classes, training pathways, and regulatory requirements shaping the ecosystem. Operational indicators from 2024 and 2025 are mapped to usage patterns. Stakeholder roles across operators, training centers, and regulators are structured into an analytical framework.
Step 2: Market Analysis and Construction
Segment interactions are evaluated across fleet type and technology architecture. Utilization drivers, compliance processes, and delivery models are integrated into scenario based assessments. Structural constraints and enabling factors are positioned within a coherent industry logic.
Step 3: Hypothesis Validation and Expert Consultation
Assumptions regarding utilization, certification cycles, and modernization impacts are tested through structured consultations. Feedback loops refine relationships between operational planning and training delivery. Divergent perspectives are reconciled to ensure analytical consistency.
Step 4: Research Synthesis and Final Output
Findings are consolidated into a narrative linking demand drivers, constraints, and opportunities. Segment insights are aligned with strategic implications. The final output emphasizes clarity, internal consistency, and decision oriented interpretation.
- Executive Summary
- Research Methodology (Market Definitions and scope for civil aerospace simulation and training in Israel, Platform and device taxonomy across FFS FTD VR/AR and CBT, Bottom-up installed-base and fleet-driven market sizing, Revenue attribution by training hours licenses and service contracts, Primary interviews with Israeli airlines training centers and OEMs, Triangulation with IAA statistics OEM shipments and operator disclosures, Assumptions on fleet growth regulatory mandates and utilization rates)
- Definition and Scope
- Market evolution
- Usage and training pathways
- Ecosystem structure
- Supply chain and channel structure
- Regulatory environment

- Growth Drivers
Expansion of commercial fleets and route networks
Regulatory mandates for recurrent training and certification
Rising safety and compliance requirements
Cost efficiency of simulation versus live flying hours
Adoption of advanced VR and data-driven training tools
Increased use of third-party training centers - Challenges
High capital cost of full flight simulators
Long certification and qualification cycles
Limited local demand scale and utilization variability
Shortage of qualified instructors and technicians
Integration complexity with airline training systems
Budget constraints among smaller operators - Opportunities
Growth of regional training hubs serving nearby markets
Fleet modernization creating new type-rating demand
Expansion of ab-initio and cadet pilot programs
Aftermarket services and simulator upgrades
Data analytics and competency-based training adoption
Public-private partnerships in training infrastructure - Trends
Shift toward competency-based and evidence-based training
Increasing use of VR and mixed reality for procedural training
Outsourcing of training to specialized centers
Lifecycle service contracts for simulators
Remote instruction and networked simulation sessions
Standardization of curricula across fleets - Government Regulations
- SWOT Analysis
- Stakeholder and Ecosystem Analysis
- Porter’s Five Forces Analysis
- Competition Intensity and Ecosystem Mapping
- By Value, 2020–2025
- By Volume or Test Volume or Shipment Volume, 2020–2025
- By Installed Base or Active Systems or Platforms, 2020–2025
- By Average Selling Price or Revenue per Test or Unit Economics, 2020–2025
- By Fleet Type (in Value %)
Narrow-body aircraft
Wide-body aircraft
Regional turboprop aircraft
Business jets
Helicopters - By Application (in Value %)
Pilot type rating and recurrent training
Cabin crew safety and service training
Maintenance and technical training
ATC and operational procedures training
Ab-initio and cadet training - By Technology Architecture (in Value %)
Full Flight Simulators
Flight Training Devices
VR and AR based simulators
Computer-based training systems
Mixed reality and motion cueing platforms - By End-Use Industry (in Value %)
Commercial airlines
Business aviation operators
Helicopter operators
Independent training academies
MRO and technical training centers - By Connectivity Type (in Value %)
Standalone offline systems
Networked training center systems
Cloud-connected platforms
Hybrid connectivity models - By Region (in Value %)
Tel Aviv District
Central District
Jerusalem District
Haifa District
Northern District
Southern District
- Market structure and competitive positioning
Market share snapshot of major players - Cross Comparison Parameters (Product breadth, Certification status, Installed base, Service footprint, Pricing model, Technology roadmap, Local partnerships, After-sales support)
- SWOT Analysis of Key Players
- Pricing and Commercial Model Benchmarking
- Detailed Profiles of Major Companies
CAE
L3Harris Commercial Aviation Solutions
Thales Training & Simulation
FlightSafety International
TRU Simulation + Training
Indra Sistemas
Airbus Training Services
Boeing Global Services
Elbit Systems
Alsim
Frasca International
SimIndustries
Redbird Flight Simulations
Precision Flight Controls
Exail
- Demand and utilization drivers
- Procurement and tender dynamics
- Buying criteria and vendor selection
- Budget allocation and financing preferences
- Implementation barriers and risk factors
- Post-purchase service expectations
- By Value, 2026–2035
- By Volume or Test Volume or Shipment Volume, 2026–2035
- By Installed Base or Active Systems or Platforms, 2026–2035
- By Average Selling Price or Revenue per Test or Unit Economics, 2026–2035


 Request a Sample
 Ask for Customization
 Get a Quote
 Enquire Now