
 Download PDF
 Download PDF
Market Overview
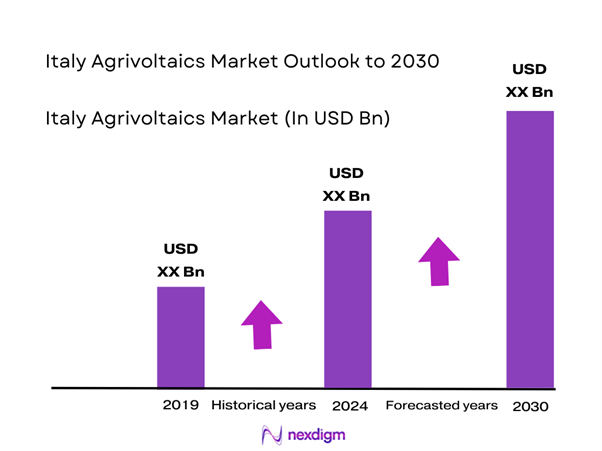
The Italy Agrivoltaics market is being shaped less by “organic” rooftop-style demand and more by policy-backed utility-scale execution: Italy’s agrivoltaic support scheme approved at EUR ~ billion is explicitly designed to accelerate dual-use PV deployment, targeting ~ GW of new agrivoltaic capacity and at least ~ GWh of annual electricity generation under a CfD-style mechanism plus capex support. In the prior year, the broader national package also included EUR ~ billion across agrivoltaics and agro-industrial development, anchoring bankability for developers and landowners.
Agrivoltaics execution in Italy concentrates where permitting momentum, irradiation quality, and large parcel availability intersect—especially Sicily, Apulia, Campania, Lazio, and Emilia-Romagna. Auction outcomes underline this clustering: the first national agrivoltaics tender selected ~ projects totaling ~ GW, with a strong southern skew, while Sicily and Apulia emerged as consistent high-absorption regions (auction allocations reported at ~ MW for Sicily and ~ MW for Apulia in the same results cycle). These locations combine scale-ready agricultural landbanks, strong solar resource, and developer ecosystems that can carry complex agronomic + grid compliance.
Market Segmentation
By Agrivoltaic Configuration
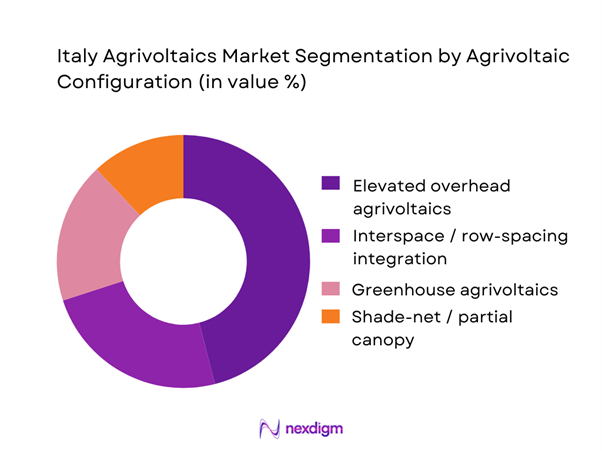
Italy Agrivoltaics is segmented by configuration into elevated overhead (“advanced” agri-PV), interspace/row-spacing integration, greenhouse agrivoltaics, and shade-net / partial canopy systems. Recently, elevated overhead agrivoltaics holds a dominant market share under configuration because it best aligns with Italy’s compliance direction (keeping agricultural continuity measurable), preserves machinery access (row clearance, turning radius), and reduces litigation risk versus “PV-first” ground-mount perceptions. It also de-risks financing: lenders prefer repeatable structural typologies with auditable agronomic monitoring, making overhead systems more bankable for multi-MW farms in Sicily/Apulia/Campania. EPCs can standardize pile foundations, tracker/bifacial layouts, and O&M regimes while agronomic partners retain workable cultivation plans (vineyards, horticulture, forage).
By Crop Collaboration Type
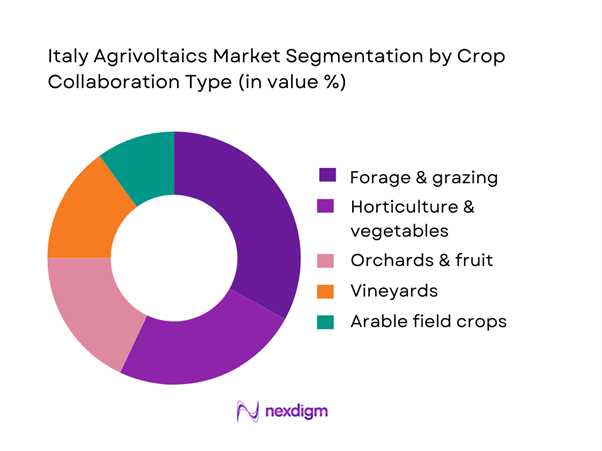
Italy Agrivoltaics is segmented by crop collaboration into horticulture & vegetables, orchards & fruit, vineyards, forage & grazing, and arable field crops. Recently, forage & grazing dominates market share under crop collaboration because it is the fastest pathway to “agricultural continuity” at scale: grazing under PV reduces vegetation management cost, supports soil cover, and typically requires fewer crop-cycle interventions than specialty produce—critical for utility-scale portfolios moving through auctions and grid queues. Developers can sign multi-year grazing agreements with local livestock operators and demonstrate measurable agricultural activity with simpler KPIs (stocking days, pasture management logs). This lowers compliance friction, accelerates acceptance at municipal/provincial level, and shortens the ramp from notice-to-proceed to steady-state operations compared with orchard/vineyard retrofits that need crop-specific shading optimization and more intensive agronomy monitoring.
Competitive Landscape
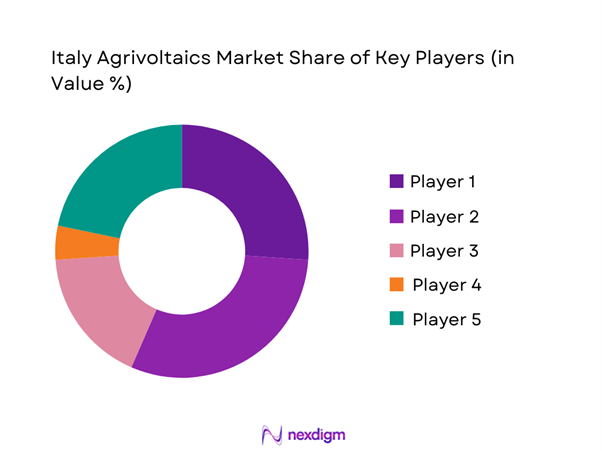
The Italy Agrivoltaics market is consolidating around a mix of Italian utilities/IPP champions and international developers that can execute permitting, grid access, agronomic compliance, and bid strategy under incentive tenders. Auction-driven capacity allocation, the need for structured agronomy monitoring, and multi-site construction management favor firms with strong development pipelines, local land origination networks, and financing access.
| Company | Est. year | HQ | Italy agrivoltaics execution posture | Tender-readiness & bid strategy | Typical project scale bias | Agronomic integration model | Grid & interconnection capability | Delivery model | Differentiation lever (Italy-specific) |
| Enel Green Power | 2008 | Rome, Italy | ~ | ~ | ~ | ~ | ~ | ~ | ~ |
| ERG | 1938 | Genoa, Italy | ~ | ~ | ~ | ~ | ~ | ~ | ~ |
| Sonnedix | 2009 | London, UK (Italy ops) | ~ | ~ | ~ | ~ | ~ | ~ | ~ |
| European Energy | 2004 | Copenhagen, Denmark | ~ | ~ | ~ | ~ | ~ | ~ | ~ |
| Renantis | 2022 | Milan, Italy | ~ | ~ | ~ | ~ | ~ | ~ | ~ |
Italy Agrivoltaics Market Dynamics and Performance Analytics
Growth Drivers
Policy and incentive pull for advanced agrivoltaics
Italy’s “advanced agrivoltaics” pipeline is being structurally pulled by the nationally codified incentive framework tied to EU Recovery and Resilience funding. The European Commission cleared an Italian State-aid scheme sized at EUR ~, explicitly designed to support new agrivoltaic plants for ~ GW of total capacity and at least ~ GWh/year of indicative generation, with an investment-grant envelope of EUR ~ and an operating-support budget estimated at EUR ~ (paid over ~ years via competitive auctions). This matters commercially because “advanced agrivoltaics” is not a generic PV add-on in Italy: eligibility hinges on simultaneous agricultural continuity and verified system design/monitoring obligations, which drives demand for specialized EPC designs (elevated structures, tracking logic, crop-compatible layouts), agronomy engineering, and measurement & verification services. On the macro side, Italy’s economic base and grid decarbonization urgency underpin bankable procurement: the World Bank records Italy at USD ~ trillion GDP, USD ~ GDP per capita, and ~ t CO2e per capita (excluding LULUCF) in the latest available values—figures that support both industrial offtake appetite and policy pressure to decarbonize without expanding land conflict.
Decarbonization siting pressure and land-use conflict minimization
Italy’s siting economics increasingly reward dual-use configurations because the power system is growing while land-use sensitivities tighten. Terna’s latest statistical snapshot shows national electricity demand at ~ TWh and consumption at ~ TWh in the most recent reported year, meaning large-scale renewables must keep scaling while navigating social license and spatial planning limits. In parallel, Italy’s energy transition is driving an extreme volume of grid-connection “intent”: Terna reports ~ GW of renewable connection requests recorded at year-end, including ~ GW of solar requests (separate from storage requests of ~ GW). Even if not all requests translate to built capacity, this queue signals that developers are actively hunting sites and grid nodes; in that competitive context, agrivoltaics becomes a permitting and stakeholder tool—projects can position themselves as land-conflict minimizers by maintaining agricultural output and rural employment while hosting PV. Macroeconomically, the World Bank’s record of ~ population and ~ net migration (latest values shown) reinforces the policy imperative to protect productive land and rural livelihoods while meeting energy demand growth and electrification goals.
Challenges
Prime farmland scrutiny and qualification ambiguity
Italy’s agrivoltaics market faces a structurally higher scrutiny threshold because regulators and local authorities must reconcile food-production priorities with energy buildout. The incentive framework itself encodes “advanced” agrivoltaic requirements (not just “PV on farmland”), and the State-aid approval explicitly frames the policy objective around efficient land use and simultaneous agriculture + PV. This design choice elevates qualification complexity: projects must document agricultural continuity, demonstrate system configurations compatible with cultivation or grazing, and then sustain compliance through monitoring—creating real execution risk at the farm and developer level. Grid-side pressure intensifies the stakes: with ~ GW renewable connection requests (including ~ GW solar) reported at year-end, there is intense competition for feasible sites and grid nodes, which can tempt developers to pursue marginal agronomic contexts that may fail scrutiny (prime farmland sensitivity, protected landscapes, irrigation constraints). Macroeconomic indicators amplify the political sensitivity: Italy’s latest displayed population is ~, and CO2e per capita is ~ t, which supports decarbonization urgency while simultaneously increasing the need to defend food systems and rural employment.
Permitting appeals and litigation exposure
Permitting in Italy is not merely an administrative checklist; it is a legal-risk arena where appeals and local contestation can materially disrupt commissioning timelines—especially for projects touching agricultural landscapes. The first agrivoltaics tender’s scale—~ bids filed and ~ projects admitted for ~ MW—demonstrates that many developers are willing to carry substantial pre-permit and permit-risk capital into competitive processes. That volume alone increases the probability of conflict at the municipal/provincial level, because multiple projects may cluster around the same grid nodes or land parcels, raising competition among stakeholders and intensifying public scrutiny. Furthermore, the State-aid decision highlights that the scheme runs through competitive selection and requires projects to become operational before a defined deadline (policy-driven “delivery pressure”), which can create a mismatch between legal timelines for appeals and the commercial need to mobilize EPC quickly. On the macro side, Italy’s World Bank indicators show an economy at USD ~ trillion GDP and USD ~ GDP per capita, supporting an active infrastructure investment environment; however, higher asset values and dense land-use patterns often correlate with more contested permitting outcomes. In practice, developers increasingly respond by front-loading stakeholder mapping, legal due diligence on land titles/rights-of-way, and integrating agricultural cooperatives and local agrarian actors earlier to reduce social opposition.
Opportunities
Standardized crop-specific design templates
The Italian market is now large enough to reward standardization—an opportunity that can reduce permitting friction, cut engineering cycle time, and improve bankability without relying on “future” projections. The first national procedure’s outcome—~ admitted agrivoltaic projects totaling ~ MW—creates a dataset of real, accepted configurations across multiple regions and crop contexts, which can be mined by technology providers and EPCs to build “template families” (e.g., orchard-compatible spacing, viticulture machinery-clearance envelopes, grazing-focused layouts). At the policy level, the approved scheme is calibrated to deploy ~ GW and at least ~ GWh/year, which effectively encourages repeatable design logic because many developers will deliver portfolios rather than one-offs. On the macro side, Italy’s World Bank metrics show USD ~ trillion GDP and ~ population, supporting a broad base of agricultural operations and electricity demand centers; standardized templates help connect that demand with rural land in a controlled, auditable way. Commercially, the opportunity is for vendors to productize compliance: agronomic monitoring kits, standardized reporting dashboards, and pre-engineered mounting systems with known crop-shading profiles.
Retrofit conversion of existing PV assets into dual-use systems
Italy’s broader solar pipeline and grid congestion make “retrofit-to-dual-use” a pragmatic opportunity: instead of only pursuing greenfield farmland projects, asset owners can explore conversions that improve land acceptance and extend asset life where site conditions allow. The macro grid environment supports this logic: Terna shows electricity demand at ~ TWh and reports an extraordinary volume of interconnection interest (~ GW renewable connection requests; ~ GW solar requests), implying competition for new grid injections and higher value for solutions that can maintain output while de-risking land-use narratives. Policy structure also supports the shift toward “quality of design” rather than only capacity: the State-aid cleared scheme emphasizes simultaneous land use and defines a pathway for advanced agrivoltaic systems within a ~ GW support envelope and ~ GWh/year indicative generation—criteria that can influence how repowering and site upgrades are packaged. On the agricultural side, Italy’s demographic and economic context (World Bank: net migration ~; GDP per capita USD ~) reinforces the importance of keeping rural areas economically viable; retrofits that introduce active agricultural operations (e.g., grazing, cover crops, pollinator-friendly cultivation) can strengthen local legitimacy and reduce opposition compared with “energy-only” land narratives.
Future Outlook
Over the next five to six years, Italy Agrivoltaics is expected to move from “tender-led adoption” into repeatable deployment at scale, anchored by (i) clearer compliance definitions for “advanced” agrivoltaics, (ii) grid and permitting learning curves across high-activity regions, and (iii) expanding corporate offtake and utility procurement appetite for long-duration clean generation. The market’s direction will increasingly reward standardized system designs, auditable agronomic performance, and developer-landowner contracting models that reduce appeal/litigation exposure while preserving farm productivity.
Major Players
- Enel Green Power
- ERG
- Sonnedix
- European Energy
- Renantis
- NextEnergy Capital
- Repower
- Solarig
- Photosol
- DCH Di Carlo Holding
- Tozzi Green
- Plenitude (Eni)
- A2A
- FRI-EL Green Power
Key Target Audience
- Independent power producers and renewable developers
- Utilities and energy retailers
- Landowners, farm enterprises, and agri-cooperatives
- EPC contractors and civil works firms
- PV component OEMs and system providers
- Grid and system stakeholders
- Investments and venture capitalist firms
- Government and regulatory bodies
Research Methodology
Step 1: Identification of Key Variables
We build an Italy agrivoltaics ecosystem map covering developers, EPCs, agronomy partners, land aggregators, DSOs/TSO interfaces, and regulators. Desk research prioritizes official policy instruments, tender rules, and compliance definitions to shortlist the variables that drive bankability and permitting outcomes.
Step 2: Market Analysis and Construction
We construct the market using a dual lens: (i) policy-backed deployment pipeline (tendered capacity, eligible projects, grant/tariff structures), and (ii) execution capacity (EPC throughput, grid queues, regional permitting). Historical solar business indicators and auction statistics are used to triangulate commercialization intensity.
Step 3: Hypothesis Validation and Expert Consultation
We validate assumptions through structured interviews with developers, EPC leads, agronomists, and landowner representatives. These consultations are used to test real-world constraints (machinery access, crop continuity KPIs, monitoring requirements) and refine segmentation logic.
Step 4: Research Synthesis and Final Output
We synthesize top-down (policy/tender and regional pipeline) with bottom-up (project economics mechanics, contracting structures, construction schedules). Cross-validation is performed across multiple stakeholder groups to finalize segment shares, competitive benchmarking, and opportunity mapping.
- Executive Summary
- Research Methodology (Market definitions and boundary conditions, agrivoltaico avanzato qualification logic, inclusions and exclusions versus ground-mounted PV restrictions, data triangulation framework, primary interview mix, project database build approach, spatial screening approach, yield and agronomy assumptions, permitting and connection timeline modeling, limitations and sensitivity set)
- Definition and Scope
- Market Genesis and Evolution
- Business Cycle and Development Flywheel
- Stakeholder Map
- Value Chain and Delivery Stack

- Growth Drivers
Policy and incentive pull for advanced agrivoltaics
Decarbonization siting pressure and land-use conflict minimization
Rural income stabilization and farm economics resilience
Alignment with grid-scale solar build-out and repowering pipelines - Challenges
Prime farmland scrutiny and qualification ambiguity
Permitting appeals and litigation exposure
Grid connection queues and upgrade risk
Agronomic underperformance and compliance monitoring burden - Opportunities
Standardized crop-specific design templates
Retrofit conversion of existing PV assets into dual-use systems
Agri-processing self-consumption clusters
Water-smart and biodiversity-led agrivoltaics
Cooperative aggregation and platform-led development - Trends
Advanced monitoring and reporting protocols
Elevated structures with full mechanization compatibility
Biodiversity integration and landscape-sensitive layouts
Hybridization with storage and smart inverters - Regulatory & Policy Landscape
- SWOT Analysis
- Stakeholder & Ecosystem Analysis
- Porter’s Five Forces Analysis
- Competitive Intensity & Ecosystem Mapping
- By Value, 2019–2024
- By Installed Capacity, 2019–2024
- By Commissioned Project Count, 2019–2024
- By Land Footprint, 2019–2024
- By Agrivoltaics Qualification Pathway (in Value %)
Advanced, non-advanced
Monitoring intensity
Agricultural continuity evidencing
- By System Architecture (in Value %)
Elevated canopy
High-clearance fixed-tilt
Trackers with clearance
Vertical bifacial
Greenhouse-integrated
- By Crop and Farming System (in Value %)
Arable
Horticulture
Orchards and vineyards
Forage and grazing
Mixed farming models
- By Project Scale Band (in Value %)
Farm-scale
Clustered or cooperative
Utility-scale
- By Offtake and Revenue Stack (in Value %)
Incentive-supported
Corporate PPA
Utility PPA
Merchant or aggregated
Behind-the-meter
- By Ownership and Delivery Model (in Value %)
Farmer-led
IPP-led
Utility-led
Fund or platform-led
- By Geography and Grid Context (in Value %)
Macro-areas
Congestion-prone nodes
DSO versus TSO interface
- Market Structure and Competitive Intensity
- Cross Comparison Parameters (eligibility mastery, agronomic delivery depth, monitoring and reporting stack, grid strategy, permitting velocity, structural and engineering competence, O&M and uptime governance, offtake structuring)
- SWOT Analysis of Major Players
- Contracting and Commercial Benchmarks
- Detailed Profiles of Major Companies
Enel Green Power
Plenitude
Edison Energia and Edison Renewables
A2A
ERG
Renantis
EF Solare Italia
Sorgenia Renewables
Fintel Energia Group
TAGES
BayWa r.e. Italy
Lightsource bp Italy
EDF Renewables Italy
RWE Renewables Italy
- Farmer and landowner economics and control preferences
- Cooperative and producer organization aggregation models
- Agri-food processor behind-the-meter strategies
- Utility, IPP, and platform pipeline strategies
- Public-sector and institutional authorization behavior
By Value, 2025–2030
By Installed Capacity, 2025–2030
By Project Count, 2025–2030
By Land Footprint, 2025–2030


 Request a Sample
 Ask for Customization
 Get a Quote
 Enquire Now