
 Download PDF
 Download PDF
Market Overview
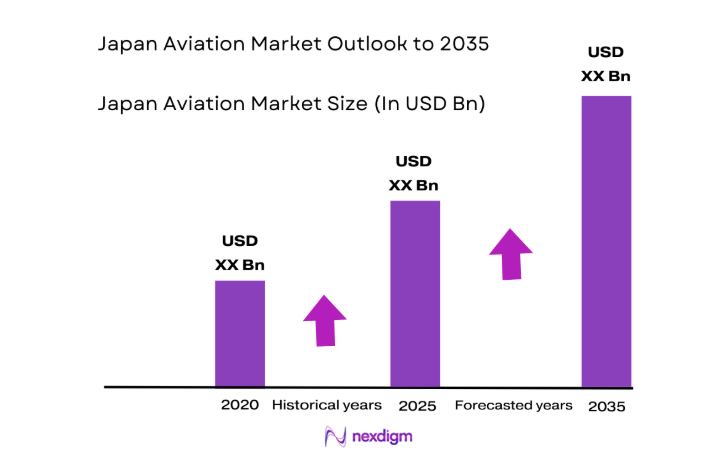
The Japan Aviation market current size stands at around USD ~ million, reflecting sustained demand across passenger transport, cargo logistics, and aviation services. Investment flows, fleet renewal programs, and airport modernization initiatives continue to shape capacity expansion and operational resilience. Capital deployment into maintenance, digital operations, and sustainability initiatives supports efficiency gains across airlines, airports, and service providers. The market benefits from a mature regulatory framework and established safety standards, reinforcing long-term stability across the aviation value chain.
Market activity is concentrated around major metropolitan air hubs, supported by dense multimodal connectivity, strong business travel demand, and high tourism inflows. Tokyo and the Kansai region anchor network connectivity, while Chubu functions as a logistics and manufacturing-linked gateway. Regional airports play a critical role in island connectivity and disaster response. Ecosystem maturity is reinforced by integrated OEM, MRO, and airport services, underpinned by policy frameworks promoting safety, decarbonization, and operational efficiency.
Market Segmentation
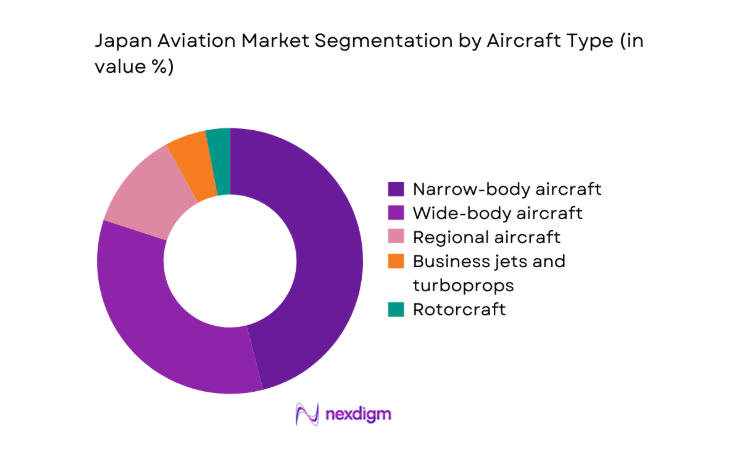
By Aircraft Type
Narrow-body aircraft dominate fleet deployment due to high-frequency domestic routes and short-haul international connectivity supporting dense metropolitan corridors. Wide-body aircraft remain central for long-haul services connecting Japan with North America, Europe, and Asia-Pacific, reflecting strong tourism and trade linkages. Regional aircraft sustain connectivity to island and remote prefectures, where rail alternatives are limited. Business jets and rotorcraft serve corporate mobility, emergency response, and offshore operations, benefiting from growing charter demand and disaster preparedness requirements within the national transport resilience agenda.
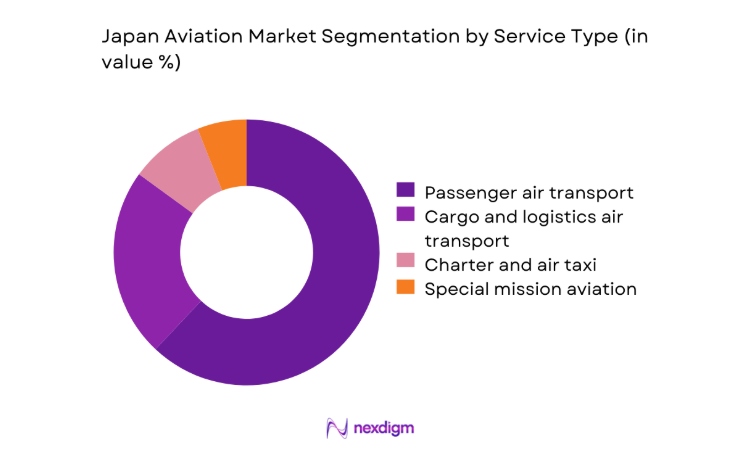
By Service Type
Passenger air transport leads overall activity, driven by dense domestic travel, international tourism recovery, and premium business travel between economic centers. Cargo and logistics air transport is reinforced by e-commerce growth and time-sensitive manufacturing supply chains, particularly electronics and pharmaceuticals. Charter and air taxi services are expanding for corporate mobility and remote access. Special mission aviation, including medical evacuation, disaster relief, and aerial surveillance, is gaining strategic relevance due to climate-linked weather events and national resilience planning.
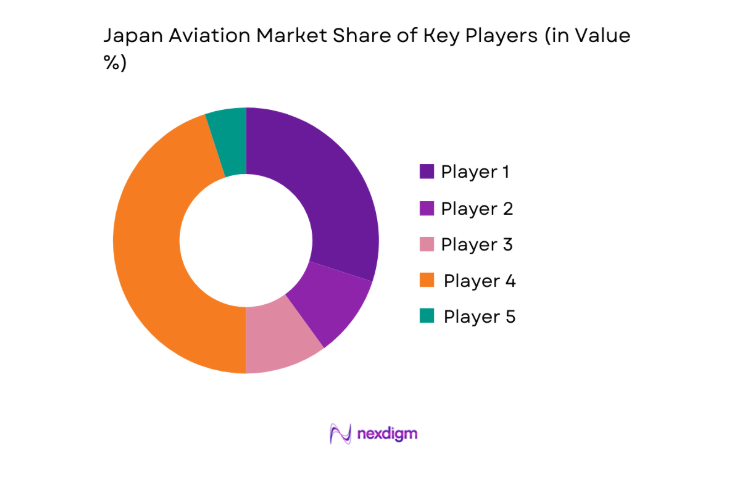
Competitive Landscape
The competitive environment reflects a mix of full-service carriers, low-cost operators, cargo specialists, and integrated airport service providers. Differentiation is driven by network depth, service reliability, operational efficiency, sustainability readiness, and digital capability. Strategic partnerships, fleet modernization programs, and service quality investments shape positioning across domestic and international corridors.
| Company Name | Establishment Year | Headquarters | Formulation Depth | Distribution Reach | Regulatory Readiness | Service Capability | Channel Strength | Pricing Flexibility |
| All Nippon Airways | 1952 | Tokyo | ~ | ~ | ~ | ~ | ~ | ~ |
| Japan Airlines | 1951 | Tokyo | ~ | ~ | ~ | ~ | ~ | ~ |
| Peach Aviation | 2011 | Osaka | ~ | ~ | ~ | ~ | ~ | ~ |
| Skymark Airlines | 1996 | Tokyo | ~ | ~ | ~ | ~ | ~ | ~ |
| Nippon Cargo Airlines | 1978 | Tokyo | ~ | ~ | ~ | ~ | ~ | ~ |
Japan Aviation Market Analysis
Growth Drivers
Recovery of international tourism and inbound travel demand
Inbound travel flows strengthened as border policies normalized and visa facilitation expanded, restoring route density and seat utilization across transpacific and intra-Asia corridors. Passenger entries reached 25000000 in 2024, compared with 11000000 in 2023, supported by expanded slot allocations at Haneda and Narita totaling 600 additional weekly movements. Hotel occupancy rates above 65 in Tokyo and Osaka reinforced load factors on trunk routes. Airport rail links handled 190000 passengers daily, easing ground access bottlenecks. National tourism campaigns targeted 120 overseas cities, stimulating route reinstatement and frequency increases. Airport immigration staffing rose by 4800 personnel, reducing average processing times to 22 minutes during peak periods.
Fleet modernization toward fuel-efficient aircraft
Fleet renewal accelerated as operators inducted 62 new-generation narrow-body aircraft during 2024–2025, replacing 41 older units exceeding 20 years of service. Fuel burn improvements of 15 per flight cycle reduced operational intensity on domestic trunk routes averaging 1200 kilometers. Engine reliability metrics improved with unscheduled removal rates declining to 3 events per 10000 flight hours. Maintenance turnaround times fell by 18 hours per heavy check following hangar digitalization at 4 major bases. Certification throughput by aviation authorities cleared 27 type variations, supporting faster entry into service. Training pipelines certified 960 pilots on new types, expanding operational readiness across peak travel seasons.
Challenges
Slot constraints at major hubs and airspace congestion
Peak-hour slot scarcity at Haneda and Narita constrained schedule recovery, with utilization ratios exceeding 95 across morning banks during 2024–2025. Airspace complexity around the Kanto region resulted in average airborne holding of 7 minutes per arrival during weather disruptions. Runway throughput improvements added 10 movements per hour following procedural changes, yet demand outpaced capacity on 42 high-frequency city pairs. Ground congestion raised taxi-out times to 19 minutes during peak waves. Air traffic controller staffing gaps of 6 percent increased sector load variability. Infrastructure works at terminal aprons temporarily reduced gate availability by 12, complicating wide-body turnaround coordination during seasonal peaks.
High operating costs and fuel price volatility
Fuel price swings across 2024–2025 raised monthly variance indices by 28 points, complicating budget stability for route planning. Hedging coverage averaged 9 months of consumption, leaving exposure during sudden market shifts. Airport charges increased at 3 major hubs following terminal upgrades, adding fixed-cost pressure on short-haul routes with average stage lengths of 700 kilometers. Maintenance labor costs rose with technician shortages, extending overtime hours by 14 per month per line station. Currency movements affected lease payments denominated in foreign units across 210 aircraft. Cost uncertainty constrained marginal route experimentation, delaying network diversification into 16 prospective secondary city pairs.
Opportunities
Growth of sustainable aviation fuel supply chains
Domestic refining capacity expansions planned through 2025 enabled blending volumes of 120000 kiloliters annually, supporting early adoption on trunk routes. Airport hydrant systems at 5 hubs completed compatibility upgrades, reducing handling frictions for blended fuel deployment. Corporate travel programs committed to purchase agreements covering 3400 flights annually, strengthening offtake certainty. National decarbonization targets catalyzed certification pathways for 2 new production routes using waste feedstocks. Logistics operators integrated fuel traceability across 14 depots, improving chain-of-custody assurance. Airline operations teams piloted blended fuel on 86 rotations, generating performance datasets across 9 aircraft types to inform scaled rollout planning.
Development of regional air mobility and eVTOL trials
Urban air mobility demonstrations progressed with 23 test flights conducted across waterfront and island corridors during 2024–2025, supported by municipal safety frameworks. Vertiport site assessments covered 14 locations near rail interchanges, targeting first-mile connectivity for business districts. Certification authorities issued 6 special flight permits for piloted demonstrators, enabling performance data collection under controlled airspace. Emergency response agencies evaluated response time reductions of 12 minutes for island medical transfers using rotary-wing proxies. Power utilities completed grid studies at 8 sites to support high-load charging. Public acceptance surveys conducted by municipalities informed noise contour planning across 5 urban wards.
Future Outlook
The market outlook through 2035 reflects steady normalization of international connectivity, accelerated decarbonization pathways, and continued airport capacity optimization. Policy alignment on sustainable fuels and digital operations will shape competitiveness, while regional connectivity and advanced air mobility pilots expand access. Operational resilience will increasingly depend on workforce pipelines and airspace modernization initiatives across metropolitan corridors.
Major Players
- All Nippon Airways
- Japan Airlines
- Peach Aviation
- Jetstar Japan
- Skymark Airlines
- Air Do
- Solaseed Air
- Fuji Dream Airlines
- ANA Cargo
- Nippon Cargo Airlines
- Japan Airport Terminal Co., Ltd.
- Central Japan International Airport Co., Ltd.
- Narita International Airport Corporation
- Mitsubishi Heavy Industries
- IHI Corporation
Key Target Audience
- Commercial airlines and cargo operators
- Airport operators and air navigation service providers
- Aircraft leasing companies and fleet financiers
- MRO service providers and component suppliers
- Fuel suppliers and sustainable aviation fuel producers
- Investments and venture capital firms
- Government and regulatory bodies with agency names including Ministry of Land, Infrastructure, Transport and Tourism and Civil Aviation Bureau
- Logistics and e-commerce platform operators
Research Methodology
Step 1: Identification of Key Variables
Operational capacity, fleet composition, route density, infrastructure readiness, and regulatory parameters were mapped across airlines, airports, and service providers. Demand drivers across passenger and cargo operations were delineated. Sustainability readiness and digital maturity variables were defined to capture transformation levers.
Step 2: Market Analysis and Construction
Network topology, airport throughput dynamics, fleet induction cycles, and maintenance capacity were integrated into analytical constructs. Scenario frames captured regulatory changes, infrastructure constraints, and technology adoption pathways. Demand-supply interactions were structured to reflect seasonal and corridor-specific patterns.
Step 3: Hypothesis Validation and Expert Consultation
Assumptions on fleet renewal pacing, airspace modernization, and decarbonization adoption were validated through structured consultations with operational leaders, airport planners, and policy specialists. Cross-checks ensured alignment with safety frameworks and infrastructure rollout schedules.
Step 4: Research Synthesis and Final Output
Insights were synthesized into cohesive narratives linking operational realities with strategic pathways. Comparative assessments highlighted differentiation levers across service models. Final outputs were structured to support decision-making across investment, operations, and policy planning contexts.
- Executive Summary
- Research Methodology (Market Definitions and air transport service categories and fleet classes, Airline fleet databases and aircraft delivery backlog analysis, Civil aviation authority statistics and airport traffic datasets, OEM and MRO orderbook and utilization surveys)
- Definition and Scope
- Market evolution
- Usage and operational pathways
- Ecosystem structure
- Supply chain and channel structure

- Growth Drivers
Recovery of international tourism and inbound travel demand
Fleet modernization toward fuel-efficient aircraft
Expansion of e-commerce driving air cargo volumes - Challenges
Slot constraints at major hubs and airspace congestion
High operating costs and fuel price volatility
Pilot and maintenance workforce shortages - Opportunities
Growth of sustainable aviation fuel supply chains
Development of regional air mobility and eVTOL trials
Digitalization of airline operations and predictive maintenance - Trends
Adoption of SAF blending and carbon reduction programs
Shift toward narrow-body long-range operations
Growth of premium economy and differentiated cabin products - Government Regulations
- SWOT Analysis
- Porter’s Five Forces
- By Value, 2020–2025
- By Volume, 2020–2025
- By Installed Base, 2020–2025
- By Average Selling Price, 2020–2025
- By Aircraft Type (in Value %)
Narrow-body aircraft
Wide-body aircraft
Regional aircraft
Business jets and turboprops - By Service Type (in Value %)
Passenger air transport
Cargo and logistics air transport
Charter and air taxi
Special mission aviation - By Operator Type (in Value %)
Full-service carriers
Low-cost carriers
Cargo airlines
Business aviation operators
Government and public service operators - By Airport Category (in Value %)
Primary international hubs
Secondary international airports
Domestic regional airports
Remote and island airports - By Value Chain Segment (in Value %)
Aircraft OEMs
Engine and component suppliers
MRO providers
- Market share of major players
- Cross Comparison Parameters (fleet size, network reach, on-time performance, unit cost structure, yield per passenger, cargo capacity, SAF adoption, digital maturity)
- SWOT Analysis of Key Players
- Pricing and Commercial Model Benchmarking
- Detailed Profiles of Major Companies
All Nippon Airways
Japan Airlines
Peach Aviation
Jetstar Japan
Skymark Airlines
Air Do
Solaseed Air
Fuji Dream Airlines
ANA Cargo
Nippon Cargo Airlines
Japan Airport Terminal Co., Ltd.
Central Japan International Airport Co., Ltd.
Narita International Airport Corporation
Mitsubishi Heavy Industries
IHI Corporation
- Demand and utilization drivers
- Procurement and tender dynamics
- Buying criteria and vendor selection
- Budget allocation and financing preferences
- Implementation barriers and risk factors
- By Value, 2026–2035
- By Volume, 2026–2035
- By Installed Base, 2026–2035
- By Average Selling Price, 2026–2035


 Request a Sample
 Ask for Customization
 Get a Quote
 Enquire Now