
 Download PDF
 Download PDF
Market Overview
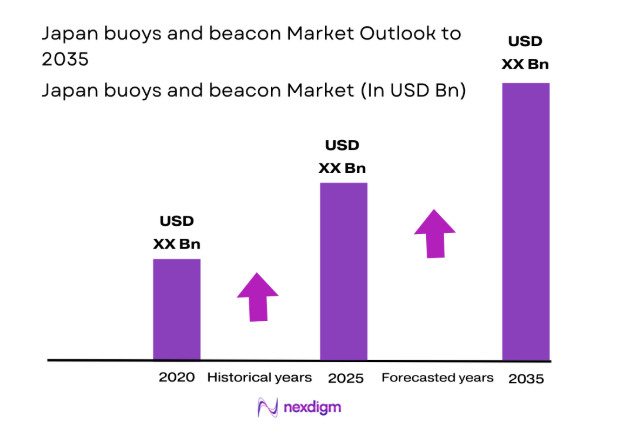
The Japan buoys and beacon Market market current size stands at around USD ~ million, supported by widespread coastal navigation infrastructure and steady replacement demand. Deployment volumes remained stable across monitored coastal zones, with operational installations exceeding ~ units across ports and shipping lanes. Annual procurement cycles reflected consistent ordering patterns, while installed bases expanded incrementally through modernization programs. Technology upgrades focused on solar-powered and LED-based systems, supporting lifecycle efficiency improvements. Maintenance intensity remained high due to environmental exposure, reinforcing recurring service demand. Public sector procurement continued dominating purchase volumes nationwide.
Coastal activity concentration across Tokyo Bay, Osaka Bay, and major industrial ports underpins regional dominance within Japan. These regions benefit from dense shipping traffic, mature port ecosystems, and advanced maritime governance frameworks. Northern and island regions exhibit higher reliance on ruggedized systems due to harsher conditions. Policy emphasis on navigational safety sustains deployment consistency across regions. Strong coordination between maritime authorities and port operators reinforces ecosystem stability. Local manufacturing and servicing capabilities further enhance regional resilience.
Market Segmentation
By Application
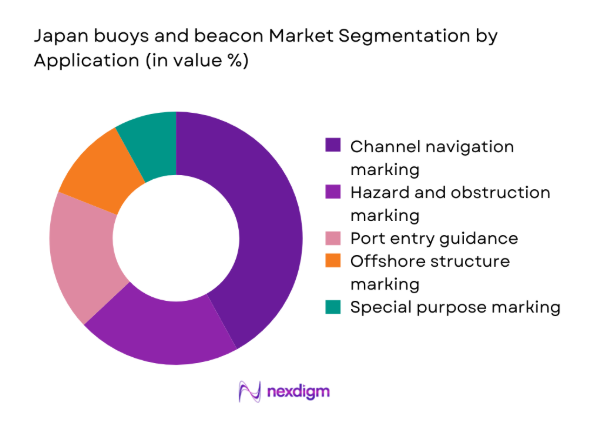
Navigation channel marking dominates the Japan buoys and beacon Market due to extensive port networks and congested coastal shipping corridors. Continuous vessel movements require precise lateral, cardinal, and safe water marking across major entry points. Port authorities prioritize channel reliability to minimize accident risks and delays. Replacement cycles favor standardized buoy types with proven durability. Integration with harbor traffic systems further strengthens application dominance. Hazard marking and offshore platform applications follow, driven by energy projects and coastal construction activities.
By Technology Architecture
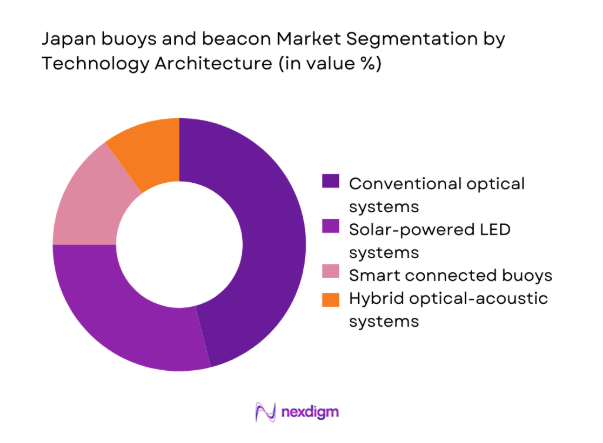
Conventional optical buoy systems retain dominance due to established standards, operational familiarity, and lower integration complexity. Port authorities favor proven architectures for compliance and maintenance predictability. Solar-powered LED systems increasingly replace legacy lighting, extending service intervals. Smart buoy adoption remains selective, focused on high-traffic zones. Hybrid architectures gain attention where acoustic signaling complements visual aids. Technology choices remain conservative, balancing innovation with operational reliability requirements.
Competitive Landscape
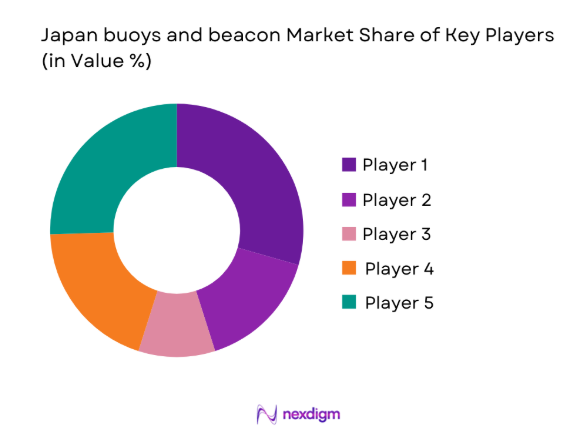
The Japan buoys and beacon Market exhibits a moderately consolidated competitive structure with strong emphasis on regulatory compliance and service reliability. Domestic suppliers coexist with specialized international manufacturers, competing primarily on durability, lifecycle support, and technology readiness.
| Company Name | Establishment Year | Headquarters | Formulation Depth | Distribution Reach | Regulatory Readiness | Service Capability | Channel Strength | Pricing Flexibility |
| Tideland Signal | 1954 | United States | ~ | ~ | ~ | ~ | ~ | ~ |
| Carmanah Technologies | 1978 | Canada | ~ | ~ | ~ | ~ | ~ | ~ |
| Sabik Marine | 1969 | Finland | ~ | ~ | ~ | ~ | ~ | ~ |
| Sealite | 1982 | Australia | ~ | ~ | ~ | ~ | ~ | ~ |
| Nippon Signal | 1928 | Japan | ~ | ~ | ~ | ~ | ~ | ~ |
Japan buoys and beacon Market Analysis
Growth Drivers
Expansion and modernization of port infrastructure
Port modernization programs increased steadily, improving navigational safety requirements across major Japanese harbors and coastal shipping corridors. Infrastructure upgrades prioritized resilient aids-to-navigation to support rising vessel movements and operational efficiency improvements. Expansion projects increased buoy redeployment needs, supporting consistent equipment demand across regions. Integration with port traffic management systems strengthened reliance on precise navigational marking solutions. Public investment frameworks emphasized long-term asset reliability rather than short-term cost savings. Modernization timelines extended over multiple years, sustaining procurement continuity. Port expansions in industrial zones reinforced deployment density requirements. Environmental resilience specifications further influenced system selection criteria. Maintenance optimization objectives encouraged replacement of aging installations. Collectively, infrastructure modernization directly reinforced stable market fundamentals nationwide.
Stringent maritime safety and collision avoidance regulations
Maritime safety regulations in Japan enforce strict compliance standards for navigational aids deployment and operational performance. Regulatory frameworks mandate consistent visibility, reliability, and positional accuracy across designated waterways. Compliance audits increased operational accountability for port authorities and operators. Collision avoidance priorities intensified due to congested shipping lanes and mixed vessel traffic. Regulatory alignment with international standards reinforced technology consistency requirements. Enforcement rigor limited tolerance for equipment downtime or degradation. Safety-driven mandates supported systematic replacement cycles. Regulatory clarity reduced procurement uncertainty for approved system types. Continuous monitoring expectations increased demand for dependable installations. Overall, regulatory strictness remains a structural growth catalyst.
Challenges
High maintenance costs in harsh marine environments
Japan’s marine environment accelerates corrosion, biofouling, and structural wear across buoy and beacon installations. High wave exposure and seasonal weather variability increase servicing frequency requirements. Maintenance operations require specialized vessels and skilled crews, raising operational burdens. Remote locations further complicate timely servicing and inspections. Equipment downtime risks escalate when maintenance cycles extend. Budget planning must accommodate unpredictable repair intervals. Harsh conditions shorten effective equipment lifespans. Material selection constraints limit cost optimization opportunities. Environmental stress increases spare parts consumption. These factors collectively pressure lifecycle management efficiency.
Budget constraints of local port authorities
Local port authorities face constrained fiscal allocations despite ongoing navigational safety obligations. Capital expenditure approvals often compete with broader infrastructure priorities. Budget limitations delay replacement of aging navigational aids. Incremental procurement strategies replace large-scale upgrades. Financial scrutiny emphasizes upfront cost considerations over lifecycle efficiency. Smaller ports experience greater funding volatility. Budget uncertainty complicates long-term maintenance planning. Procurement timelines extend due to funding approvals. Cost containment pressures restrict technology experimentation. These constraints moderate market acceleration potential.
Opportunities
Adoption of smart and connected buoy systems
Smart buoy systems offer remote monitoring capabilities, improving maintenance planning and operational visibility. Connected platforms enable condition-based servicing, reducing unnecessary site visits. Data integration enhances navigational accuracy and situational awareness. Authorities gain real-time performance insights across distributed assets. Early deployments demonstrate operational efficiency improvements. Smart systems support predictive maintenance frameworks. Digitalization aligns with broader maritime modernization strategies. Gradual adoption reduces operational risk exposure. Technology maturity improves procurement confidence. This transition presents long-term value creation opportunities.
Integration with autonomous and unmanned vessel navigation
Autonomous vessel trials increase demand for highly reliable and digitally compatible navigational aids. Precise signaling supports machine-based navigation decision-making. Buoys equipped with enhanced visibility and data transmission gain relevance. Integration requirements favor standardized digital interfaces. Test corridors drive localized deployment opportunities. Regulatory experimentation encourages infrastructure readiness investments. Compatibility with autonomous systems strengthens future-proofing strategies. Early alignment improves long-term infrastructure relevance. Collaboration between technology developers and authorities accelerates readiness. This integration pathway expands functional importance of navigation aids.
Future Outlook
The Japan buoys and beacon Market is expected to evolve steadily through 2035, shaped by infrastructure modernization, regulatory rigor, and gradual digital adoption. Smart system integration will increase selectively, while conventional systems remain foundational. Policy stability and maritime safety priorities will continue underpinning long-term demand.
Major Players
- Tideland Signal
- Carmanah Technologies
- Sabik Marine
- Sealite
- Nippon Signal
- Furuno Electric
- Tokyo Keiki
- JFC Manufacturing
- Zeni Lite Buoy
- Koden Electronics
- Shibata Industrial
- Ryokuseisha
- Orga
- Shinyei Technology
- Hokushin Electric
Key Target Audience
- Port authorities and harbor management bodies
- Japan Coast Guard and maritime safety agencies
- Ministry of Land, Infrastructure, Transport and Tourism
- Offshore energy operators
- Naval and defense procurement agencies
- Coastal municipal governments
- Marine infrastructure contractors
- Investments and venture capital firms
Research Methodology
Step 1: Identification of Navigational Aid Scope
Focused on identifying navigational aid categories, deployment environments, and regulatory scope across Japanese coastal regions.
Step 2: Market Structuring and Framework Development
Involved structuring application, technology, and regional frameworks reflecting procurement and replacement behaviors.
Step 3: Expert Validation and Industry Consultation
Emphasized validation through expert consultations with port operators and maritime safety professionals.
Step 4: Research Synthesis and Insight Development
Synthesized findings into coherent market insights aligned with operational realities and policy constraints.
- Executive Summary
- Research Methodology (Market Definitions and navigational aid scope for buoys and beacons, AtoN taxonomy and functional classification mapping, Bottom-up port-wise and coastline-wise market sizing, Value attribution by procurement contracts and lifecycle services, Primary interviews with port authorities and maritime safety agencies, AIS and IALA data triangulation with tender disclosures, Assumptions on replacement cycles and coastal infrastructure funding)
- Definition and Scope
- Market evolution
- Role in maritime safety and navigation assurance
- Aids-to-Navigation ecosystem structure
- Supply chain and OEM–authority interaction model
- Regulatory and standards environment in Japan

- Growth Drivers
Expansion and modernization of port infrastructure
Stringent maritime safety and collision avoidance regulations
Growth in coastal and short-sea shipping traffic
Offshore wind and marine energy development
Digitalization of aids-to-navigation systems - Challenges
High maintenance costs in harsh marine environments
Budget constraints of local port authorities
Long procurement and approval cycles
Corrosion and weather-related equipment degradation
Limited standardization across regional deployments - Opportunities
Adoption of smart and connected buoy systems
Integration with autonomous and unmanned vessel navigation
Lifecycle service and maintenance outsourcing models
Upgrading legacy systems to energy-efficient LED platforms
Public–private partnerships in coastal safety infrastructure - Trends
Shift toward solar-powered and low-maintenance systems
Increased deployment of AIS AtoN solutions
Use of real-time monitoring and predictive maintenance
Standard alignment with IALA and IMO guidelines
Localization of manufacturing and servicing capabilities - Government Regulations
SWOT Analysis
Stakeholder and Ecosystem Analysis
Porter’s Five Forces Analysis
Competition Intensity and Ecosystem Mapping
- By Value, 2020–2025
- By Volume, 2020–2025
- By Installed Base, 2020–2025
- By Average Selling Price, 2020–2025
- By Fleet Type (in Value %)
Commercial shipping lanes
Fishing and coastal vessels
Port and harbor navigation
Offshore energy support zones
Defense and coast guard routes - By Application (in Value %)
Lateral navigation marking
Cardinal and safe water marking
Hazard and obstruction marking
Channel delineation and port entry guidance
Offshore platform and wind farm marking - By Technology Architecture (in Value %)
Conventional optical buoy systems
Solar-powered LED beacon systems
Smart buoys with sensor integration
Hybrid optical and acoustic systems - By End-Use Industry (in Value %)
Port authorities
Maritime safety and coast guard agencies
Offshore energy operators
Fishing cooperatives
Defense and naval authorities - By Connectivity Type (in Value %)
Non-connected passive systems
AIS-enabled AtoN systems
Remote monitoring and telemetry-enabled systems - By Region (in Value %)
Kanto coastal region
Kansai coastal region
Chubu coastal region
Kyushu and Okinawa region
Hokkaido and northern waters
- Market structure and competitive positioning
- Market share snapshot of major players
Cross Comparison Parameters (Technology capability, Product durability, Compliance with IALA standards, Pricing competitiveness, Service and maintenance coverage, Localization in Japan, Digital and smart system readiness, Supply chain reliability) - SWOT Analysis of Key Players
- Pricing and Commercial Model Benchmarking
- Detailed Profiles of Major Companies
Tideland Signal
Carmanah Technologies
Sabik Marine
JFC Manufacturing
Sealite
Zeni Lite Buoy
Shibata Industrial
Nippon Signal
Furuno Electric
Koden Electronics
Tokyo Keiki
Ryokuseisha
Orga
Shinyei Technology
Hokushin Electric
- Demand and utilization drivers
- Procurement and tender dynamics
- Buying criteria and vendor selection
- Budget allocation and financing preferences
- Implementation barriers and operational risks
- Post-installation service and maintenance expectations
- By Value, 2026–2035
- By Volume, 2026–2035
- By Installed Base, 2026–2035
- By Average Selling Price, 2026–2035


 Request a Sample
 Ask for Customization
 Get a Quote
 Enquire Now