
 Download PDF
 Download PDF
Market Overview
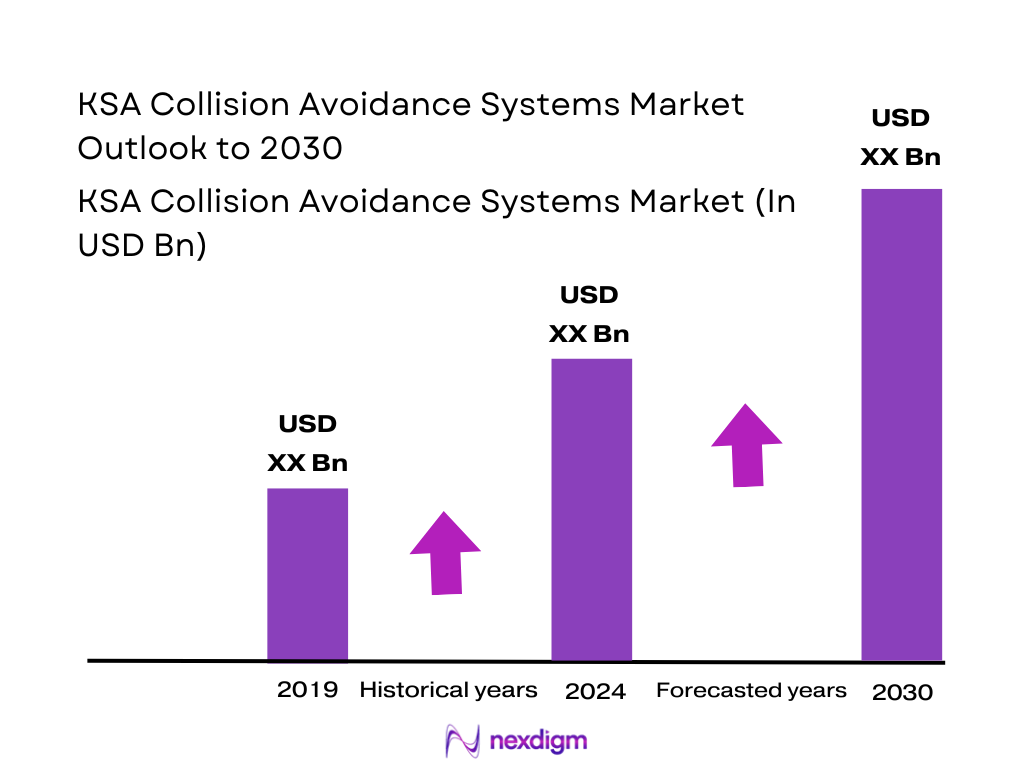
The KSA Collision Avoidance Systems market is sized at USD ~ million in the latest year, up from USD ~ million in the prior year. This expansion is primarily driven by higher factory-fit adoption on newer trims, increased preference for electronically controlled braking/steering assist features in SUVs and premium imports, and the growing need for workshop-grade ADAS calibration capability across dealer networks as systems move from “nice-to-have” to “expected.”
In KSA, demand is concentrated in Riyadh, Jeddah, and Dammam/Al Khobar because these hubs combine the densest vehicle stock, higher daily commuting intensity, and the largest concentration of dealer groups and certified service infrastructure that can support sensor calibration and repairs. On the supply side, the ecosystem is strongly shaped by technology and module imports from Germany, Japan, South Korea, and the U.S., reflecting the Tier-1 dominance in radars/cameras/ECUs and the premium-import mix. Passenger-car sales also rose from ~ units to ~ units, reinforcing the fitment base.
Market Segmentation
By Solution Type
KSA Collision Avoidance Systems market is segmented by solution type into Adaptive Cruise Control (ACC), Automatic Emergency Braking (AEB), Blind Spot Detection (BSD), Lane Departure Warning System (LDWS), Park Assistance, Adaptive Front Lighting (AFL), and Tire Pressure Monitoring System (TPMS). Recently, TPMS holds the dominant share within solution types because it is widely bundled across trims as a safety-and-compliance “baseline” feature, has relatively predictable service and replacement economics, and scales well across passenger vehicles without requiring high-complexity steering/braking integration. In parallel, TPMS adoption is operationally easier for dealers and workshops versus camera/radar-based functions that depend on precise calibration, clean sensor lines-of-sight, and higher diagnostic tooling maturity—especially important in KSA operating conditions (heat/dust) where sensor upkeep and workshop capability directly affect customer experience and warranty outcomes.

By Vehicle Type
KSA Collision Avoidance Systems market is segmented by vehicle type into Passenger Cars, Light Commercial Vehicles (LCV), Heavy Commercial Vehicles (HCV), Buses/Coaches, and Off-road/Utility fleets. Passenger Cars dominate because they represent the largest installation base for factory-fit ADAS packages in the Kingdom and they scale faster through model refresh cycles where collision-avoidance features are bundled into mid/high trims. Passenger demand also benefits from higher showroom feature salience, stronger dealer financing/insurance tie-ins, and broader availability of calibration-ready service points in major cities. Importantly, passenger-car sales increased from ~ units to ~ units, expanding the near-term attach base for collision-avoidance features and accelerating workshop demand for radar/camera diagnostics and calibration.

Competitive Landscape
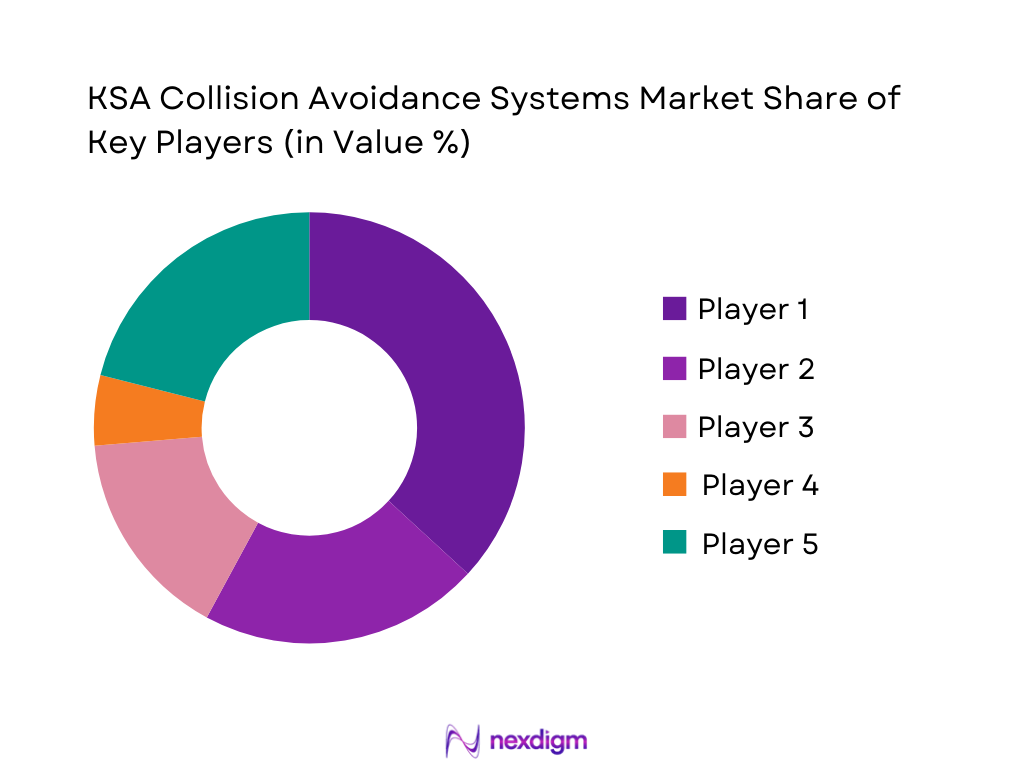
The KSA Collision Avoidance Systems market is shaped by a set of global Tier-1 suppliers and compute/vision ecosystem leaders that influence OEM fitment decisions, sensor/ECU architectures, and service-tool availability. Competitive intensity is highest in camera+radar fusion, AEB/ACC/BSD roadmaps, and dealer-calibration enablement, where local execution (distribution partnerships, training, and parts availability) can be as decisive as product performance.
| Company | Est. Year | HQ | CAS / ADAS Portfolio Depth in KSA | Sensor Modality Strength | Integration Readiness (Brake/Steer/ECU) | OEM Program Exposure | Workshop Calibration Enablement | Local Partner / Aftermarket Route-to-Market |
| Robert Bosch GmbH | 1886 | Germany | ~ | ~ | ~ | ~ | ~ | ~ |
| Continental AG | 1871 | Germany | ~ | ~ | ~ | ~ | ~ | ~ |
| ZF Friedrichshafen AG | 1915 | Germany | ~ | ~ | ~ | ~ | ~ | ~ |
| Mobileye (Intel) | 1999 | Israel | ~ | ~ | ~ | ~ | ~ | ~ |
| DENSO Corporation | 1949 | Japan | ~ | ~ | ~ | ~ | ~ | ~ |
KSA Collision Avoidance Systems Market Dynamics
Growth Drivers
Vision-aligned road safety goals
Saudi road-safety execution is being pushed by a measurable accident and fatality base that keeps collision avoidance on the national agenda. Serious traffic accidents increased from ~ to ~, while traffic accident fatalities declined from ~ to ~ and injuries rose from ~ to ~, showing that frequency and severity management remain live policy and enforcement priorities for the Kingdom’s road system. These dynamics sit inside a large macro capacity context: Saudi Arabia’s GDP is shown at USD ~ trillion and GDP per capita at USD ~, which supports sustained spending on safer mobility, enforcement digitization, and fleet programs that translate into higher demand for AEB, FCW, LDW/LKA, BSD, and pedestrian detection in both new vehicles and commercial fleets. Population scale also matters because exposure grows with mobility; IMF shows Saudi population at ~ million, reinforcing the need for technology-led crash reduction in high-density corridors and intercity routes.
ADAS fitment pull
Fitment pull is amplified by the size and churn of the national vehicle base, which creates a compounding installed base for sensors, ECUs, and calibration services. Registered and roadworthy vehicles rose from ~ million to ~ million, and vehicles registered as a new issue exceeded ~ in the latest year—numbers that structurally expand the addressable parc for collision avoidance. At the same time, first-time driving licenses increased from ~ to ~ and renewals from ~ to ~, indicating rapid onboarding and continued usage—two conditions that typically accelerate OEM and insurer interest in preventive safety tech. From a macro lens, Saudi GDP at USD ~ trillion supports continued vehicle imports, dealer finance penetration, and higher-spec trims where ADAS bundles are more common; IMF inflation for Saudi is shown at 2.1 (annual percent change), signaling a relatively stable consumer environment for upgrading vehicles and maintaining advanced safety systems. The net outcome is stronger baseline demand for collision avoidance at the point of sale plus a widening aftermarket need for sensor calibration, windshield camera alignment, and radar aiming after repairs.
Challenges
Heat/dust performance derating
Saudi operating conditions create a reliability challenge for collision avoidance sensors and perception stacks, because high heat and dust loading can reduce camera clarity, increase radar attenuation/noise, and accelerate wear on connectors and housings—especially on high-mileage fleets. This matters at national scale because the vehicle and accident base is large: registered and roadworthy vehicles reached ~ million, and serious traffic accidents were ~, meaning even a small degradation rate can translate into a high absolute volume of vehicles with impaired performance. The country’s macro context—GDP USD ~ trillion—supports high road activity and long-distance travel, increasing sensor exposure hours. In practice, this creates operating risk in two places: sustained highway driving where radar/camera need stable detection at speed, and intracity conditions where sensor blockage and false alerts can reduce driver trust and adoption. System-level implications include higher needs for sensor cleaning, protective coatings, sealed connectors, thermal management design, and redundancy between camera+radar, plus localized validation in Saudi-like dust and temperature cycles before large fleet deployment.
Calibration bottlenecks
Calibration capacity can become a structural constraint because collision avoidance features are only as good as post-repair calibration quality, and KSA’s parc scale implies heavy throughput demand for workshops and dealer networks. With ~ million registered and roadworthy vehicles and over ~ new vehicle registrations, even routine collision repairs create recurring needs for camera calibration, radar aiming, and ADAS diagnostic validation. The issue intensifies because serious accidents were ~ with ~ injuries, indicating a meaningful crash workload feeding repair pipelines. Macro stability supports continued utilization: IMF inflation is shown at 2.1, and GDP per capita at USD ~, enabling ongoing repair/insurance cycles rather than vehicle write-offs or deferred maintenance. When calibration bandwidth is insufficient, risks include longer repair turnarounds, higher rework, increased false alerts, and degraded AEB/FCW performance—directly impacting insurer outcomes and fleet safety KPIs. The market implication is a bottleneck-driven demand for ADAS calibration bays, technician certification, scan-tool standardization, and QA protocols across multi-brand service networks.
Opportunities
Fleet retrofits at scale
Retrofit opportunity is structurally supported by Saudi’s large active parc and persistent accident volumes, because many vehicles in operation will not have full OEM collision avoidance even as safety expectations rise. With ~ million registered and roadworthy vehicles and serious accidents at ~, fleets have a large base where incremental safety upgrades can be justified through reduced downtime, fewer incidents, and improved insurer/fleet risk ratings—without needing new-vehicle replacement. Importantly, intracity accidents represent 60.3 of serious accidents, favoring retrofit technologies that perform well in dense operating conditions. Logistics intensity reinforces this: road freight imports through land ports increased to ~ million tons, and passenger movements through land ports were ~ million, indicating heavy mobility throughput where commercial fleets can standardize retrofits across operating units. Macro capacity supports procurement: GDP USD ~ trillion and population ~ million reflect a large domestic demand engine that sustains delivery, transport, and infrastructure service fleets. As a result, the retrofit market can scale through bundled deployments tied to enterprise HSE scorecards and insurer partnerships.
ADAS-as-a-service bundles
ADAS-as-a-service can expand faster than pure hardware sales in KSA because it aligns with fleet procurement logic and because the country’s scale creates recurring calibration and compliance needs. The operating base is large—~ million vehicles—and continues to grow through more than ~ new vehicle registrations, while first-time licenses exceeded ~, indicating sustained growth in active drivers and fleet utilization. Accident exposure remains a board-level risk: serious accidents were ~, fatalities ~, and injuries ~, which keeps enterprises open to bundled safety outcomes rather than one-time device purchase. Macro stability supports subscription acceptance: IMF inflation is shown at 2.1, and GDP per capita is USD ~, which supports recurring service models in large corporates and public/private fleet operators. AaaS bundles typically combine retrofit hardware, installation, periodic calibration, software analytics, driver coaching workflows, and reporting—well-suited to KSA’s multi-region fleet footprints where Riyadh, Makkah, and Eastern Region also lead in new driving licenses, signaling high operational density and repeatable scaling pathways.
Future Outlook
Over the next planning cycle, KSA’s Collision Avoidance Systems market is expected to grow as collision-avoidance functions move deeper into mid-volume trims and as fleets formalize safety scorecards that connect incidents to driver coaching, telematics, and insurer-led risk programs. Workshop calibration capacity will be a key “real-world constraint” and also a growth catalyst as dealers invest in alignment rigs, targets, and technician training. System design will continue shifting toward sensor fusion and centralized compute, supporting feature upgrades and better performance in complex driving environments.
Major Players
- Robert Bosch GmbH
- Continental AG
- ZF Friedrichshafen AG
- Aptiv PLC
- Valeo
- DENSO Corporation
- Magna International
- FORVIA HELLA
- Autoliv Inc.
- Mobileye
- NVIDIA
- Qualcomm
- Hyundai MOBIS
- Hitachi Astemo
- NXP Semiconductors
Key Target Audience
- Heads of ADAS/Active Safety Procurement
- Heads of Product Planning & Trim Strategy
- Fleet Safety & Risk Directors
- Claims & Underwriting Heads
- Heads of Aftermarket & Service Operations
- Heads of Smart Mobility / ITS Programs
- Government and regulatory bodies
- Investments and venture capitalist firms
Research Methodology
Step 1: Identification of Key Variables
We build a KSA ecosystem map spanning OEMs/importers, Tier-1s, sensor/compute suppliers, dealers, calibration centers, fleets, and insurers. Desk research is used to define collision-avoidance scope (AEB/ACC/BSD/LDWS/park safety) and identify adoption drivers unique to KSA operating conditions.
Step 2: Market Analysis and Construction
We compile historical adoption signals and map fitment pathways across new-vehicle trims and fleet retrofit programs. The model is constructed using a combined top-down (vehicle market + feature packaging) and bottom-up (solution-type revenue pools + service/calibration capacity) approach.
Step 3: Hypothesis Validation and Expert Consultation
Hypotheses on dominant solution types, channel economics, and calibration bottlenecks are validated via CATIs with dealer service heads, fleet safety leaders, distributors, and technical experts. Insights are used to reconcile discrepancies and confirm practical adoption constraints.
Step 4: Research Synthesis and Final Output
We synthesize findings into segment-wise sizing and competitive positioning, cross-verifying with published market databooks and stakeholder interviews. Final outputs emphasize actionable implications: GTM pathways, localization levers, service enablement, and partnership models.
- Executive Summary
- Research Methodology (Market definitions & boundaries, assumptions, abbreviations, triangulation logic, primary interview plan, validation steps, limitations)
- Definition and scope
- Genesis of collision avoidance adoption in KSA
- Market evolution timeline
- Business cycle lens
- Value chain and supply chain map

- Growth drivers
Vision-aligned road safety goals
ADAS fitment pull
insurance/claims pressure
giga-project mobility
fleet safety scorecards - Challenges
heat/dust performance derating
calibration bottlenecks
mixed parc age
counterfeit sensors
driver behavior/adoption - Opportunities
fleet retrofits at scale
ADAS-as-a-service bundles
insurer-linked discounts
V2X pilots
HD-mapping partnerships - Technology & product trends
- Pricing & commercialization trends
- Demand shock scenarios
- Regulatory, Standards & Compliance Landscape
- By value, 2019-2024
- By volume, 2019-2024
- By average selling price, 2019-2024
- By CAS function stack (in Value %)
AEB
FCW
ACC
LKA/LDP
BSD
- By sensing modality (in Value %)
camera
radar
ultrasonic
LiDAR
sensor-fusion multi-modal
- By vehicle type (in Value %)
passenger cars
SUVs/crossovers
LCVs
HCVs
buses/coaches
- By fitment type (in Value %)
factory-fit OEM
dealer-fit accessories
aftermarket retrofit
fleet-installed telematics-ADAS hybrids - By autonomy/feature tier (in Value %)
L0 safety alerts
L1 single-function assist
L2 multi-function assist
L2+ supervised highway assist
L3-ready packages
- By propulsion/architecture (in Value %)
ICE
HEV
PHEV
BEV
- By end user (in Value %)
private retail
ride-hailing
logistics fleets
public sector fleets
giga-project fleets
- By region within KSA (in Value %)
Central
Western
Eastern
Northern
Southern
- Competition ecosystem map
- Market share benchmarking
- Cross Comparison Parameters (Homologation & SASO alignment readiness, AEB/LKA compliance maturity, Desert-performance robustness, ADAS calibration & service footprint in KSA, Sensor-fusion + compute roadmap, Fleet retrofit capability, Data governance & cybersecurity posture, Local partnerships & ecosystem leverage)
- SWOT benchmarking of leading players
Strategic moves tracker - Company Profiles
Robert Bosch GmbH
Continental AG
ZF Friedrichshafen AG
Aptiv PLC
Valeo
DENSO Corporation
Magna International
FORVIA HELLA
Autoliv Inc.
Mobileye
NVIDIA
Qualcomm
Hyundai MOBIS
Hitachi Astemo
- Private retail buyers
- Logistics and commercial fleets
- Public sector and municipal fleets
- Giga-project fleets
- Ride-hailing operators
- By value, 2025-2030
- By volume, 2025-2030
- By average selling price, 2025-2030


 Request a Sample
 Ask for Customization
 Get a Quote
 Enquire Now