
 Download PDF
 Download PDF
Market Overview
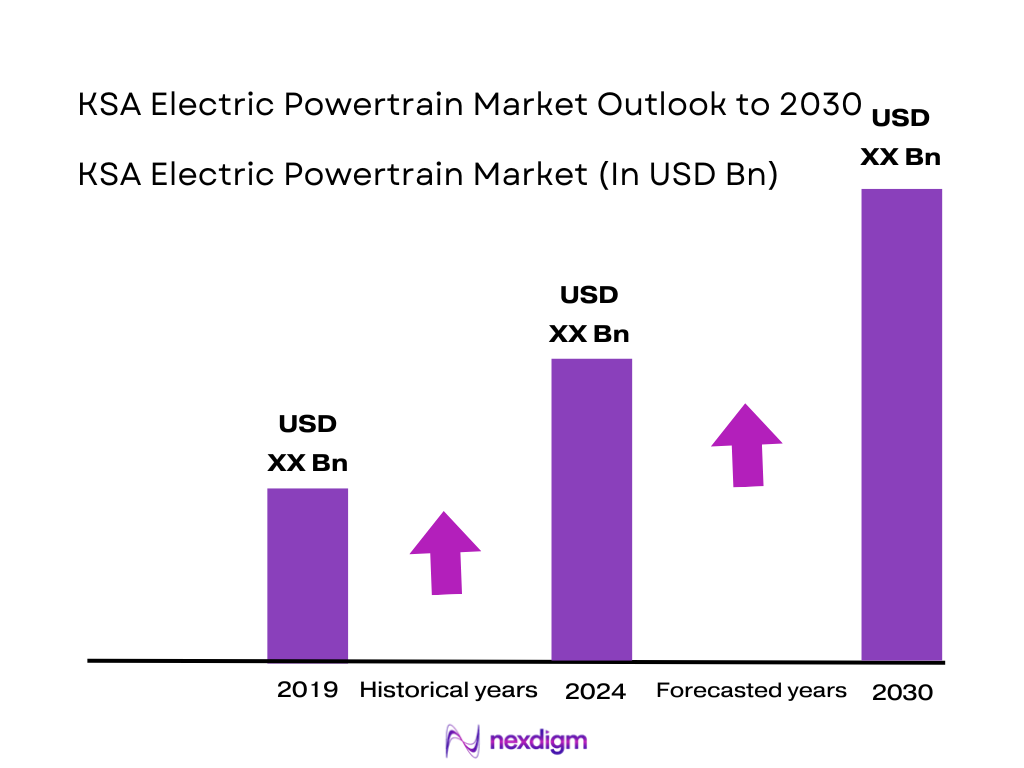
The KSA Electric Vehicle market is valued at USD ~ billion, based on a five-year historical analysis. This market value is driven by rapid EV adoption, supported by national sustainability programs and investments through Vision 2030. The accelerated expansion of public charging infrastructure and increasing consumer interest in clean transportation continue to push demand for electric powertrain systems. Strong government-backed fleet electrification initiatives and partnerships with global EV companies further boost adoption.
Riyadh, Jeddah, and NEOM dominate the KSA electric powertrain ecosystem due to concentrated economic activity, infrastructure readiness, and large-scale mobility projects. Riyadh leads with strong government fleet usage and rapidly expanding charging corridors. Jeddah benefits from high private ownership of premium EVs and port-driven commercial activity, which accelerates electrified logistics fleets. Meanwhile, NEOM stands out as a fully electrified smart city under development, attracting global OEM partnerships for next-generation electric powertrain deployments. These cities naturally anchor demand across both consumer and commercial segments.
Market Segmentation
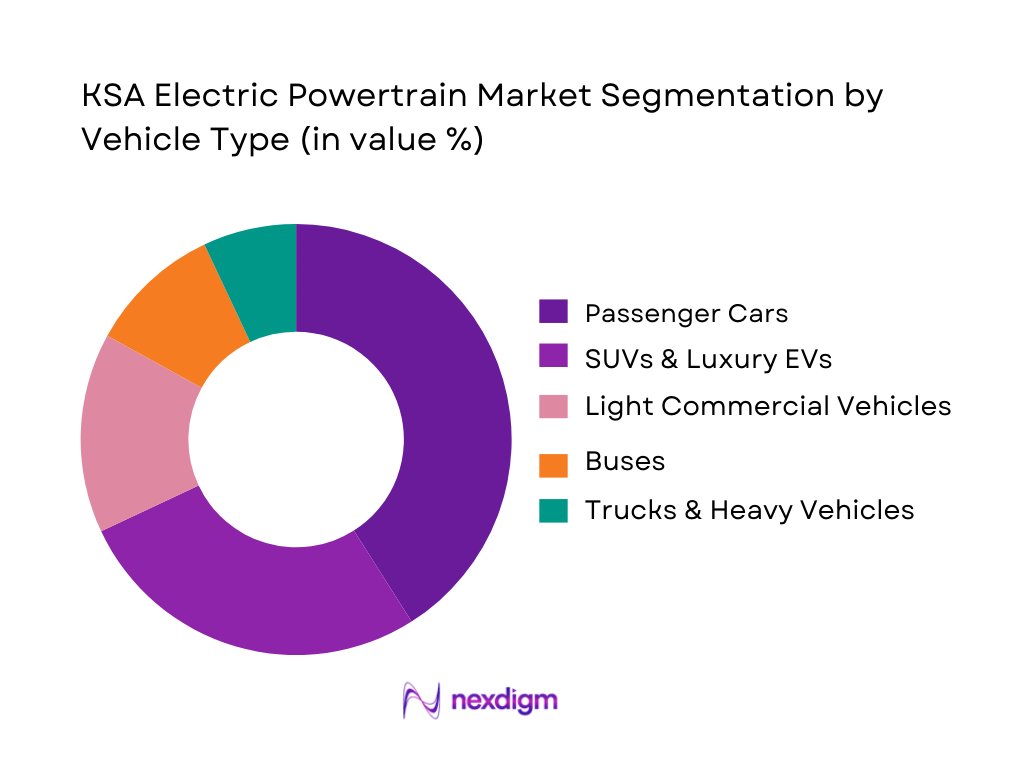
By Vehicle Type
Passenger cars currently dominate the KSA Electric Powertrain Market under the vehicle type segment. This dominance is driven by rapidly increasing consumer adoption of EVs from brands such as Tesla, BYD, and Lucid, which have strong market presence in urban regions. Government programs that encourage clean mobility, including EV financing support and charging station expansion, further enhance uptake. Premium and mid-range passenger EVs remain attractive to buyers due to high fuel savings, technological sophistication, and alignment with national sustainability goals, solidifying this segment’s leadership.
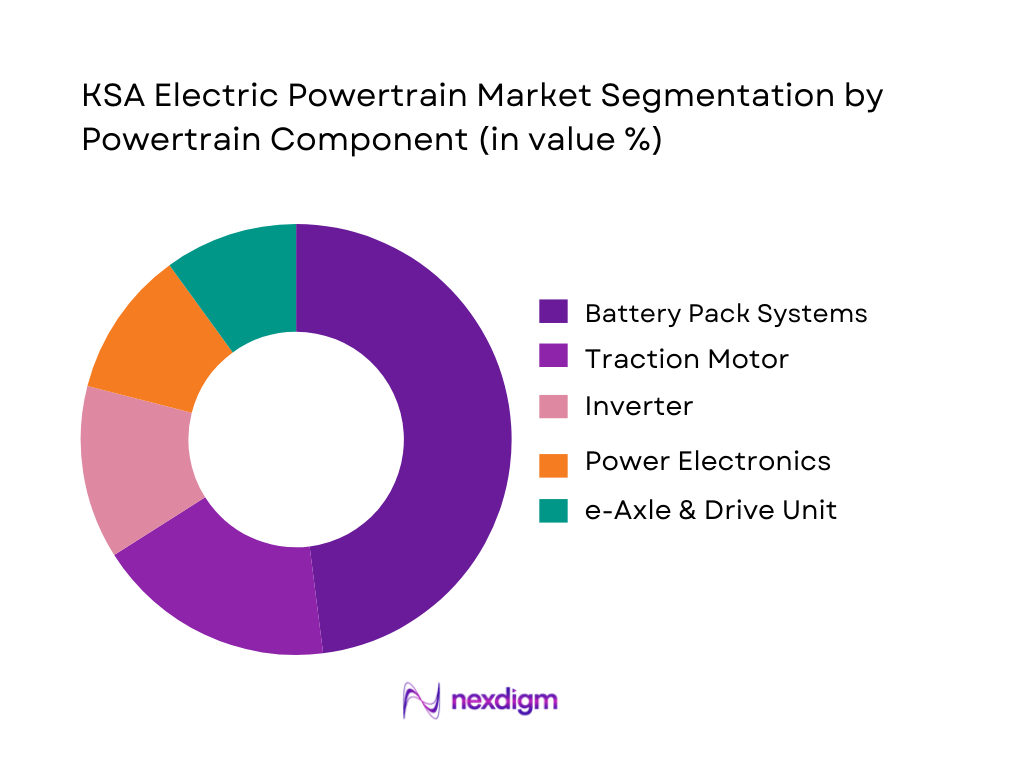
By Powertrain Component
Battery pack systems dominate the market share under the powertrain component segmentation due to their substantial cost contribution to overall EV production and their central role in vehicle performance and range. As the Kingdom invests significantly in battery assembly initiatives and local manufacturing partnerships, this segment is gaining strategic importance. The increasing deployment of long-range EVs in Saudi Arabia’s hot-climate conditions creates high demand for advanced thermal-managed battery systems, reinforcing the segment’s position as the core revenue driver in the electric powertrain value chain.
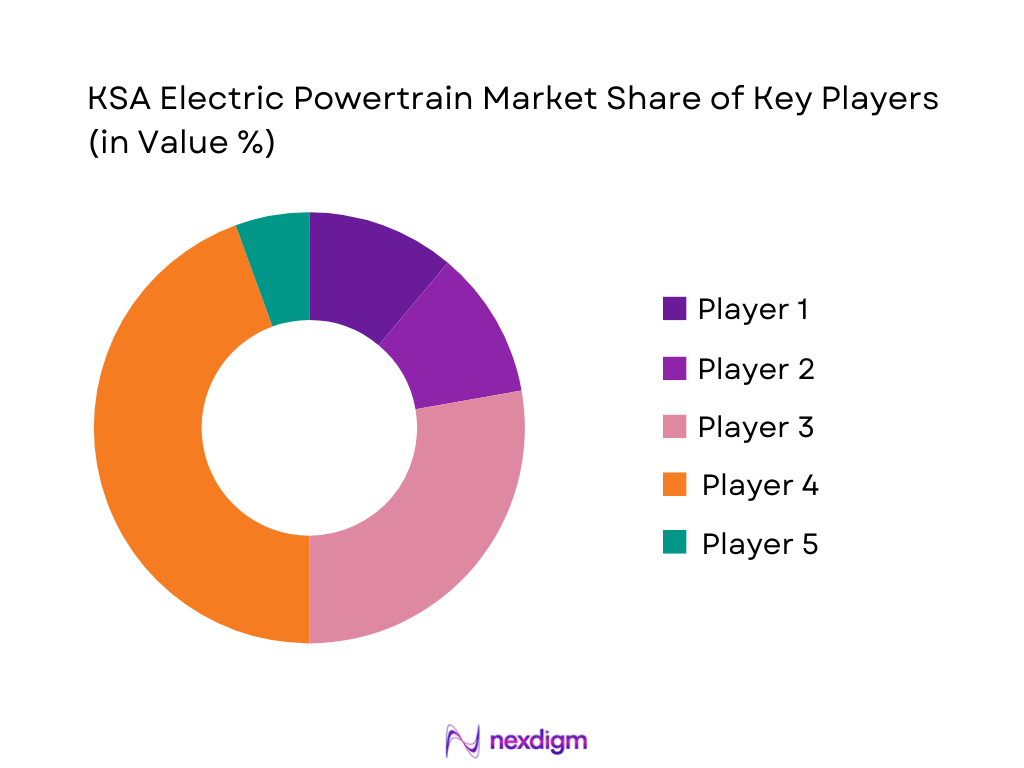
Competitive Landscape
The KSA Electric Powertrain Market is characterized by a mix of global EV manufacturers, Tier-1 suppliers, and emerging national players. Companies such as Lucid, Tesla, and BYD have strong influence due to their advanced powertrain technologies and early investment in the Kingdom. Local players like Ceer Motors and charging infrastructure enterprises further create an integrated ecosystem. The competitive environment shows consolidation around players with strong R&D capabilities, battery technologies, and high-voltage powertrain solutions.
| Company | Establishment Year | Headquarters | KSA Presence Model | Key Powertrain Strength | Battery Technology Capability | Voltage Architecture | Fleet/Ecosystem Partnerships | Manufacturing/Assembly Footprint |
| Lucid Motors | 2007 | USA | ~ | ~ | ~ | ~ | ~ | ~ |
| Ceer Motors | 2022 | Saudi Arabia | ~ | ~ | ~ | ~ | ~ | ~ |
| Tesla | 2003 | USA | ~ | ~ | ~ | ~ | ~ | ~ |
| BYD | 1995 | China | ~ | ~ | ~ | ~ | ~ | ~ |
| Bosch Mobility | 1886 | Germany | ~ | ~ | ~ | ~ | ~ | ~ |
KSA Electric Powertrain Market Analysis
Growth Drivers
National Decarbonization Objectives
Saudi Arabia’s macro agenda directly pulls the KSA Electric Powertrain Market forward. The Kingdom has committed to reduce or avoid 278 million tons of CO₂ equivalent annually under its updated national contribution, making transport electrification a key lever for that goal. At the same time, national GDP reached about USD ~ trillion in 2024, providing the fiscal capacity to fund large-scale green transport programs. Population rose to roughly 35.3 million people in 2024, with most residents concentrated in urban corridors where vehicle emissions are highest. These macro indicators, combined with Vision 2030’s net-zero-by-2060 ambition, create a policy and economic environment where electrified powertrains become central to decarbonizing a fast-growing, oil-intensive transport system.
Vehicle Parc Growth
The rapid expansion of Saudi Arabia’s vehicle parc magnifies both emissions and the addressable base for electric powertrains. The General Authority for Statistics reports 14.9 million vehicles in the Kingdom in 2022 and more than 15.8 million vehicles in use by the end of 2024, with over 1 million newly registered in 2024 alone, Road Transport 2024 PDF). This accelerating parc sits on a growing economic base, with GDP at USD ~ trillion in 2024. As more than ~ million tons of domestic road freight moved in 2022, the link between vehicles and logistics emissions is tightening. Together, these numbers indicate a large installed fleet where switching even a small share to electric powertrains translates into meaningful decarbonization and sustained component demand.
Challenges
Charging Coverage Gaps
Charging coverage remains a structural bottleneck for the KSA Electric Powertrain Market. Reuters reports that the country operated just 101 charging stations in 2024, with no chargers installed on the 900-kilometre Riyadh–Mecca corridor, a key axis for passenger and freight flows. Yet the paved road network already extends to 266,000 kilometres within and between cities as of 2022, illustrating how much of the network remains unelectrified in charging terms. With 15.8 million vehicles in use by end-2024 and more than 1 million new registrations each year, the ratio of chargers to vehicles is extremely low (Road Transport 2024 PDF). Bridging this gap is essential for mainstream powertrain electrification beyond early adopters in a market of 35.3 million people.
Grid Readiness & Peak Load Management
Electrifying transport at scale will add to an already large and seasonally stressed power system. Saudi Arabia’s installed power generation capacity reached around 83.5 GW by 2022, giving it the largest capacity base in MENA. However, summer electricity demand drives high fossil-fuel burn: U.S. EIA data show monthly crude and fuel oil used for power generation hitting ~ million barrels per day in June 2024, the highest since June 2022 at ~ million barrels per day. At the macro level, GDP of USD ~ trillion and population of 35.3 million mean continued expansion in air-conditioning and industrial loads. Adding fast-charging hubs, depots for e-buses, and high-power truck chargers onto this system requires grid reinforcements, smarter load management, and integration with the Kingdom’s renewable build-out to avoid exacerbating peak-load challenges.
Opportunities
High-Utilization Fleet Conversion
High-mileage fleets offer immediate, data-backed opportunities for electric powertrains in Saudi Arabia. GASTAT figures show 43.5 million passengers carried by public buses within and between cities in 2022, a more than threefold jump compared with 2021, and 209 million tons of domestic road freight moved in the same year. With 15.8 million vehicles in use by end-2024, a significant share of kilometres comes from taxis, ride-hailing fleets, logistics operators and government vehicles, where predictable routes and high daily mileage favour total-cost-of-ownership gains from electrification (Road Transport 2024 PDF). Meanwhile, the agreement to purchase up to 100,000 Lucid EVs for government use over ten years illustrates how fleet commitments can anchor early demand for specialised powertrain systems. These macro and fleet statistics indicate a large, concentrated opportunity for e-powertrains in duty cycles where energy savings and emissions cuts are most material.
e-Buses and e-Trucks for Corridors
Intercity passenger and freight corridors represent one of the most compelling near-term opportunities for electric powertrains. Saudi Arabia’s domestic road freight reached ~ million tons in 2022, moving mainly along a paved network of 266,000 kilometres linking key economic hubs. Public buses carried 43.5 million passengers that same year, highlighting the scale of corridor-based mobility that could shift to e-buses with depot charging). On the macro side, Saudi Arabia’s electricity capacity of 83.5 GW and continued investment in renewables and grid expansion support the deployment of high-power charging hubs for e-trucks at logistics nodes and dry ports. With GDP of USD ~ trillion and a strategic aim to be a global logistics hub, converting a modest share of corridor freight and bus activity to electric powertrains can materially reduce fuel burn and emissions while creating stable demand for heavy-duty e-axles, inverters and battery packs.
Future Outlook
Over the next six years, the KSA Electric Powertrain Market is expected to expand significantly due to strong regulatory backing, deepening electrification of commercial transport, and aggressive smart-city developments such as NEOM. As local manufacturing strengthens and fleet operators increasingly shift to EVs, demand for advanced powertrain systems—including high-voltage architectures—will rise sharply. Technological advancements in battery chemistry, thermal management, and e-axle integration will also shape future growth trajectories.
Major Players
- Lucid Motors
- Ceer Motors
- Tesla
- BYD
- Bosch Mobility
- BorgWarner
- ZF Friedrichshafen
- Magna International
- Nidec Corporation
- Valeo
- Siemens e-Mobility
- ABB E-Mobility
- Electromin
- EVIQ (Electric Vehicle Infrastructure Co.)
Key Target Audience
- Electric Vehicle Manufacturers
- Tier-1 Powertrain Component Suppliers
- Fleet Operators & Logistics Companies
- Automotive OEM Investment Divisions
- Charging Infrastructure Developers
- Investments & Venture Capital Firms
- Government & Regulatory Bodies
- Utility & Energy Providers
Research Methodology
Step 1: Identification of Key Variables
This step involves mapping the full electric mobility ecosystem in Saudi Arabia, including OEMs, suppliers, fleet operators, and charging operators. Extensive desk research using reputable databases, government publications, and energy transition reports is carried out. The goal is to identify the factors that influence EV adoption, powertrain component demand, and cost structures.
Step 2: Market Analysis and Construction
Historical EV sales, fleet registration data, and electric drivetrain penetration levels are assessed to compute the underlying powertrain revenue pool. Market ratios such as component content per vehicle and cost distribution within the powertrain system are analyzed. This provides a foundation for value and volume estimations aligned with real operational and technology deployment trends.
Step 3: Hypothesis Validation and Expert Consultation
Industry hypotheses are tested through structured interviews with OEM executives, powertrain engineers, charging operators, and fleet managers. These conversations deliver insights on battery procurement, powertrain sourcing, and expected technology shifts. Opinions from R&D and technical experts support the fine-tuning of financial assumptions and penetration scenarios.
Step 4: Research Synthesis and Final Output
The final step consolidates quantitative and qualitative findings into a validated dataset. Discussions with EV manufacturers and powertrain suppliers help verify component volumes, average selling prices, and future demand expectations. The research output ensures reliable insights for strategic decision-makers in Saudi Arabia’s electric mobility landscape.
- Executive Summary
- Research Methodology (Market Definitions, Taxonomy and Scope, Abbreviations, Technical Terms and Standards, Market Sizing & Forecasting Approach, Primary Research Framework, Secondary Research Sources, Data Triangulation and Validation, Assumptions, Limitations and Scenario Building)
- Definition and Scope of KSA Electric Powertrain Market
- Evolution of e-Mobility and Powertrain Landscape in KSA
- Policy, Regulatory and Incentive Landscape
- Value Chain and Supply Chain Structure
- Role of Sovereign Funds, Utilities and Industrial Clusters

- Growth Drivers
National Decarbonization Objectives
Vehicle Parc Growth
Giga-Projects & New Cities
Sovereign-Fund Backed Investments
Charging Network Expansion
Consumer & Fleet Sustainability Agendas - Challenges
Charging Coverage Gaps
Grid Readiness & Peak Load Management
Hot-Climate Stress on Batteries & Power Electronics
Supply Chain Depth & Localization Limits
Skills & Talent Gaps - Opportunities
High-Utilization Fleet Conversion
e-Buses and e-Trucks for Corridors
Integrated e-Powertrain Export from KSA
Battery Pack Assembly & Module Manufacturing
Software-Defined Powertrain Services - Key Technology and Architecture Trends
- Regulatory, Policy and Incentive Analysis
- Supply Chain, Localization and Saudization Analysis
- Stakeholder and Ecosystem Mapping
- By Value, 2019-2024
- By Volume, 2019-2024
- Installed EV & e-Powertrain Parc in KSA, 2019-2024
- By Value Chain Node, 2019-2024
- By Import vs Local Manufacturing, 2019-2024
- By Vehicle Type (in Value %)
Passenger Cars & Crossovers
SUVs & Premium Vehicles
Light Commercial Vehicles & Pickups
Buses & Coaches
Trucks, Vans & Last-Mile Delivery Vehicles - By Powertrain Architecture (in Value %)
Battery Electric Powertrains
Plug-In Hybrid Electric Powertrains
Hybrid Electric Powertrains
Fuel Cell Electric Powertrains
48V Mild Hybrid e-Drive Systems - By Powertrain Component (in Value %)
High-Voltage Battery Pack Systems
Traction Motors & Motor-Generators
Inverters & Power Electronics Modules
Integrated e-Axles & Electric Drive Units
Onboard Chargers & DC-DC Converters - By Voltage Level (in Value %)
Sub-400V Systems
400V-Class Systems
800V-Class Systems
Above-800V High-Performance Systems - By Propulsion Power Band (in Value %)
Up to 100 kW
100–200 kW
200–400 kW
Above 400 kW - By End-User Fleet Segment (in Value %)
Private Retail Customers
Government & Municipal Fleets
Corporate & Leasing Fleets
Ride-Hailing & Shared Mobility Operators
Logistics, Delivery & E-Commerce Fleets - By Region (in Value %)
Riyadh & Central Region
Makkah Region including Jeddah
Eastern Province including Dammam
Madinah, Tabuk & NEOM Corridor
Other Cities & Secondary Corridors
- Market Share Analysis of Major Players
- Cross Comparison Parameters (KSA Installed e-Powertrain Capacity, Localization & Saudization Share in Component Stack, High-Voltage Architecture Readiness, Thermal & Reliability Performance under Desert Duty Cycles, Integration with Connected & ADAS Platforms, Strategic Alignment with National Programs & Sovereign Funds, After-Sales & Charging Ecosystem Coverage, Technology Roadmap for Next-Generation e-Powertrains)
- Strategic Positioning and Clustering of Major Players
- Pricing and TCO Benchmarks for e-Powertrain Configurations
- Detailed Profiles of Major Companies
Lucid Group
Ceer Motors
Tesla
BYD
Bosch Mobility Solutions
BorgWarner
ZF Friedrichshafen
Nidec Corporation
Magna International
Valeo
Siemens e-Mobility
ABB E-mobility
Electromin
Electric Vehicle Infrastructure Company
- Fleet Archetypes and Duty Cycles
- Adoption Drivers by End-User Segment
- Purchase Criteria and Specification Behaviour
- Pain Point and Barrier Analysis
- Decision-Making Units and Buying Centres
- By Value, 2025-2030
- By Volume, 2025-2030
- Installed EV & e-Powertrain Parc in KSA, 2025-2030
- By Value Chain Node, 2025-2030
- By Import vs Local Manufacturing, 2025-2030


 Request a Sample
 Ask for Customization
 Get a Quote
 Enquire Now