
 Download PDF
 Download PDF
Market Overview
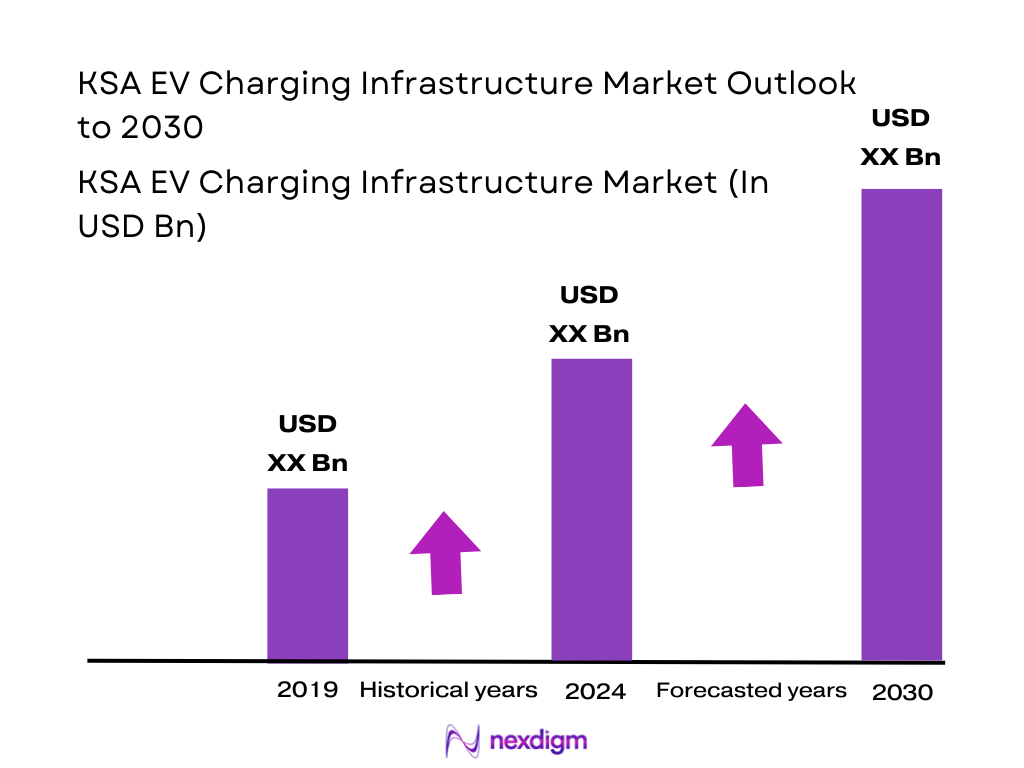
The Saudi Arabia EV charging infrastructure market is valued at USD ~ million in 2024. This market size has been driven by a rapid scale-up in public charging infrastructure: public charging stations grew from around 150 in 2022 to over 1,000 by early 2024, reflecting strong government-backed efforts under national electrification and decarbonization initiatives. Saudi Arabia—and specifically its major urban centers such as Riyadh, Jeddah and growing corridor/tourism zones—dominate the market. The dominance stems from high EV adoption ambitions in large metropolitan areas, government initiatives to integrate EV infrastructure in urban planning, and concentration of population, commuting demand, and fleet operations there, which together make urban and inter-city corridors the primary loci for charging infrastructure deployment.
Market Segmentation
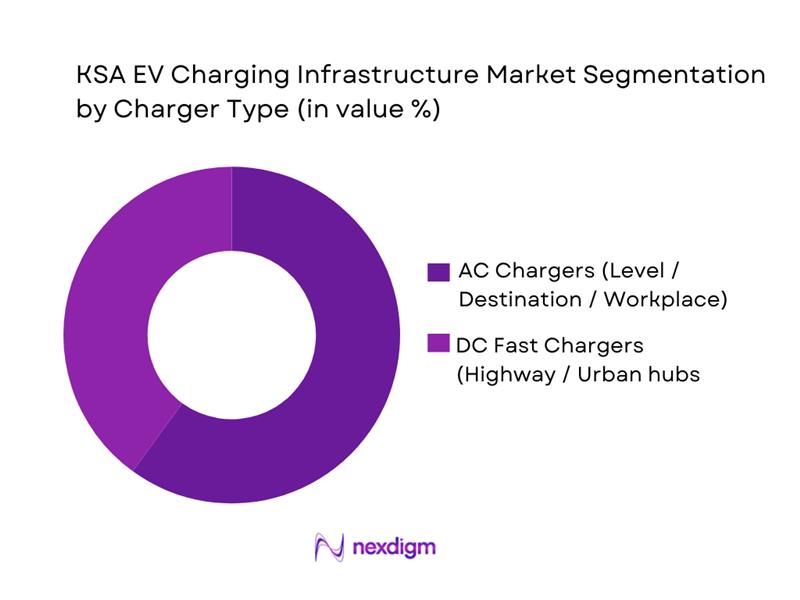
By Charger Type
The market is segmented into AC chargers and DC fast chargers. In 2024, AC chargers hold the majority share (approx. 60%), reflecting the early stage of charging infrastructure rollout, where workplaces, residential complexes, malls and retail destinations prioritized lower-cost, easy-to-deploy AC charging solutions for convenience charging during dwell time. AC chargers demand lower grid upgrade requirements and suit urban usage patterns where vehicles are parked for extended durations, making them the dominant sub-segment. As the EV ecosystem matures, DC fast chargers are used for rapid turnaround and long-distance travel, but currently their smaller base explains their 40% share.
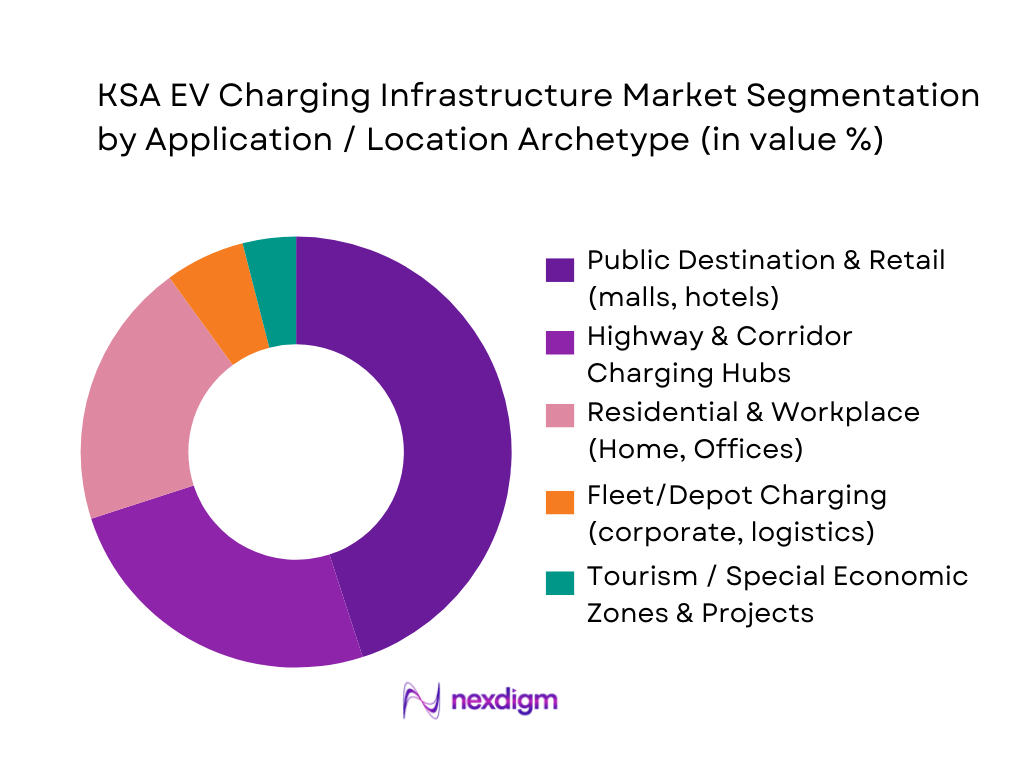
By Application / Location Archetype
Among these, “Public Destination & Retail” charging (malls, hotels, shopping centers, public parking) commands the leading share at approx. 45%. This is because urban population density, high dwell-time in retail centers, and rising EV adoption among private vehicle owners make destination charging highly convenient. Such locations offer extended parking durations, allowing AC or moderate-speed charging during shopping or leisure visits. The second largest sub-segment is “Highway & Corridor Charging Hubs” (25%), driven by expanding inter-city travel, tourism, and the need for fast chargers for long-distance travel. Residential & workplace charging follows (20%), reflecting increasing adoption among urban dwellers and corporate employees but constrained by slower progress in residential charger roll-out. Fleet/depot usage and special projects remain nascent, currently forming small shares, but expected to grow in future as commercial electrification proceeds.
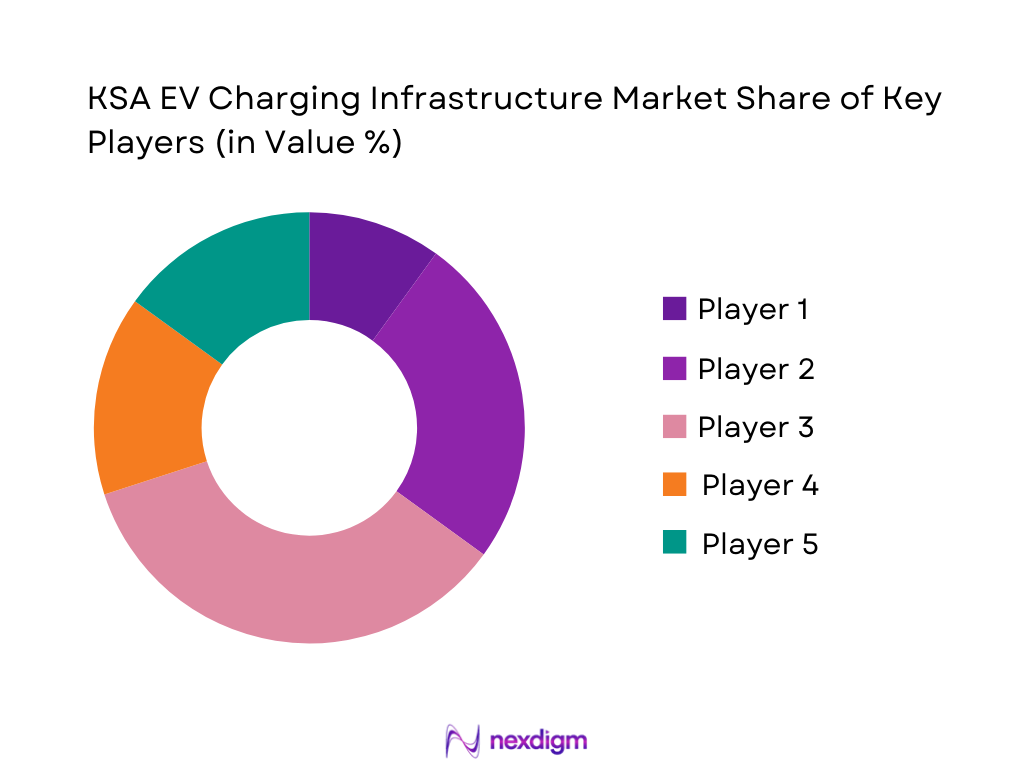
Competitive Landscape
The KSA EV charging infrastructure market is beginning to consolidate, with a handful of major infrastructure developers, utilities and global hardware providers leading deployments. The competitive environment is shaped by public–private partnerships, national targets, and investments in fast chargers across corridors and cities.
| Company (Major Player) | Establishment Year | Headquarters | Installed Public Connectors (est.) | DC Fast/Ultra-fast Capacity | Corridors & Geographic Coverage (cities/highways) | Service & Interoperability Features (smart-charging, roaming) |
| EVIQ (national EV infra platform) | 2023 | Riyadh, Saudi Arabia | ~ | ~ | ~ | ~ |
| Electromin (multi-city CPO/eMSP) | 2019 | Saudi Arabia | ~ | ~ | ~ | ~ |
| Saudi Electricity Company – EV Charger Services | Utility-backed (legacy utility) | Saudi Arabia | ~ | ~ | ~ | ~ |
| Red Sea Global – Off-Grid & Tourism Charging | 2021 (approx.) | Saudi Arabia | ~ | ~ | ~ | ~ |
| International / Global EV Charger & Infrastructure Providers (hardware + network) | Varies | Global / Regional HQ | ~ | ~ | ~ | ~ |
KSA EV Charging Infrastructure Market Analysis
Growth Drivers
EV targets, air-quality and decarbonisation objectives
Saudi Arabia’s push for EV charging is anchored in a fast-growing, energy-intensive economy and a clear decarbonisation agenda. National GDP reached about SAR ~ trillion in current prices based on updated estimates from the statistics authority in its latest comprehensive revision of accounts. The population is estimated at 35,300,280 residents, concentrating transport demand in a few large metros. At the same time, the updated nationally determined contribution commits the Kingdom to cutting greenhouse-gas emissions by hundreds of millions of tonnes of CO₂-equivalent annually by the end of the decade. This combination of a SAR-trillion-scale economy, more than 35 million residents and quantified mitigation targets is driving policy incentives, city-level EV adoption plans and utility-backed investment in public charging as a core tool for improving urban air quality and aligning the transport sector with national climate objectives.
Giga-project mobility designs
The Kingdom’s giga-projects are effectively large, master-planned demand pockets for EV charging. NEOM alone spans 26,500 square kilometres in northwest Saudi Arabia and is planned to operate entirely on renewable energy. Tourism is another major driver: Saudi Arabia received 109.3 million domestic and inbound tourists who spent about SAR 255.6 billion on travel in one recent year, according to the Ministry of Tourism. A separate update reports 30 million international visitors with spending of SAR 153.6 billion in the following year. These mega-developments and tourism clusters—NEOM, the Red Sea, Qiddiya, AlUla and others—are being designed with car-light, electric, shared and autonomous mobility baked into their urban plans, creating concentrated demand for high-density fast-charging corridors, depot charging and destination charging across hotels, resorts and experience zones.
Market Challenges
Grid reinforcement needs
Rapid growth in underlying power demand means EV charging must be integrated into an already stretched grid. Grid peak load in the Kingdom climbed to about 74.8 gigawatts over the first nine months of 2024, with electricity consumption reaching 256 terawatt-hours in the same period. Commercial guides for the power sector indicate installed generation capacity around 83 gigawatts in 2023, with further growth required through the mid-2020s. Academic assessments note that Saudi electricity demand is expected to roughly double by 2030 if not mitigated. Against this backdrop, plans to deploy thousands of fast chargers imply multi-megawatt load clusters on urban feeders and highways, requiring systematic investment in substations, medium-voltage networks and smart-grid controls to avoid localised congestion and preserve reliability indicators across the 70+ gigawatt system.
Permitting timelines
Permitting complexity is a non-trivial bottleneck because charging roll-out overlaps transport, municipal, utility and environmental jurisdictions. In the logistics sector alone, the government budgeted rail freight capacity of 12.8 million tons and 800,000 container-equivalent units for one recent year, alongside 49 road projects spanning 3,690 kilometres of repairs and upgrades in the same planning cycle. The National Transport and Logistics Strategy sets out ambitious multi-modal infrastructure goals, including higher air-freight volumes and expanded road and rail networks. Each project involves land allocation, right-of-way approvals, grid-connection permits and safety reviews, with multiple ministries and regulators. When similar processes are applied to hundreds of public fast-charging sites across highways, parking assets and logistics hubs, cumulative lead times—measured across years of planning cycles and dozens of agencies—can slow deployment relative to vehicle adoption.
Opportunities
Tourism corridors
Tourism electrification corridors are a prime near-term opportunity for charging investors. Saudi Arabia welcomed 109.3 million tourists—81.9 million domestic and 27.4 million international—in one recent year, with total spending of about ~ billion riyals. Another update shows 30 million international visitors generating ~ billion riyals of spending and a travel surplus of 49.8 billion riyals the following year. Within that, more than 8.6 million Gulf Cooperation Council tourists alone spent over ~ billion riyals in the Kingdom. These flows are highly corridor-based—linking Jeddah, Mecca, Madinah, the Red Sea coast, AlUla and emerging leisure destinations. Curated networks of fast chargers at airports, intercity highways, gateway cities, religious hubs and coastal resorts can capture vehicle-kilometres associated with hundreds of billions of riyals in tourism receipts, positioning charging assets as essential infrastructure for both domestic and international travellers shifting to EVs.
Logistics electrification
Road-freight and logistics decarbonisation create another powerful demand pool for charging, especially depot- and corridor-based high-power solutions. A recent logistics overview notes that Saudi Arabia handled about ~ million tonnes of goods and around 8 million tonnes of freight in one reporting year under the National Transport and Logistics Strategy framework. The strategy also references targets to grow transport and logistics’ share of GDP from around 6% to 10%, with ambitions to expand railways to 8,080 kilometres and ports to 40 million TEUs of throughput. Meanwhile, the statistics authority estimates the national population at over 35.3 million residents, underpinning sustained e-commerce and distribution demand. Electrifying even a fraction of the trucks serving 200+ million tonnes of goods and multi-million-tonne freight flows will require megawatt-scale charging at logistics parks, industrial zones and cross-border corridors, opening long-term partnership opportunities between CPOs, 3PLs and infrastructure funds.
Future Outlook
Over the next six years, the Saudi Arabia EV charging infrastructure market is expected to experience robust growth, driven by the Kingdom’s clean mobility ambitions, expansion of EV fleets, and government-backed infrastructure initiatives. Demand for fast DC charging will rise sharply, especially along inter-city corridors and in mega-project zones, while destination and workplace charging will steadily expand in urban centers. Grid modernization, smart-charging integration, and renewable-powered charging hubs (solar + storage) are likely to become key differentiators. As manufacturing and localization of EV-related hardware scale up, the cost and deployment pace will accelerate — creating attractive opportunities for infrastructure investors, fleet operators, and energy utilities alike.
Major Players
- EVIQ
- Electromin
- Saudi Electricity Company
- Red Sea Global
- NEOM Mobility
- MOTEVS
- CITA EV Charger
- ABB E-Mobility
- Siemens Smart Infrastructure
- ChargePoint
- Blink Charging
- Tesla Supercharger Network
- BP Pulse / Energy-major backed charging & forecourt integration
- XCharge
- FIT Smart Mobility
Key Target Audience
- Institutional investors and venture capital firms
- Utility companies and grid operators
- Automotive OEMs
- Large fleet operators
- Real-estate developers and mall/hospitality operators
- Government and regulatory bodies
- Infrastructure project developers and EPC contractors
- Energy and power utilities
Research Methodology
Step 1: Identification of Key Variables
Defined the charging infrastructure market’s scope: public vs private charging, charger types (AC/DC), application types (residential, fleet, corridor, retail), geographic clusters. Desk research was carried out using secondary data from industry-specific published reports and databases.
Step 2: Market Analysis and Construction
Aggregated historical data for charger installations, public charging station counts, EV fleet growth, and energy demand. Analyzed the distribution of charger types, site archetypes and associated utilization patterns to infer revenue potential and infrastructure demand.
Step 3: Hypothesis Validation and Expert Consultation
Market assumptions (e.g., expected charger demand per EV, utilization rates, corridor vs urban split) were validated via interviews with industry experts from CPOs, utility providers, fleet operators, and city planning authorities.
Step 4: Research Synthesis and Final Output
Combined bottom-up site-level modeling (projecting number of chargers, energy throughput, revenue per site) with top-down macro-trend analysis (EV adoption forecasts, regulatory targets) to produce validated and comprehensive market size, segmentation, and forecast estimates.
- Executive Summary
- Research Methodology (Key Parameters: definition of charging site & connector as unit of analysis, AC/DC power-band classification, CPO/eMSP/operator typology, bottom-up site archetype model, top-down EV parc & mileage model, electricity demand translation, scenario framing, limitation notes)
- Definition and Scope of EV Charging Infrastructure
- Evolution of EV Ecosystem and Charging Roll-Out
- Role of Sovereign Funds, Utilities and Giga-Projects in Charging Expansion
- Charging Value Chain and Business Model Map
- Typical Project Structures, Contracts and Revenue Stacks

- Growth Drivers
EV targets, air-quality and decarbonisation objectives
Giga-project mobility designs
Fuel subsidy reforms
Localization incentives - Market Challenges
Grid reinforcement needs
Permitting timelines
Land access
Interoperability
Harsh-climate operations - Key Opportunities
Tourism corridors
Logistics electrification
Utility partnerships
Software and data services
Local manufacturing) - Emerging Trends
Ultra-fast hubs
Hub-and-spoke depot models
Solar-plus-storage
Smart and bi-directional charging - Regulatory, Technical and Safety Framework
- Tariff Structures and Charging
- Grid Integration and Network Planning
- Technology Roadmap and Innovation Spaces
- Installed Public and Semi-Public Charging Sites, 2019-2024
- Installed Connectors by Power Class (AC and DC), 2019-2024
- Connected Load and Annual Energy Throughput, 2019-2024
- Public vs Captive/Depot vs Destination Charging Contribution, 2019-2024
- Urban vs Inter-City Corridor and Giga-Project Charging Footprint, 2019-2024
- By Charger Power Rating (in Value %)
AC slow and basic destination chargers
AC high-power and workplace chargers
DC fast highway and urban hubs
DC ultra-fast corridor hubs and giga-project hubs
Megawatt and high-capacity fleet/depot chargers - By Connector and Communication Standard (in Value %)
CCS-type connectors
CHAdeMO and legacy standards
OEM-proprietary systems and high-power platforms
AC socketed vs tethered connectors
OCPP and smart-charging protocol adoption - By Location and Site Archetype (in Value %)
Highway and inter-city corridor fuel stations and rest areas
Urban retail, malls, hospitality and mixed-use parking
Office, commercial and industrial campuses
Residential complexes and community parking
Giga-project, tourism and special economic zone destinations - By Application and End-Use Case (in Value %)
Private passenger vehicles
Ride-hailing, taxis and chauffeur fleets
Corporate and government light-duty fleets
Logistics vans, last-mile and urban delivery fleets
Buses, shuttles and high-capacity transport fleets - By Ownership and Business Model (in Value %)
Utility-led and grid-company owned public charging
CPO-owned and operated public networks
OEM-captive and dealer-installed networks
Fleet/depot owner-operators and logistics hubs
Oil & gas retail, forecourts and hospitality-led networks - By Region and Corridor Cluster (in Value %)
Central cluster (capital region and hinterland)
Western cluster (pilgrim, tourism and coastal corridors)
Eastern cluster (industrial and export corridors)
Southern and high-altitude corridors
Giga-project and special-zone clusters
- Market Share of Major Players by Installed Public Connectors and Connected Load
Market Share of Major Players by DC Fast and Ultra-Fast Connectors
Market Share of Major Players by Highway vs Urban vs Giga-Project Sites - Cross Comparison Parameters (Installed public charging connectors in the kingdom, Installed DC fast and ultra-fast connectors and maximum power rating per site, Geographic and corridor coverage, Average uptime and field service coverage model, Interoperability, roaming partnerships and app ecosystem depth, Share of sites with on-site renewables or storage and peak-shaving capabilities, Smart-charging, load management and fleet/roaming platform capabilities, Localization footprint in equipment, assembly, software and operations)
- Detailed Profiles of Major Companies
EVIQ
Electromin
Saudi Electricity Company
Red Sea Global
NEOM Mobility
MOTEVS
CITA EV Charger
ABB E-Mobility
Siemens Smart Infrastructure
ChargePoint
Blink Charging
Tesla Supercharger Network
BP Pulse
XCharge
- Private EV Owners
- Ride-Hailing and Taxi Fleets
- Corporate and Government Fleets (centralized depots, duty cycles, procurement criteria, ESG alignment)
- Logistics and Last-Mile Delivery Fleets (route-based charging, turnaround time, load factor)
- Bus and Shuttle Operators (depot vs on-route charging, layover patterns, power needs)
- Installed Public and Semi-Public Charging Sites, 2025-2030
- Installed Connectors by Power Class (AC and DC), 2025-2030
- Connected Load and Annual Energy Throughput, 2025-2030
- Public vs Captive/Depot vs Destination Charging Contribution, 2025-2030
- Urban vs Inter-City Corridor and Giga-Project Charging Footprint, 2025-2030


 Request a Sample
 Ask for Customization
 Get a Quote
 Enquire Now