
 Download PDF
 Download PDF
Market Overview
The KSA EV charging infrastructure market is valued at USD ~ million, with recent analysis highlighting that roughly 285 public charging points are deployed nationwide and over 65% of these are slower AC units up to 22 kW. Within this base, DC fast chargers from initiatives such as EVIQ’s national rollout of 5,000 chargers across more than 1,000 locations are emerging as the growth engine. Vision-led diversification, rising EV model availability and strong sovereign-backed capex underpin the acceleration of fast-charging infrastructure.
Fast-charging deployment is currently concentrated in Northern & Central KSA, anchored by Riyadh, along with high-traffic corridors around Jeddah, Makkah and the Eastern Province. Northern & Central is the largest region for EV charging infrastructure, driven by higher urbanization, income levels and concentration of government and corporate hubs. Riyadh’s ambition for roughly one-third of new vehicles to be electric within the next decade, plus giga-projects such as NEOM and The Line, attracts early public, utility and CPO investment into fast-charging networks in these zones.
Market Segmentation
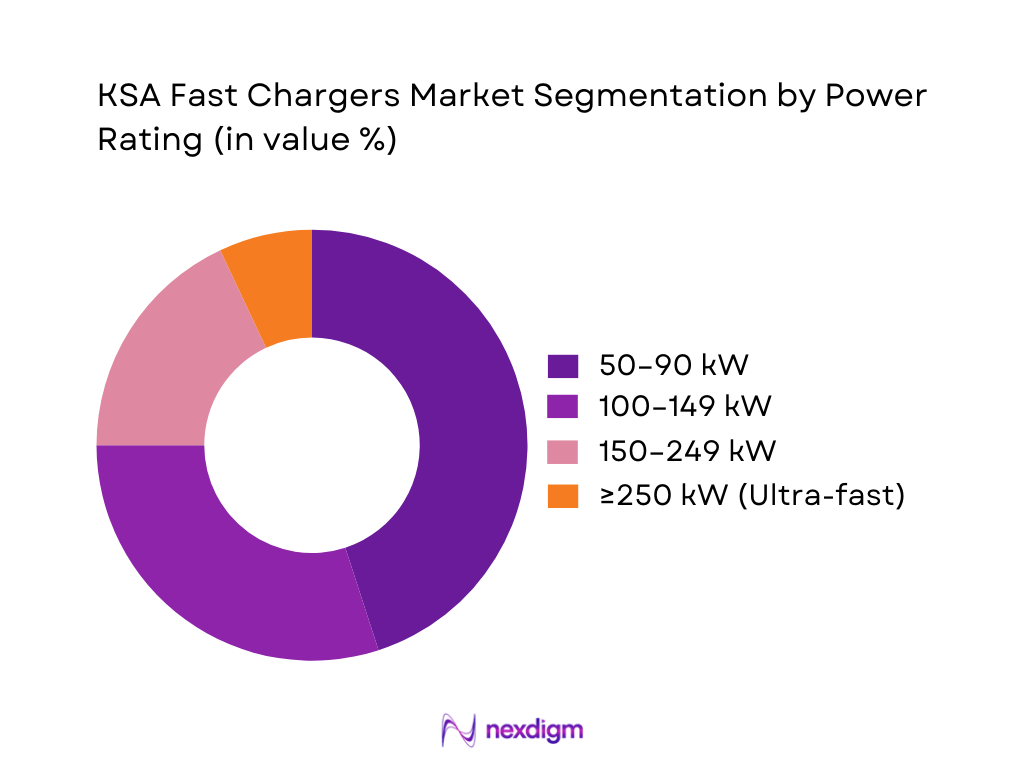
By Power Rating
The KSA fast chargers market is segmented by power rating into 50–90 kW, 100–149 kW, 150–249 kW and ≥250 kW ultra-fast systems. Today, 50–90 kW units hold the dominant share, as they balance capex, grid-connection requirements and compatibility with the current passenger-EV parc. Early deployments at malls, mixed-use developments and city car parks typically favor these ratings, which can be supported on existing distribution feeders with moderate upgrades. For CPOs and real estate owners, these chargers provide acceptable dwell-time for shopping or dining visits while avoiding expensive medium-voltage substations or advanced cooling systems needed for ≥250 kW ultra-fast units.
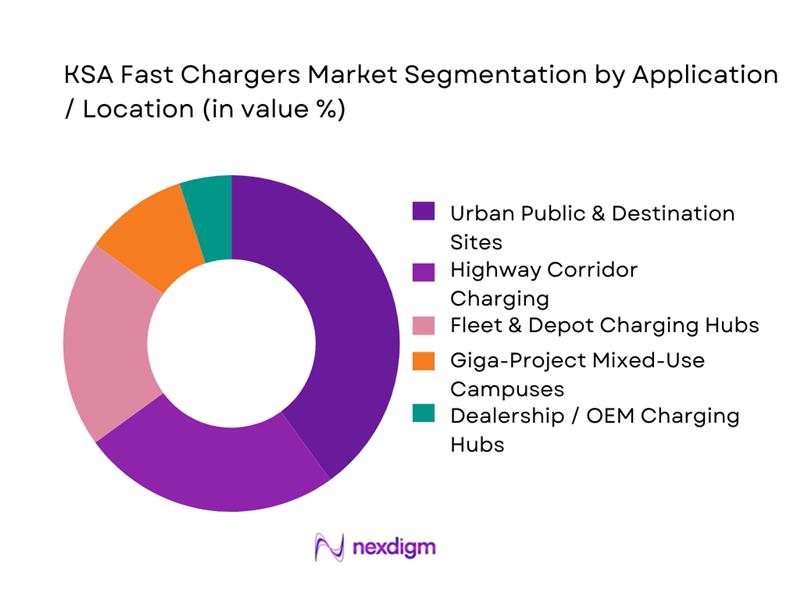
By Application / Location
The KSA fast chargers market is segmented by application into urban public & destination charging, highway corridor sites, fleet & depot hubs, giga-project mixed-use campuses and dealership / OEM hubs. Urban public & destination sites currently dominate, as fast chargers are co-located with high-footfall retail, hospitality and mixed-use developments in Riyadh, Jeddah and Dammam. CPOs and partners prioritize these locations to maximize utilization, cross-sell ancillary services and build brand visibility. For EV drivers, destination fast chargers reduce range anxiety and allow top-ups during shopping or dining, making them the most attractive early-stage use-case versus still-nascent long-haul EV traffic on intercity highways.
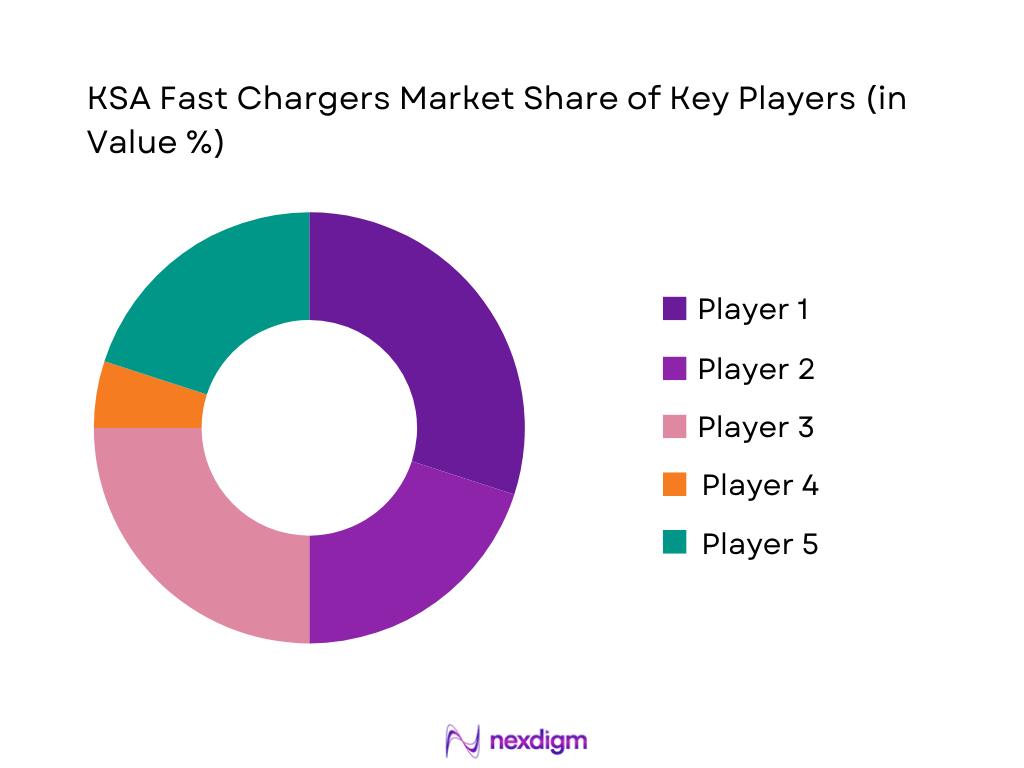
Competitive Landscape
The KSA fast chargers market is shaped by a tight mix of national platforms and global technology majors. A central role is played by EVIQ, the PIF–Saudi Electricity Company JV mandated to deploy thousands of chargers nationwide, alongside early CPO Electromin and infrastructure-driven player alfanar (alfaCharge). Global OEMs such as ABB and Siemens provide DC hardware, power modules and software, often through partnerships with local EPC firms. This consolidation around a handful of deep-capital players creates high barriers to entry and sets technical benchmarks for connector standards, uptime and smart-charging features.
| Player | Establishment Year | Headquarters | Role / Positioning in KSA Fast Charging | Typical DC Power Range (kW) | Dominant Connector Standards (KSA) | Primary Business Model | Key KSA Focus Regions | Giga-Project / Mega-Deal Involvement | Smart Charging & Digital Capabilities |
| EVIQ | 2023 | Riyadh, Saudi Arabia | ~ | ~ | ~ | ~ | ~ | ~ | ~ |
| Electromin | 2011 (group) | Jeddah, Saudi Arabia | ~ | ~ | ~ | ~ | ~ | ~ | ~ |
| alfanar (alfaCharge) | 1976 (group) | Riyadh, Saudi Arabia | ~ | ~ | ~ | ~ | ~ | ~ | ~ |
| ABB | 1988 (ABB Group) | Zürich, Switzerland | ~ | ~ | ~ | ~ | ~ | ~ | ~ |
| Siemens | 1847 | Munich, Germany | ~ | ~ | ~ | ~ | ~ | ~ | ~ |
KSA Fast Chargers Market Analysis
Growth Drivers
Vision 2030 electrification targets
Saudi Arabia’s Vision 2030 puts road transport decarbonisation at the centre of its diversification agenda, with a stated goal for 30% of all vehicles in Riyadh to be electric by 2030 and more than 5,000 public charging stations targeted nationwide to support this transition, The broader macro base is strong: the Kingdom’s GDP is around SAR ~ trillion in current prices and the number of registered, roadworthy vehicles exceeded ~ million units by end-2024, with over ~ million new vehicles registered that year. These policy targets plus a rapidly expanding vehicle base create structural pull for high-power DC fast-charging networks in dense urban corridors such as Riyadh, Makkah and the Eastern Province.
PIF-backed CPO expansion
The Public Investment Fund (PIF) is directly backing fast-charging rollout via EVIQ, which plans to deploy 5,000 fast chargers across more than 1,000 locations covering cities and intercity highways (PIF–EVIQ announcement). This sits on top of Saudi Electricity Company’s (SEC) national grid, which in 2024 comprised around 99,794 circuit-km of transmission lines, 1,260 transmission substations with 497,902 MVA of capacity, and 805,835 circuit-km of distribution lines feeding 697,068 distribution transformers rated at 378,624 MVA for ~ million electricity customers (SEC FY-2024 earnings release). The combination of a sovereign-backed CPO and a grid operator with nationwide reach creates a uniquely scalable environment for high-power DC corridors, underwritten by Vision 2030 capex rather than purely private balance sheets.
Market Challenges
Grid integration complexity
SEC’s latest figures show a heavily loaded but rapidly expanding grid: 99,794 circuit-km of transmission lines and 1,260 transmission substations with 497,902 MVA capacity feed an 805,835 circuit-km distribution network and 697,068 distribution transformers rated at 378,624 MVA, serving ~ million customers across the Kingdom (SEC FY-2024 earnings release). GASTAT reports that just three regions (Riyadh, Makkah and Eastern) account for over 70% of household electricity use, underscoring demand concentration. Integrating clusters of high-power DC fast chargers (often drawing 150–350 kW per connector) into urban feeders and highway substations amplifies peak loads and fault-level requirements. This raises the need for grid-friendly charging strategies, on-site storage and active coordination with SEC’s reinforcement plans to avoid local congestion and voltage issues.
Feeder capacity constraints
GASTAT and SPA data indicate that registered vehicles in operation climbed to more than ~ million by end-2024, up roughly 6.9% year-on-year, with over ~ million vehicles newly registered and road accident rates falling alongside improved infrastructure. The 2024 Road Transport Statistics also show road-freight exports of about ~ million tons and imports of over ~ million tons through land ports in a single year (GASTAT Road Transport 2024). These figures imply steadily rising utilisation of urban and intercity feeders already serving dense commercial corridors. When 150–350 kW highway chargers and multi-megawatt depot hubs are overlaid on the same feeders, distribution utilities must upgrade transformers, cables and protection settings, or risk local bottlenecks and curtailment of new fast-charging connections.
Market Opportunities
High-power corridors
Road-based trade and mobility dynamics strongly favour corridor-based fast-charging development. GASTAT’s 2024 Road Transport Statistics show road-freight exports through land ports of over 13.4 million tons and imports over 12.2 million tons in one year (GASTAT Road Transport 2024). Earlier bulletins indicate domestic road freight volumes around 209 million tons, while public buses already move 43.5 million passengers annually Meanwhile, land-border crossings handled over 65 million passengers in a single year, with registered vehicles in operation surpassing 15.8 million. These numbers underline the scale of Riyadh–Dammam, Riyadh–Mecca, Jeddah–Madina and Eastern-Province freight corridors. Overlaying 150–350 kW “refuelling-style” fast-charging hubs at logistics parks, rest areas and border crossings can monetise very high traffic densities, while leveraging existing SEC substations and truck-stop infrastructure.
Giga-project EV platforms
Saudi giga-projects are being conceived as showcase platforms for electric and autonomous mobility, creating concentrated demand for premium fast-charging. NEOM’s “THE LINE” concept alone is planned as a 170-km linear city designed to host up to 9 million residents with zero-car, fully electric transit. On the supply side, the government has agreed to purchase up to 100,000 EVs from Lucid over ten years, while Lucid’s AMP-2 plant at King Abdullah Economic City has an initial assembly capacity of 5,000 vehicles per year, scalable to 155,000 vehicles per year when fully built out. These current-day commitments, combined with tens of billions of dollars of public capital earmarked for NEOM and related zones, make high-power DC fast-charging an embedded requirement in new-build cities, logistics hubs and tourism destinations rather than a retrofit afterthought.
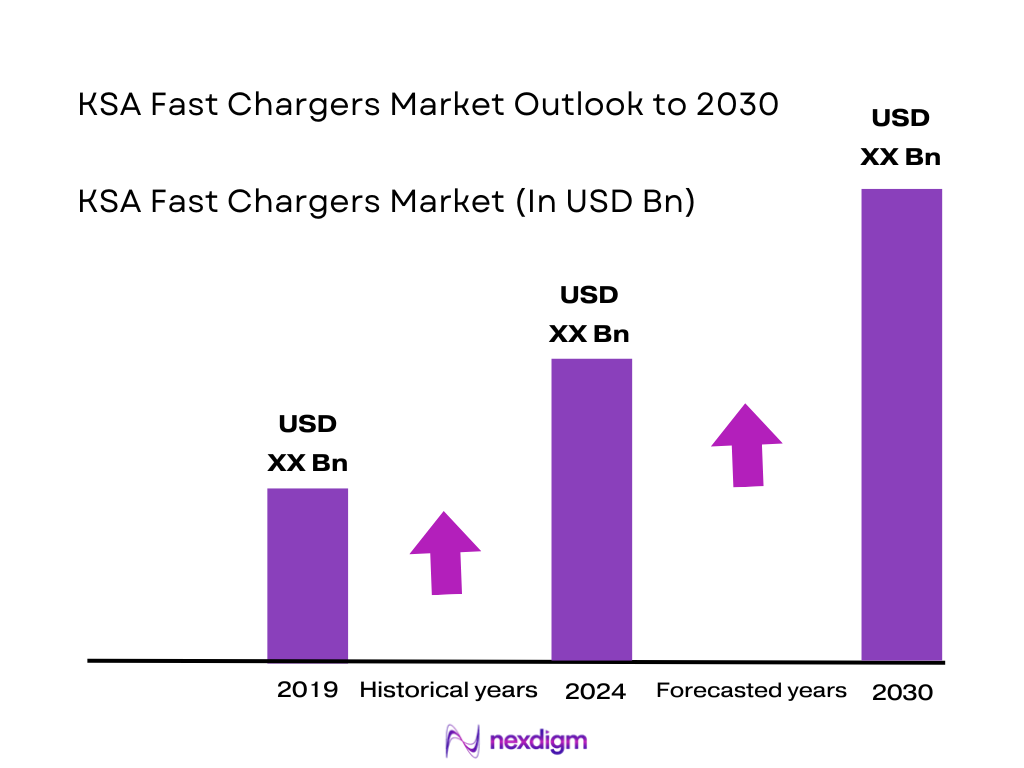
Future Outlook
Over the next several years, the KSA fast chargers market is expected to expand rapidly as EV adoption rises from a low single-digit share of new sales toward about one-third of new light-duty vehicles within the next decade, supported by ambitious national e-mobility strategies. The broader EV charging infrastructure market, value is expected to grow from USD ~ million in 2024 to USD ~ million by 2030, implying an annual growth rate of roughly 19.1%. Within this, the DC fast-charging slice should grow even faster as EVIQ’s 5,000-charger program, giga-project campuses, and high-power highway corridors come online, while ultra-fast ≥250 kW nodes emerge for premium passenger and fleet applications.
Major Players
- EVIQ
- Electromin
- alfanar
- ABB
- Siemens
- Schneider Electric
- Delta Electronics
- Wallbox
- Kempower
- Tritium
- Eaton
- Legrand
- Autel Energy
- Star Charge
Key Target Audience
- EV charge point operators (CPOs) and mobility service providers
- Utility and grid companies
- Real estate and infrastructure developers
- Automotive OEMs, importers and dealership networks
- Fleet and logistics operators
- Oil & gas and energy transition investment arms
- Investment and venture capitalist firms
- Government and regulatory bodies
Research Methodology
Step 1: Identification of Key Variables
The initial phase involves mapping the KSA fast chargers market ecosystem, covering charger OEMs, CPOs, utilities, real estate developers, fleet operators and regulators. This step relies on deep secondary research using industry databases, company disclosures, government policy documents and EV-focused outlooks from. The objective is to define critical variables like installed base, power-rating mix, utilization patterns, tariff structures and capex per site.
Step 2: Market Analysis and Construction
Next, we compile and analyze historical and current data on EV adoption, charging-point deployment, investment commitments and regulatory milestones. This includes reconciling figures for public charging points, investment in infrastructure and regional distribution to construct a bottom-up view by power rating and application. Where public data is limited (e.g., DC-only revenues), we triangulate using analogues from GCC markets, OEM disclosures and fleet-charging case studies, then stress-test against the top-down forecasts for the broader charging-infrastructure market.
Step 3: Hypothesis Validation and Expert Consultation
Market hypotheses on utilization, preferred locations, grid bottlenecks and payback periods are validated through targeted interviews (telephonic and virtual) with C-level leaders and technical experts from CPOs, utilities, EPC firms, automotive OEMs and large fleets in KSA. These discussions provide real-world insights on uptime, load profiles, capex/opex, concession models and regulatory pain points, helping refine quantitative assumptions and segment splits for fast-charger demand across corridors, cities and depots.
Step 4: Research Synthesis and Final Output
In the final phase, we synthesize all data into coherent market sizing, segmentation, competitive benchmarking and forward-looking scenarios. Fast-charger specific dynamics such as temperature-driven derating, connector-standard evolution, giga-project ramp-ups and fleet electrification timelines are explicitly modeled. Quantitative outputs (size, growth, segment shares) are cross-checked against published forecasts for EV charging infrastructure, while qualitative insights are summarized into strategic recommendations for investors, operators and policymakers in the KSA fast chargers market.
- Executive Summary
- Research Methodology (Market Definitions & Assumptions, Charger Power-Class Framework, Connector Standard Taxonomy, Research Design, Market Sizing Logic, Consolidated Top-Down & Bottom-Up Approach, Primary Interview Framework—Utilities/Operators/OEMs/Real Estate/Fleet Operators, Secondary Data Validation, Data Triangulation, Limitations & Sensitivity Scenarios)
- Definition and Scope
- Evolution of Fast-Charging Infrastructure in KSA
- Technology Evolution Timeline
- Business Cycle
- Supply Chain & Value Chain Structure

- Growth Drivers
Vision 2030 electrification targets
PIF-backed CPO expansion
Rising EV sales
Fleet electrification mandates
Public-transport charging requirements - Challenges
Grid integration complexity
Feeder capacity constraints
Heat management in harsh climate
Imported power modules
Interoperability gaps - Opportunities
High-power corridors
Giga-project EV platforms
Depot charging for buses/logistics
Demand-response charging
Solar + storage co-locations - Trends
Liquid-cooled ultra-fast systems
ISO 15118 Plug-and-Charge
Roaming interoperability
Software-driven load management
Multi-gun multi-standard chargers - Government Regulation
- SWOT Analysis
- Stake Ecosystem
- Porter’s Five Forces
- By Value, 2019-2024
- By Installed Units, 2019-2024
- By Energy Dispensed, 2019-2024
- By Power-Class Mix, 2019-2024
- By Power Rating (in Value %)
≤50 kW DC
60–90 kW DC
120–150 kW DC
180–300 kW DC
≥350 kW Ultra-Fast - By Connector Standard (in Value %)
CCS2
CHAdeMO
GB/T DC
Type-2 AC-enabled DC stacks
Megawatt Charging System-ready ports - By End Use (in Value %)
Public Urban Charging
Highway Corridor Charging
Fleet/Depot Charging
Retail & Hospitality Charging
OEM/Dealership Charging - By Charger Ownership Model (in Value %)
CPO-Owned
OEM-Owned
Utility-Owned
Fleet-Owned
Real Estate/Commercial-Owned - By Region (in Value %)
Riyadh
Eastern Province
Makkah & Jeddah Corridor
Madinah Region
NEOM & Western Giga-Project Belt
- Market Share of Major Players
Market Share by Charger Power Segment - Cross Comparison Parameters (Power-Module Efficiency, Thermal-Management System Capability (Air/Liquid Cooling), Interoperability & ISO 15118 Readiness, OCPP & Software Stack Maturity, Charger Uptime & Predictive Maintenance Capability, Multi-Gun Charger Flexibility, Localization & Assembly Presence, Fleet-Charging & Depot Solutions Offering)
- SWOT Analysis of Major Players
- Benchmarking of Pricing & TCO Parameters
- Detailed Profiles
Electromin
EVIQ
alfanar
ABB
Schneider Electric
Siemens
Delta Electronics
Wallbox
Kempower
Tritium
Eaton
Legrand
Autel Energy
Star Charge
- End-User Demand Profiles
- Operational Metrics
- Pain-Point Analysis
- Decision-Making Matrix
- Adoption Readiness
- By Value, 2025-2030
- By Installed Units, 2025-2030
- By Energy Dispensed, 2025-2030
- By Power-Class Mix, 2025-2030


 Request a Sample
 Ask for Customization
 Get a Quote
 Enquire Now