
 Download PDF
 Download PDF
Market Overview
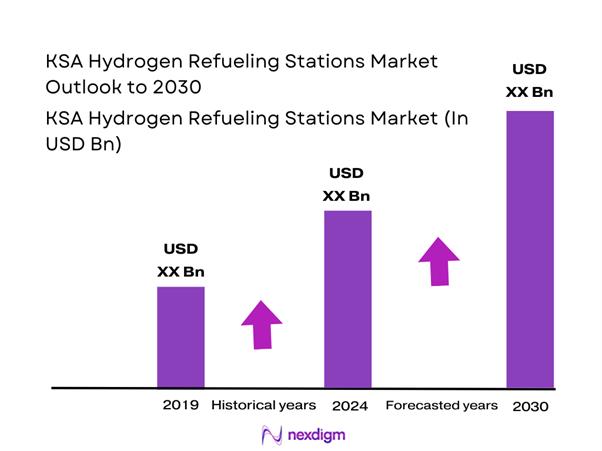
The KSA hydrogen fueling station market is valued at USD ~ million in 2024, up from USD ~ million, reflecting the early-stage nature of paid, safety-critical station deployments (compression, storage, dispensers, controls, and commissioning). Demand formation is being pulled by national-scale hydrogen production and mobility ecosystem buildouts, including mega-project funding and industrial gas integration that de-risks supply availability for mobility corridors and pilot fleets.
In KSA, early HRS activity is expected to cluster where fleet utilization is densest and permitting/safety governance is most structured—Riyadh, Jeddah, and the Eastern Province industrial corridor (Dammam/Jubail)—because stations need repeatable offtake, reliable utilities, and emergency response readiness. Globally, the ecosystem is led by China, South Korea, and Japan as their station networks scale fastest; worldwide stations rose from ~ to ~, supported by national programs and OEM fleet rollouts.
Market Segmentation
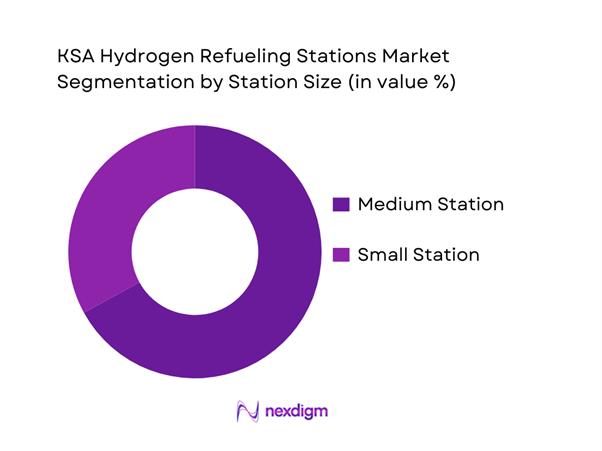
By Station Size
KSA hydrogen refueling stations are segmented by station size into Small Stations and Medium Stations. Medium Stations dominate because early deployments prioritize higher daily throughput and fewer sites with better utilization economics—especially for bus, municipal, airport, port, and logistics fleets where centralized refueling reduces downtime. Medium formats also justify higher-spec compression, cascade storage, redundancy, and safety systems, improving availability and compliance performance. In KSA’s early market, developers prefer building fewer, higher-capacity stations first (rather than many low-capacity points) to stabilize hydrogen logistics, O&M routines, and operator training.
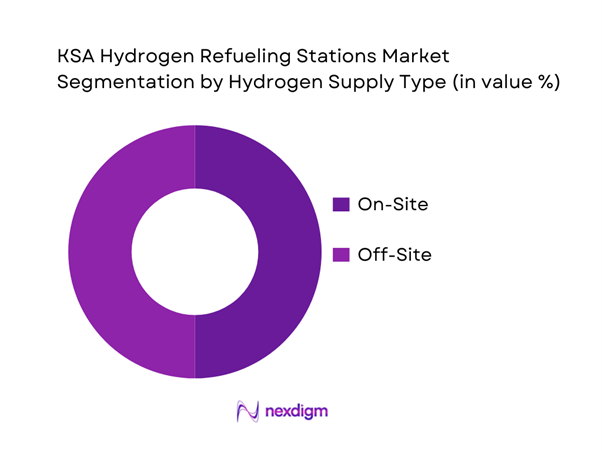
By Hydrogen Supply Type
The market is also segmented by hydrogen supply type into On-Site and Off-Site supply. In early-stage KSA deployments, On-Site is co-dominant because it simplifies supply assurance and can be aligned with local hydrogen production (electrolysis-linked pilots or industrial gas hubs), reducing dependence on trailer delivery scheduling and boil-off/handling constraints for certain logistics models. On-site configurations also help standardize purity control, dispensing consistency, and safety-case documentation—critical for regulators and fleet operators adopting hydrogen for the first time. However, Off-Site remains equally material where centralized production and distribution economics outperform at low station volumes.
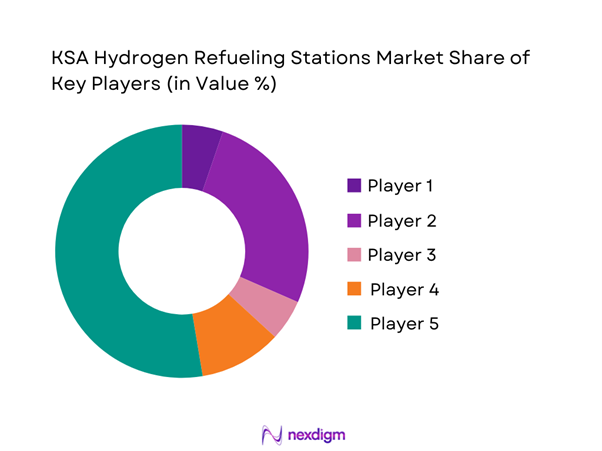
Competitive Landscape
The KSA hydrogen refueling station market is highly project-led and currently shaped by a small set of global industrial gas and hydrogen infrastructure OEMs that can deliver EPC + permitting support + safety engineering + O&M readiness. The competitive edge is defined less by hardware alone and more by end-to-end execution capability (HAZOP/SIL alignment, local partners, spares, uptime SLAs), and by access to hydrogen supply partnerships as KSA scales its broader hydrogen economy.
| Company | Est. Year | HQ | Primary HRS Role | KSA/MENA Delivery Model | Dispensing Capability Focus | Compression/Storage Stack | Controls & Safety Engineering | O&M / Service Readiness |
| Air Products | 1940 | USA | ~ | ~ | ~ | ~ | ~ | ~ |
| Air Liquide | 1902 | France | ~ | ~ | ~ | ~ | ~ | ~ |
| Linde | 1879 | UK/Germany | ~ | ~ | ~ | ~ | ~ | ~ |
| Nel | 1927 | Norway | ~ | ~ | ~ | ~ | ~ | ~ |
| ITM Power | 2001 | UK | ~ | ~ | ~ | ~ | ~ | ~ |
KSA Hydrogen Refueling Stations Market Analysis
Growth Drivers
National Hydrogen Scale-Up Programs
Saudi Arabia’s hydrogen refueling station (HRS) momentum is being “pulled” by the Kingdom’s hydrogen production scale-up and the macro capacity to fund complex infrastructure. The World Bank reports Saudi Arabia’s economy at USD ~ trillion and GDP per capita at USD ~ (current US$), which underpins public-capital programs and large industrial energy investments that typically precede downstream mobility infrastructure such as HRS. A key demand-forming catalyst is NEOM’s hydrogen ecosystem build, where the NEOM Green Hydrogen Project is designed around ~ GW of electrolysers powered by about ~ GW of solar and wind, with a stated design output of about ~ tonnes/day of green hydrogen (announced project configuration). In parallel, ENOWA (NEOM’s energy and water entity) has been operating a hydrogen ecosystem build-out that includes an electrolyzer-led hydrogen industrial development center; it references a first-stage ~ MW electrolyzer for operational learnings, which is important because early hydrogen production learning curves directly affect supply certainty for HRS commissioning and utilization ramp-up.
Giga-Project Mobility Requirements
KSA’s giga-projects are creating concentrated “closed-loop mobility systems” where hydrogen refueling can be deployed earlier than in open retail markets because fleet routing, depot refueling, and operations governance are centrally managed. This is visible in NEOM, where ENOWA and Hydrogen Refueling Solutions (HRS) have a project to supply a hydrogen station (HRS14) intended to refuel a planned fleet of ~ buses and light vehicles—a fleet scale that is large enough to justify hydrogen fueling operations, training, and maintenance routines, yet controlled enough to manage safety and uptime. The same ecosystem is also being reinforced by mobility trials: Hyundai notes the availability of a hydrogen refueling station in NEOM enabled operation of a fuel cell coach bus in a defined operating window ( to in the referenced period), which is important because it demonstrates how giga-project sites can operationalize hydrogen refueling within planned mobility “sandboxes.” On the macro side, KSA’s transport activity base is expanding: the national statistics authority reports registered vehicles in use reached ~ thousand at the end of 2024, up from ~ thousand, and vehicles registered as a new issue exceeded ~ thousand in2024—these volumes expand the addressable universe of fleets and public-sector mobility that giga-projects can tap into (including transit, logistics support vehicles, and municipal operations).
Challenges
Hydrogen Logistics and Distribution Complexity
Hydrogen logistics is one of the most binding constraints for HRS scaling in KSA because station reliability depends on consistent supply mode (on-site production vs delivered hydrogen), transport scheduling, and storage management under strict safety rules. Even in a strong macro context—World Bank shows KSA at USD ~ trillion GDP (current US$)—logistics friction can slow deployment when hydrogen must be moved to low-density demand points. On the ground, KSA’s freight flows underline how much physical movement the transport system already manages: official statistics report ~ million tons of road freight exports and ~ million tons of road freight imports through land ports in 2024, indicating intensive trucking activity and border processing—conditions that amplify planning complexity when adding hydrogen carriage equipment, hazardous material handling routines, or specialized distribution assets. In early-stage hydrogen mobility, a practical issue is that hydrogen demand is often “lumpy” (fleet-based, shift-based). The NEOM example illustrates this fleet-first reality: the planned mobility system referenced for hydrogen refueling includes ~ buses and light vehicles tied to a specific site and operator ecosystem.
Station Economics at Low Utilization
For KSA, a central HRS challenge is utilization: stations are capital-intensive assets whose operating viability improves only when daily refueling volumes are predictable. The current market signals show that hydrogen mobility is still in “fleet-pilot density” rather than broad retail density. In NEOM, the hydrogen station deployment described by the station supplier is designed to refuel a planned fleet of ~ buses and light vehicles, which is meaningful but still narrow in demand base when compared to mature markets where many fleets share a corridor network. The utilization issue becomes more visible when you look at the baseline scale of the vehicle fleet in KSA: official statistics report total registered vehicles in use of ~ thousand in 2024 versus ~ thousand in 2023, and “new issue” vehicles exceeding ~ thousand in 2024. Hydrogen vehicles represent only a very small fraction of this total vehicle base today, which means even well-designed HRS assets can face low initial throughput unless anchored to high-mileage fleets (transit buses, municipal vehicles, port equipment, captive logistics). The economics are also shaped by logistics-sector structure: logistics dashboards highlight freight transport volumes across modes including ~ million tons via maritime transport, ~ million tons by rail, and ~ million tons by air in the latest reporting context, showing that freight movement is multi-modal and distributed—hydrogen hubs must be placed carefully to capture sufficient daily demand.
Opportunities
Heavy-Duty Hydrogen Corridors
A high-conviction opportunity for KSA HRS growth is to build hydrogen corridors anchored to heavy-duty fleets that already operate in repeatable patterns: intercity coach routes, logistics shuttles between industrial zones, port drayage, and cross-border freight. Current transport activity supports this logic: official statistics report road freight exports through land ports of ~ million tons and imports of ~ million tons in 2024—these are precisely the kinds of freight flows where corridor hubs can consolidate demand if hydrogen truck pilots scale. On the passenger and fleet side, hydrogen bus activity is moving from concept to operation: Saudi Arabia’s official portal reported the trial of the first hydrogen-powered bus in the Kingdom, and Hyundai’s NEOM-linked mobility activity indicates hydrogen refueling capability can support real-world operations under demanding conditions. A corridor strategy becomes financially and operationally more viable when macro conditions can sustain infrastructure rollouts: World Bank lists KSA’s economy at USD ~ trillion with GDP per capita USD ~, enabling public-sector co-investment, PPP models, and fleet procurement support programs that de-risk early corridor utilization.
Captive Depot Rollouts
Captive depot rollouts are a near-term scaling pathway for KSA hydrogen refueling stations because they avoid the hardest early-stage barrier: uncertain retail demand. Instead, they lock in utilization via fleet return-to-base refueling—ideal for bus depots, municipal fleets, airport ground support fleets, and giga-project mobility systems. NEOM provides a clear proof pattern: the hydrogen station supplier describes a station designed to refuel a planned fleet of ~ buses and light vehicles, which is exactly the kind of controlled demand base needed to justify depot HRS O&M routines, staff training, and safety governance. This model becomes more compelling when you anchor it to the underlying expansion of the national vehicle parc: official statistics show registered vehicles in use reached ~ thousand in 2024 and new vehicle registrations exceeded ~ thousand—a broad growth base that increases the pool of potential captive fleets (public agencies, contractors, logistics operators) that can transition in phased procurement cycles. Depot rollouts also align with today’s logistics infrastructure density: national logistics releases report ~ licensed commercial warehouses and ~ construction warehouses with ~ square meters area—industrial zones and warehouse clusters often host captive fleets that can convert in concentrated blocks, enabling “one station, many vehicles” economics.
Future Outlook
Over the next five to six years, KSA’s hydrogen refueling station market is expected to expand from pilot-scale deployments to corridor-based networks anchored around fleet demand (transit buses, logistics, ports, airports, and municipal services). The strongest momentum will come from integrating hydrogen supply projects with mobility use-cases, tightening safety and interoperability requirements, and building a repeatable EPC-to-O&M playbook. Large-scale hydrogen investments and industrial gas partnerships are likely to accelerate bankable station rollouts and standardize station formats.
Major Players
- Air Products and Chemicals
- Air Liquide
- Linde
- Nel ASA
- ITM Power
- Cummins
- FuelCell Energy
- Ballard Power Systems
- TotalEnergies
- Plug Power
- McPhy Energy
- Hexagon Purus
- Chart Industries
- Emerson
Key Target Audience
- Investments and venture capitalist firms
- Government and regulatory bodies
- National and regional fleet operators
- Oil & gas and industrial gas companies
- EPC and infrastructure contractors
- Hydrogen equipment OEMs and integrators
- Logistics, port, and industrial zone operators
- Insurance, risk engineering, and certification stakeholders
Research Methodology
Step 1: Identification of Key Variables
We construct the KSA HRS ecosystem map covering hydrogen producers, industrial gas distributors, station EPCs, equipment OEMs, fleet adopters, and regulators. Desk research is used to define variables such as station typologies, safety requirements, hydrogen sourcing pathways, and deployment corridors, ensuring consistent market scoping.
Step 2: Market Analysis and Construction
We compile historical and current market signals including published market revenue points, project announcements, and infrastructure rollouts. The market is built by mapping station deployment economics to utilization-led demand centers, and validating the revenue construct against known station CAPEX/OPEX components.
Step 3: Hypothesis Validation and Expert Consultation
Hypotheses on segment dominance (size, supply type) and adoption sequencing (fleet-first vs retail-first) are validated via structured expert interviews across EPC firms, industrial gas players, fleet operators, and safety/standards professionals to test execution feasibility and procurement behavior.
Step 4: Research Synthesis and Final Output
We triangulate secondary market datasets with stakeholder inputs to finalize segmentation shares, competitive benchmarking, and forward drivers. Outputs are stress-tested for internal consistency across supply availability, permitting reality, and corridor-level adoption logic to produce a decision-ready market view.
- Executive Summary
- Research Methodology (Report Scope and Boundary Conditions, Market Definitions and Station Taxonomy, Abbreviations, Market Engineering Framework, Demand-Side Model Construction, Supply-Side Capacity Mapping, Primary Interview Program with OEMs, Gas Majors, EPCs, Fleet Operators and Regulators, Secondary Source Triangulation, Pricing and Cost Build-Up Logic, Scenario Design for Mobility Uptake and Hydrogen Supply, Data Validation and Sensitivity Checks, Limitations and Assumptions Register)
- Definition and Scope
- Market Genesis and Adoption Timeline
- Hydrogen Mobility Use-Case Map
- Station Ecosystem Snapshot
- Station Business Cycle
- KSA Hydrogen Infrastructure Positioning vs Vision Programs

- Growth Drivers
National Hydrogen Scale-Up Programs
Giga-Project Mobility Requirements
Heavy Transport Decarbonization Mandates - Challenges
Hydrogen Logistics and Distribution Complexity
Station Economics at Low Utilization
Safety, Permitting and Standards Alignment - Opportunities
Heavy-Duty Hydrogen Corridors
Captive Depot Rollouts
Port, Mining and Industrial Mobility - Trends
Containerized and Modular HRS Designs
Multi-Pressure Dispensing Architecture
Digital Station Management and Remote Monitoring - Regulatory & Policy Landscape
- SWOT Analysis
- Stakeholder & Ecosystem Analysis
- Porter’s Five Forces Analysis
- Competitive Intensity & Ecosystem Mapping
- By Value, 2019–2024
- Installed Base and Number of Stations, 2019–2024
- Service and Access Model Mix, 2019–2024
- By Fleet Type (in Value %)
Public Retail Stations
Semi-Public Fleet Hubs
Captive Fleet Depots
Port and Industrial Yard Stations
Pilot and Demonstration Stations - By Application (in Value %)
Heavy-Duty Road Transport
Public Transit Buses
Giga-Project Mobility Fleets
Port and Logistics Operations
Industrial and Mining Mobility - By Technology Architecture (in Value %)
On-Site Electrolysis Stations
Delivered Compressed Hydrogen Stations
Delivered Liquid Hydrogen Stations
Pipeline-Connected Stations
Hybrid Supply Architecture Stations - By Connectivity Type (in Value %)
350 bar Dispensing Stations
700 bar Dispensing Stations
Multi-Pressure Stations
Cryo-Compressed Ready Stations - By End-Use Industry (in Value %)
Transportation and Logistics
Municipal and Public Services
Construction and Giga Projects
Ports and Industrial Zones
Energy and Utilities - By Region (in Value %)
Central Region
Eastern Region
Western Region
Northern Region
Southern Region
- Market Share Snapshot of Major Players
- Cross Comparison Parameters (Dispensing pressure capability, Nameplate capacity, Peak fill rate, Compression technology, Storage architecture, Station uptime and availability SLA, Digital monitoring and SCADA stack, Safety and regulatory compliance readiness)
- SWOT Analysis of Major Players
- Pricing and Commercial Model Analysis
- Company Profiles
Air Products Qudra
ENOWA
Saudi Aramco
ACWA Power
NEOM Green Hydrogen Company
Air Liquide
Linde
Hydrogen Refueling Solutions
Nel Hydrogen
ITM Power
Cummins Hydrogenics
Chart Industries
Hexagon Purus
McPhy Energy
Hyzon Motors
- Fleet Segment Readiness Assessment
- Customer Procurement and Decision Process
- Adoption Drivers and Economics
- Operational Pain Points and Service Expectations
- Pricing Acceptance and Commercial Models
- By Value, 2025–2030
- Installed Base and Capacity, 2025–2030
- Service and Access Model Mix, 2025–2030


 Request a Sample
 Ask for Customization
 Get a Quote
 Enquire Now