
 Download PDF
 Download PDF
Market Overview
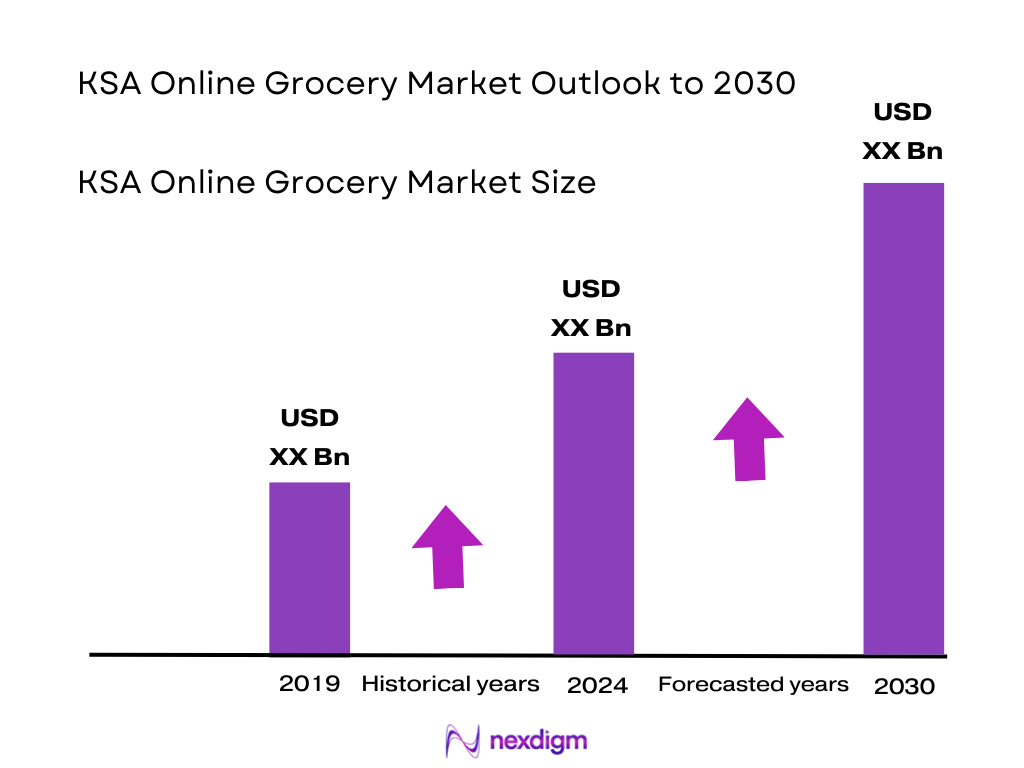
The KSA online grocery market is valued at USD 1,543.7 million. This valuation builds on multi-year data inputs and reflects actual transactional GMV across digital grocery platforms. The growth drivers behind this scale include surging smartphone ownership, near-universal internet access, consumers’ shift toward convenience-driven shopping behaviors, and massive investment in logistics and digital infrastructure supported by Vision 2030. Collectively, these factors have propelled the market from prior years into its current robust size.
The dominance of Riyadh, Jeddah, and Dammam in the online grocery landscape stems from their high urban density, concentration of dual-income households, superior digital infrastructure, and well-established retail networks. These cities also house the majority of e-commerce logistics hubs and benefit from faster adoption of contactless payments and delivery services, making them natural growth epicenters for online grocery platforms.
Market Segmentation
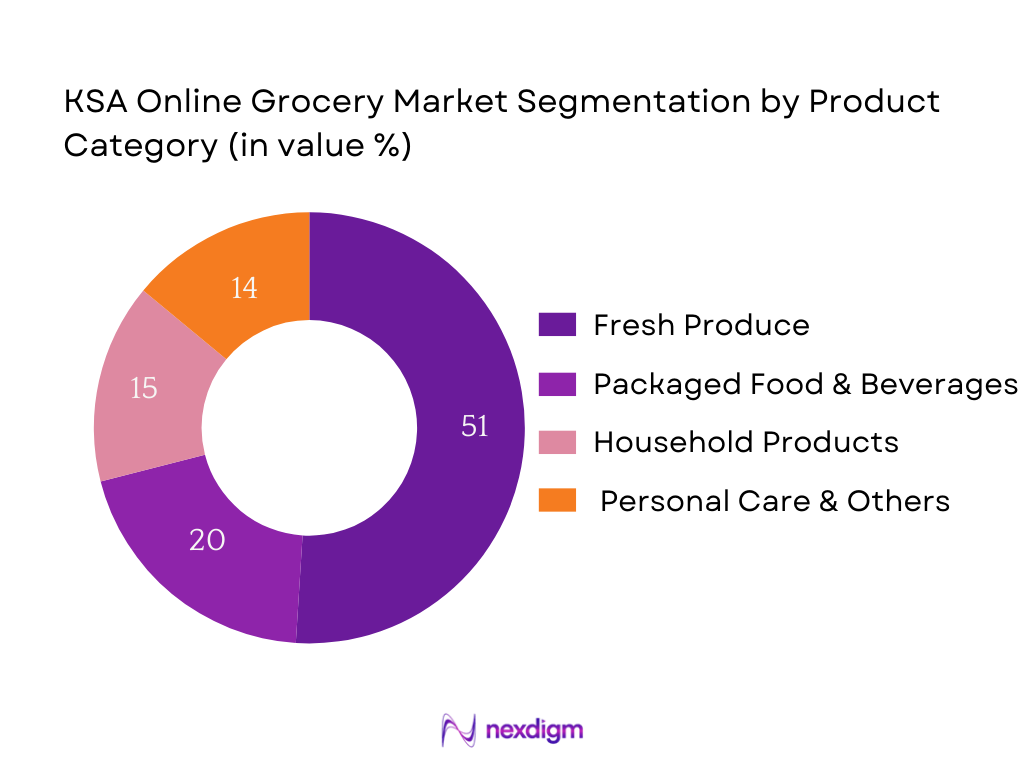
By Product Category
Fresh Produce commands the majority share due to deeply ingrained consumer demand for perishables, frequent purchase cycles, and strong retailer focus on delivering freshness via efficient cold-chain systems. Digital platforms emphasize high-quality fruits, vegetables, and dairy, aiming to replicate the in-store experience and capitalize on health-conscious trends. This has resulted in higher frequency and basket values for fresh categories.
By Delivery Model
Dark-store and Q‑commerce models dominate due to their ability to enable ultra-fast delivery (typically within 30 minutes), essential for urban, time-pressed consumers. These models benefit from centralized micro‑fulfilment centers, optimized picking systems, and localized last‑mile fleets, making them more efficient for high-frequency, small-basket orders. Retailers leveraging dark‑stores gain competitive advantage through reduced delivery times and improved perishables handling.

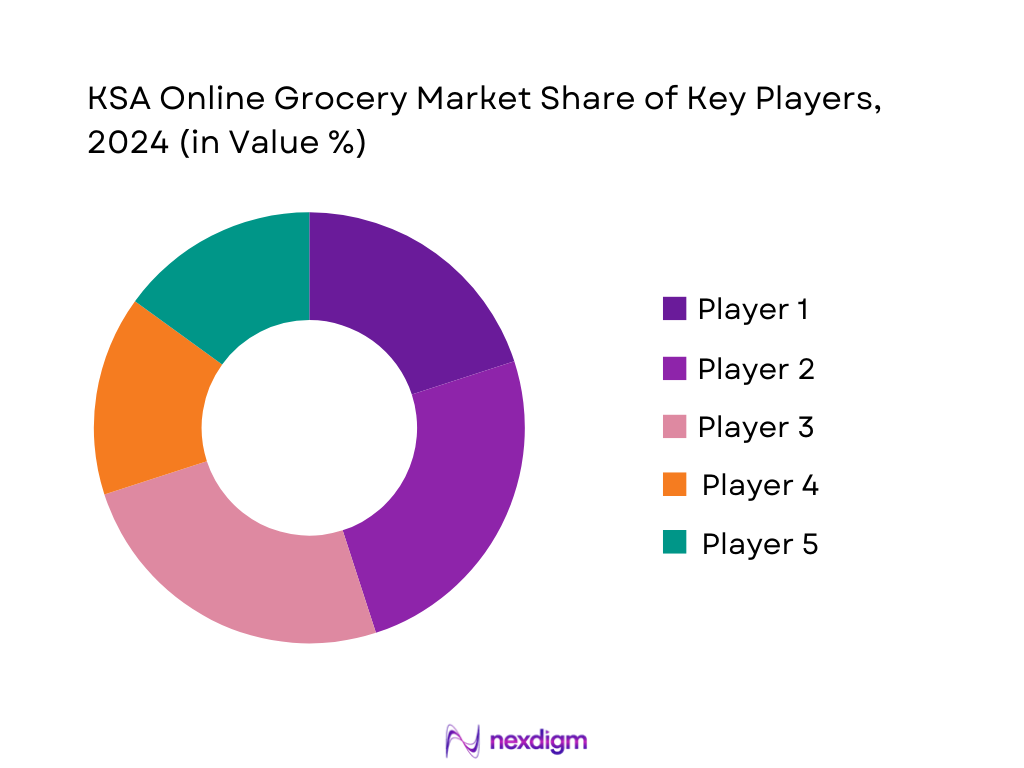
Competitive Landscape
The KSA online grocery market is dominated by a handful of major players, encompassing global giants and agile local platforms, highlighting a fragmented yet fiercely competitive landscape.
| Company | Establishment Year | Headquarters | Fulfilment Model | Delivery SLA | Private Label Range | Digital Payment Options | App MAU (est.) | Cold‑Chain Capability |
| Nana | 2019 | Riyadh, KSA | – | – | – | – | – | – |
| Danube Online (BinDawood) | 2017 | Jeddah, KSA | – | – | – | – | – | – |
| Carrefour KSA | — | Riyadh, KSA | – | – | – | – | – | – |
| Panda Online (Savola Group) | — | Riyadh, KSA | – | – | – | – | – | – |
| Tamimi Markets Online | — | Eastern Region, KSA | – | – | – | – | – | – |
KSA Online Grocery Market Analysis
Growth Drivers
Smartphone & Internet Penetration
The digital foundation bolstering the KSA online grocery market is strong. The number of mobile cellular subscriptions stands at approximately 150 subscriptions per 100 people, indicating many individuals maintain more than one active device connection. Additionally, about 100% of the population are Internet users, reflecting effectively universal connectivity across Saudi Arabia. These figures translate to widespread access to e‑commerce platforms: nearly every urban household can engage with online grocery apps via smartphones or web. This ubiquitous digital access ensures that the foundational infrastructure for online grocery shopping is in place, driving consistent user adoption and enabling market expansion based on convenience and reach.
High Urbanization
KSA’s urban population continues to expand, with total population reaching 35.3 million in 2024, up from prior years, concentrated heavily in Riyadh, Jeddah, and the Eastern Province. These cities harbor dense residential clusters and sophisticated digital/logistics infrastructure, enabling high-frequency demand and efficient last-mile fulfillment for online grocery. The country’s annual population growth rate stands at 4.6%, indicating rapid urban influx and housing development. High urban density not only generates a critical mass of customers but also makes it economically viable for platforms to deploy micro‑fulfillment centers and dark‑stores, ensuring delivery speed and reducing delivery distances—key enablers of market scalability and convenience-led adoption.
Market Challenges
High Last-Mile Costs
Logistics costs in densely urban and peri-urban areas can escalate: though macro data does not isolate delivery costs, the GDP per capita of USD 35,057.2 and rising household income imply growing expectations for premium logistics services—fast and reliable delivery. Nonetheless, actual urban congestion, licensing, and delivery zone complexity in cities impose higher operational costs on platforms, affecting margins. The necessity to maintain delivery fleets, refrigerated logistics, and flexible time slots in urban centers presents financial pressure on operators. Without disclosing prices, this macroeconomic backdrop underscores that delivering perishable goods quickly across sprawling cities remains cost intensive within a high-income environment.
Substitution & Stockouts
World Bank data shows 100% internet user penetration, meaning consumers easily switch between platforms when their preferred items are unavailable. High digital connectivity increases exposure to alternatives instantly, raising consumer sensitivity to stockouts or forced substitutions. In an environment where an item is missing on one platform, highly connected consumers are quick to search elsewhere, impacting brand loyalty and basket completion. Efficient inventory and substitution policies are essential to reduce churn, but the ease of switching via internet connectivity poses a fundamental challenge for operator retention. Despite advanced digital connectivity, cold-chain infrastructure in last-mile delivery remains less visible. KSA’s nearly universal internet usage does not equate to uniform cold logistics readiness. Urban and regional disparities in chilled/frozen fulfilment capacity limit the ability to serve remote or hot zones effectively. Platforms may struggle to guarantee freshness or maintain temperature integrity in certain areas, potentially damaging consumer trust. The lack of comprehensive cold-chain coverage, despite high economic capability (GDP per capita over USD 35,000), underscores a logistical gap that affects operational reliability for perishables delivery.
Market Opportunities
AI‑Powered Inventory & Routing
Saudi Arabia’s advanced digital backbone—100% internet penetration and high mobile subscription ratio (e.g., over 150 per 100 people) —provides an ideal platform for deploying AI-driven inventory forecasting and route optimization. Retailers and delivery providers can leverage real-time data to anticipate demand spikes, manage replenishment, and reduce route distances, thus improving fulfillment efficiency. For example, high-frequency order patterns enabled by strong digital access amplify the value of predictive stocking and optimized fleet routing. These AI tools can reduce delivery delays and shrinkage, offering competitive advantage in a digitally mature environment.
Cold Chain Infrastructure
While refrigerated logistics gaps exist, economic readiness points to opportunity: with GDP per capita of USD 35,057.2 and a robust digital payments network handling 613.9 billion SAR in transactions, investment capacity for cold-chain infrastructure is substantial. Stakeholders can deploy refrigerated micro-fulfillment nodes, insulated last-mile fleets, and temperature-monitoring technology tailored for high-demand corridors. The state and private sector platforms have financial viability to support cold-chain rollouts, enabling reliable delivery of perishables. This will elevate consumer trust and expand access to fresh goods, marking a tangible opportunity to differentiate service quality in a well-capitalized environment.
Future Outlook
Over the coming years, the KSA online grocery market is poised for accelerated expansion, fueled by ongoing digital infrastructure development, consumer appetite for convenience, and supportive national initiatives like Vision 2030. Innovation in cold‑chain technology, Q‑commerce deployment, integration of AI in inventory and demand forecasting, and elevated consumer loyalty schemes will further drive market maturity. Key opportunities include geographic expansion into Tier‑2/3 cities, private-label growth, and forging stronger cross-border supply partnerships.
Major Players
- Nana
- Danube Online (BinDawood)
- Carrefour KSA
- Panda Online (Savola Group)
- Tamimi Markets Online
- LuLu Hypermarket Online
- Abdullah Al Othaim Markets (Online)
- Farm Superstores (FarmGO)
- sa Grocery
- noon Grocery
- HungerStation Mart
- Jahez Grocery Partners
- Mrsool
- InstaShop
- HungerStation Mart
Key Target Audience
- Investments and venture capital firms
- Corporate strategy teams (retail groups, logistics firms)
- Government and regulatory bodies (Ministry of Commerce, CITC, SFDA)
- Retail chain expansion planners
- Digital payment service providers
- Logistics and cold‑chain infrastructure providers
- Real‑estate developers (for dark‑store sites)
- Consumer behavior & loyalty program managers
Research Methodology
Step 1: Identification of Key Variables
We begin with constructing a market ecosystem map, mapping stakeholders such as grocers, logistics partners, digital payments, and regulators. This is supported by secondary sources and Vision 2030 policy documents, to define variables like GMV, delivery models, and digital adoption.
Step 2: Market Analysis and Construction
This phase assembles historical GMV figures, growth trends, and order-level metrics from verified sources. Platform-specific metrics, cold-chain adoption, and fulfilment models are analyzed to build an accurate baseline.
Step 3: Hypothesis Validation and Expert Consultation
We validate model outputs through interviews with industry practitioners—including platform heads, logistics managers, and payment integrators—via structured discussions that affirm assumptions and fine-tune the data.
Step 4: Research Synthesis and Final Output
We finalize the report by comparing our bottom‑up estimates with top‑down projections, ensuring alignment with official digital economy goals. The result is a rigorously verified analysis of the KSA online grocery landscape.
- Executive Summary
- Research Methodology (Market Definitions and Scope; Online Grocery vs. Meal Delivery Categorization; Sizing Approach—GMV, Volume, AOV; Triangulation through Primary Interviews, Retailer Apps, Appstore Reviews, POS Integrations; Macro-Micro Data Modeling; Limitations and Assumptions)
- Definition and Market Scope
- Market Genesis and Digital Evolution
- Online Grocery Business Cycle (Order Origination to Fulfilment)
- Supply Chain & Value Chain Mapping (Importers → Retail DCs → Store MFCs → CEP Players → End-User)
- Operating Models: Omni-Channel, Aggregator, Q-Commerce, Dark Store
- Regulatory Framework (SFDA, SASO, PDPL, VAT, ZATCA E-Invoice)

- Growth Drivers (Smartphone & Internet Penetration; High Urbanization; Digital Wallet Adoption; Loyalty & Subscription Models; Investments in MFCs; BNPL Enablement; Rise in Dual-Income Families; National Retail Digitization Initiatives)
- Market Challenges (High Last-Mile Costs; Substitution & Stockouts; Chilled/Frozen Fulfilment Gaps; Platform Commission War; OOS & Expiry-Related Waste; Low Margins in Fresh Categories)
- Market Opportunities (AI-Powered Inventory & Routing; Cold Chain Infrastructure; Category Expansion into Gourmet/Organic/Imported; Private Labels; Micro-Wholesaling to Horeca)
- Market Trends (Private Label Penetration; Ramadan Bulk Buying Spikes; Shift Towards Health & Wellness Groceries; Multi-Platform Price Comparisons)
- Regulatory & Compliance (SFDA Safety Compliance; Halal Labeling Norms; Data Privacy—PDPL; ZATCA e-Invoicing & VAT; Last-Mile Fleet Licensing)
- SWOT Analysis
- Porter’s Five Forces Analysis
- Stakeholder Ecosystem (Retailers, Aggregators, 3PLs, Payments, Tech Partners)
- Consumer Behavior Mapping (Loyalty Triggers, Delivery Tolerance, Substitution Acceptance)
- By GMV (Gross Merchandise Value), 2019-2024
- By Volume (No. of Orders), 2019-2024
- By AOV (Average Order Value in SAR), 2019-2024
- By Basket Size (Units per Order), 2019-2024
- By Daily Active Orders (Fulfilled Orders/Day), 2019-2024
- By Fulfilment Model (In Value %)
Store-Pick
MFC
Dark Stores
Aggregators
Click & Collect - By Product Category (In Value %)
Fresh Produce
Staples
Beverages
Meat & Poultry
Dairy & Eggs
Personal Care
Bakery
Baby Care
Pet Care - By Temperature Chain (In Value %)
Ambient
Chilled
Frozen
Mixed - By Basket Mission (In Value %)
Top-Up
Weekly Basket
Monthly Stock-Up
Emergency Need - By Delivery SLA (In Value %)
Instant (10-30 min)
Same-Day
Next-Day
Scheduled Delivery - By Payment Method (In Value %)
Mada
Apple Pay
Credit/Debit Cards
BNPL
Cash on Delivery - By Platform Type (In Value %)
Retailer App/Web
Aggregator App
Super-App - By Order Origination (In Value %)
Mobile App
Mobile Web
Desktop Web - By Customer Cohort (In Value %)
Saudi Nationals
Expatriates
Family Size
Diet Preferences
Gender-Based Usage - By Region (In Value %)
Central
Western
Eastern
Southern
Northern
- Market Share by GMV and Orders
- Cross Comparison Parameters (Dark Store Count, SKU Depth, SLA Compliance, Order-to-Delivery Time, Private Label Share, Substitution Rate, Cold Chain Reliability, Active MAU, Order Frequency, Payments Mix, Average Order Value, Regional Penetration, Assortment Customization, Promo Redemption Rate, Customer Retention Index)
- SWOT Analysis of Major Players
- Pricing & Promotions Benchmarking (Item-Level Price Mapping, Coupon Penetration, Ramadan Promotions, Wallet Cashback Offers)
- Detailed Profiles of Major Players
Nana
Danube Online (BinDawood)
BinDawood Online
Carrefour KSA (MAF Retail)
Panda Retail Company (Savola Group)
Tamimi Markets
LuLu Hypermarket KSA
Abdullah Al Othaim Markets
Farm Superstores (FarmGO)
Amazon.sa (Pantry)
noon Grocery
HungerStation Mart
Jahez Mart
Mrsool
InstaShop
- User Intent (Routine Shopping vs. Emergency Order vs. Top-up)
- Order Frequency & Basket Evolution (Top-Up vs. Stock-Up)
- Device Usage Behavior (App vs. Web vs. Aggregator Browsing)
- Payment Preferences (Digital Wallet vs. BNPL vs. Cash)
- Delivery Time Preferences (Evening vs. Morning, Weekend vs. Weekday)
- Influencers of Retention (Substitution Policy, Loyalty Points, CX Score)
- By GMV, 2025-2030
- By Volume (Orders), 2025-2030
- By AOV, 2025-2030
- By Product Mix (Fresh vs Non-Perishables), 2025-2030


 Request a Sample
 Ask for Customization
 Get a Quote
 Enquire Now