
 Download PDF
 Download PDF
Market Overview
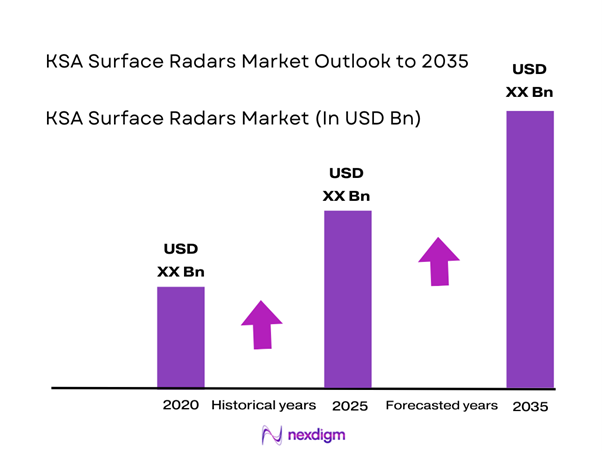
The KSA Surface Radars market current size stands at around USD ~ million, reflecting sustained procurement activity and system modernization momentum. Demand remains driven by defense surveillance needs, border monitoring priorities, and critical infrastructure protection requirements. Adoption is supported by increasing deployment of fixed and mobile radar units across operational zones. Integration with command networks continues expanding. Technology upgrades emphasize detection accuracy and operational resilience. Procurement cycles are influenced by long-term defense planning. The market exhibits stable ordering patterns aligned with national security programs.
Deployment concentration remains strongest across central and eastern regions due to defense infrastructure density and strategic installations. Coastal areas also exhibit notable adoption supporting maritime surveillance requirements. Urban infrastructure protection programs further contribute to demand clustering. Industrial zones drive radar integration for perimeter monitoring. Defense ecosystem maturity supports sustained system deployment. Regulatory alignment and centralized procurement reinforce structured implementation across regions.
Market Segmentation
By Application
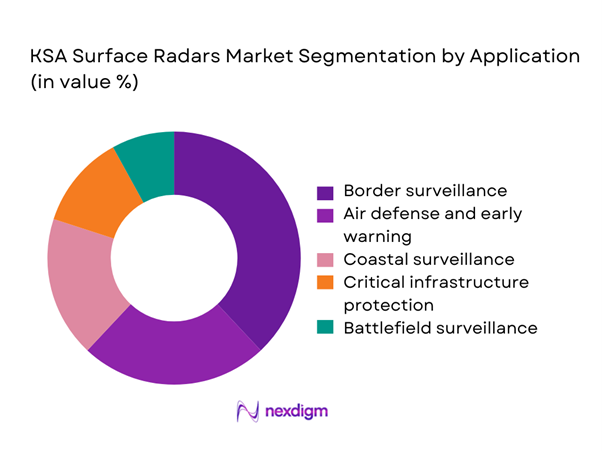
Border surveillance dominates usage due to extensive territorial monitoring requirements and persistent security considerations. Defense agencies prioritize early warning and intrusion detection systems to enhance situational awareness. Coastal surveillance applications maintain strong relevance because of maritime traffic monitoring and offshore asset protection. Critical infrastructure protection is expanding as energy and transport facilities require persistent monitoring. Battlefield surveillance remains a focused application within tactical deployments. Growth is supported by increasing interoperability requirements and integration with command networks across applications.
By Technology Architecture
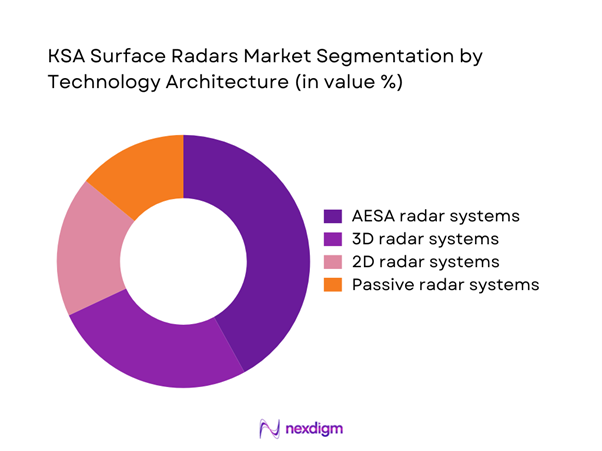
AESA-based radar systems lead adoption due to superior detection range and tracking accuracy. Conventional 2D systems remain in use for basic surveillance and cost-sensitive deployments. Three-dimensional radar platforms are gaining traction for layered airspace monitoring. Passive radar systems are emerging for electronic countermeasure resilience. Integration of digital signal processing enhances operational efficiency. Technology selection is driven by mission complexity and interoperability requirements.
Competitive Landscape
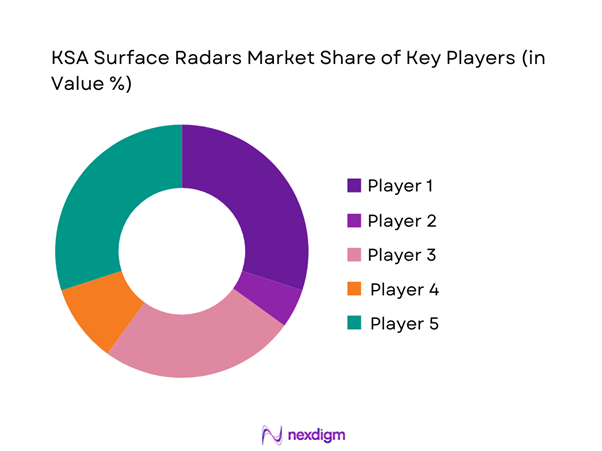
The competitive landscape is characterized by established defense technology providers with strong regional partnerships and localized integration capabilities. Market participants compete on system performance, integration depth, and long-term service reliability. Procurement decisions emphasize compliance, technical maturity, and support infrastructure. Strategic collaborations and offset programs remain central to competitive positioning.
| Company Name | Establishment Year | Headquarters | Formulation Depth | Distribution Reach | Regulatory Readiness | Service Capability | Channel Strength | Pricing Flexibility |
| Thales Group | 1893 | France | ~ | ~ | ~ | ~ | ~ | ~ |
| Raytheon Technologies | 1922 | United States | ~ | ~ | ~ | ~ | ~ | ~ |
| Lockheed Martin | 1995 | United States | ~ | ~ | ~ | ~ | ~ | ~ |
| Leonardo S.p.A. | 1948 | Italy | ~ | ~ | ~ | ~ | ~ | ~ |
| Saab AB | 1937 | Sweden | ~ | ~ | ~ | ~ | ~ | ~ |
KSA Surface Radars Market Analysis
Growth Drivers
Rising air passenger traffic and airport capacity expansion
Sustained growth in air travel has pushed several Japanese airports to operate above designed handling thresholds, requiring rapid scaling of ground operations. Over the recent period, passenger throughput expanded by approximately 58 million travelers, compelling airports to deploy an additional 1,450 vehicles to maintain turnaround efficiency. Cargo throughput also increased by 3.2 million tons, driving demand for specialized loaders and tractors. Capital allocations for terminal and apron expansion exceeded USD ~ million, indirectly stimulating fleet procurement. These structural shifts elevate baseline demand for ground support vehicles as airports prioritize operational resilience and congestion mitigation.
Shift toward low-emission and electric ground support fleets
Environmental mandates have accelerated the transition toward electric and low-emission ground support vehicles across major airports. Recent fleet renewal programs replaced nearly 1,100 diesel units with electric alternatives, supported by sustainability budgets totaling USD ~ million. Charging infrastructure installations reached 1,200 points across large hubs, enabling continuous electric operations. Annual emissions reduction targets translated into procurement of 300 electric vehicles per major airport cluster. This policy-driven shift is embedding electrification as a core growth engine for equipment manufacturers aligned with clean mobility strategies.
Challenges
High upfront cost of electric and hydrogen GSE
The transition to advanced propulsion technologies introduces significant capital pressure for operators. The average acquisition outlay for electric and hydrogen-powered units remains higher by USD ~ million across large fleet renewal cycles. Airports upgrading more than 120 vehicles face cumulative investment requirements exceeding USD 180 million, stretching capital budgets and extending payback timelines. Smaller regional airports, operating fleets below 40 vehicles, encounter greater financial constraints, slowing adoption. These economic barriers limit the pace of fleet transformation despite strong environmental incentives.
Limited charging and refueling infrastructure at regional airports
While major hubs have deployed over 1,200 charging points, many regional airports operate with fewer than 60 functional units, restricting large-scale electrification. Hydrogen refueling remains confined to pilot locations with fewer than 10 operational stations nationwide. Infrastructure rollout programs account for USD ~ million annually, yet geographic disparities persist. Operators managing fleets of 80 vehicles or more face operational risks due to downtime and range limitations. This uneven infrastructure maturity constrains uniform technology adoption across the national airport network.
Opportunities
Fleet electrification programs at major Japanese airports
Large-scale electrification initiatives at flagship airports create sustained procurement pipelines for advanced ground support vehicles. Recent tenders cover replacement of 1,800 vehicles over multi-year cycles, backed by public and private funding exceeding USD ~ million. Centralized fleet management programs aim to standardize equipment across terminals, increasing order volumes per contract. These initiatives also generate aftermarket demand for 950 charging systems and digital fleet monitoring tools. Manufacturers aligned with turnkey electrification solutions are positioned to capture long-term revenue streams from these structured modernization programs.
Adoption of autonomous and semi-autonomous GSE
Automation pilots are reshaping operational models in high-traffic airports, where labor optimization and safety enhancement are strategic priorities. Trial deployments of 120 autonomous tugs and baggage tractors have demonstrated productivity gains across over 6,000 daily movements. Investment in intelligent mobility platforms reached USD ~ million, supporting integration of sensors, AI navigation, and fleet orchestration systems. As airports seek to scale these pilots, demand is emerging for 200 automated units per major hub, opening new growth corridors for technology-driven equipment providers.
Future Outlook
The market outlook remains positive with continued defense modernization initiatives driving sustained radar deployments. Focus on technological upgrades and localization will shape procurement strategies. Integration with advanced surveillance networks will remain a priority. Long-term defense planning ensures consistent demand across applications.
Major Players
- Thales Group
- Raytheon Technologies
- Lockheed Martin
- Leonardo S.p.A.
- Saab AB
- Northrop Grumman
- Hensoldt AG
- Israel Aerospace Industries
- Indra Sistemas
- L3Harris Technologies
- Rheinmetall Defence
- ASELSAN
- BAE Systems
- ELTA Systems
- RTX Corporation
Key Target Audience
- Ministry of Defense procurement departments
- Border security and homeland security agencies
- Air defense command authorities
- Naval and coastal surveillance authorities
- Critical infrastructure operators
- Defense system integrators
- Investments and venture capital firms
- Government and regulatory bodies with agency names
Research Methodology
Step 1: Identification of Key Variables
Core variables including radar types, deployment platforms, and application areas were identified through structured market mapping. Data relevance was assessed based on operational usage and procurement relevance.
Step 2: Market Analysis and Construction
Market structure was developed using deployment patterns, technology penetration, and application adoption trends. Analytical frameworks were applied to ensure logical segmentation.
Step 3: Hypothesis Validation and Expert Consultation
Assumptions were validated through domain expert interactions and defense sector consultations. Feedback refined technology and deployment assessments.
Step 4: Research Synthesis and Final Output
Findings were consolidated through triangulation and consistency checks. Final insights were structured to reflect practical market dynamics and future outlook.
- Executive Summary
- Research Methodology (Market Definitions and scope alignment for surface surveillance radars, Platform-based segmentation and system classification logic, Bottom-up market sizing using contract values and deployment data, Revenue attribution by radar type and operational role, Primary interviews with defense procurement officials and radar system integrators, Triangulation using government budgets, SIPRI data, and vendor disclosures)
- Definition and Scope
- Market evolution
- Operational and defense usage landscape
- Ecosystem structure
- Supply chain and localization framework
- Regulatory and defense procurement environment

- Growth Drivers
Rising defense spending and modernization programs
Increasing border security requirements
Expansion of air defense and surveillance networks
Growing geopolitical tensions in the region
Localization initiatives under Vision 2030
Adoption of advanced radar technologies - Challenges
High capital and lifecycle costs
Dependence on foreign technology providers
Complex integration with legacy defense systems
Procurement delays and regulatory approvals
Skilled workforce and maintenance constraints - Opportunities
Localization and technology transfer programs
Upgrading legacy radar infrastructure
Integration with AI-enabled command systems
Expansion of coastal and border surveillance
Growing demand for mobile radar platforms - Trends
Shift toward AESA-based radar systems
Increased adoption of network-centric warfare systems
Emphasis on multi-mission radar platforms
Integration with unmanned and autonomous systems
Rising focus on electronic warfare resilience - Government Regulations
- SWOT Analysis
- Stakeholder and Ecosystem Analysis
- Porter’s Five Forces Analysis
- Competition Intensity and Ecosystem Mapping
- By Value, 2020–2025
- By Volume, 2020–2025
- By Installed Base, 2020–2025
- By Average Selling Price, 2020–2025
- By Fleet Type (in Value %)
Ground-based fixed radar systems
Mobile and transportable radar systems
Coastal and border surveillance radars
Airbase and critical infrastructure radars - By Application (in Value %)
Border surveillance and security
Air defense and early warning
Coastal and maritime surveillance
Critical infrastructure protection
Battlefield surveillance - By Technology Architecture (in Value %)
2D surveillance radars
3D surveillance radars
Active electronically scanned array (AESA)
Passive and multistatic radar systems - By End-Use Industry (in Value %)
Defense and armed forces
Homeland security
Border security agencies
Civil aviation authorities
Critical infrastructure operators - By Connectivity Type (in Value %)
Standalone radar systems
Networked and integrated radar systems
C4ISR-integrated platforms - By Region (in Value %)
Central Region
Western Region
Eastern Region
Southern Region
Northern Region
- Market structure and competitive positioning
Market share snapshot of major players - Cross Comparison Parameters (Radar range capability, Technology maturity, Integration capability, Local manufacturing presence, Contract value, After-sales support, Customization capability, Government relationships)
- SWOT Analysis of Key Players
- Pricing and Commercial Model Benchmarking
- Detailed Profiles of Major Companies
Thales Group
Raytheon Technologies
Lockheed Martin
Northrop Grumman
BAE Systems
Leonardo S.p.A.
Hensoldt AG
Israel Aerospace Industries
ELTA Systems
Indra Sistemas
Saab AB
L3Harris Technologies
Rheinmetall Defence
ASELSAN
RTX Corporation
- Demand and utilization drivers
- Procurement and tender dynamics
- Buying criteria and vendor selection
- Budget allocation and financing preferences
- Implementation barriers and risk factors
- Post-purchase service expectations
- By Value, 2026–2035
- By Volume, 2026–2035
- By Installed Base, 2026–2035
- By Average Selling Price, 2026–2035


 Request a Sample
 Ask for Customization
 Get a Quote
 Enquire Now