
 Download PDF
 Download PDF
Market Overview
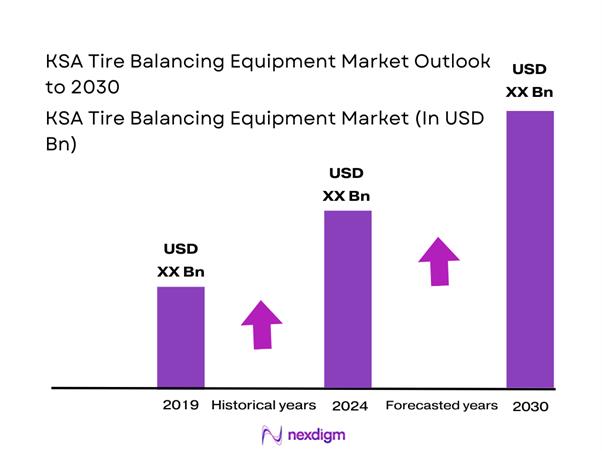
The KSA Tire Balancing Equipment Market is supported by a replacement-led tire ecosystem and workshop modernization, where uptime and turnaround time are critical KPIs. Saudi Arabia wheel balancer sales revenue is reported at USD ~ million (earlier historical point) and USD ~ million (next-point forecast), with a stated long-run CAGR of ~ in the same source series. Using that revenue trajectory, the market is implied at ~USD ~ million in the prior year and ~USD ~ million in the latest year.
Demand concentration is highest in Riyadh, Jeddah, and Dammam/Al Khobar, driven by the densest clusters of dealer networks, fleet maintenance bases, and high-throughput tire service centers. Dominant supplying countries for installed equipment and new procurement in KSA typically include Italy and Germany (premium workshop equipment ecosystems and calibration-grade systems) and China (value-led platforms and fast availability through distributor channels), while local dominance is shaped by who controls after-sales coverage, spare-part lead times, and technician training in these major city clusters.
Market Segmentation
By Product Type
KSA Tire Balancing Equipment Market is segmented by product type into manual entry balancers, semi-automatic balancers, fully automatic balancers, and road-force / advanced diagnostic balancers. Fully automatic systems dominate because high-volume tire shops and dealer workshops prioritize cycle time reduction, repeatable accuracy, and lower rework rates (comebacks). These models typically bundle automated wheel dimension capture, guided weight placement, and enhanced imbalance diagnostics—features that directly improve bay productivity and reduce technician dependency. In KSA, where workshop labor models often rely on mixed-skill teams, automation also standardizes output across shifts, which matters for multi-branch tire chains and dealer groups that track SOP compliance and customer satisfaction.

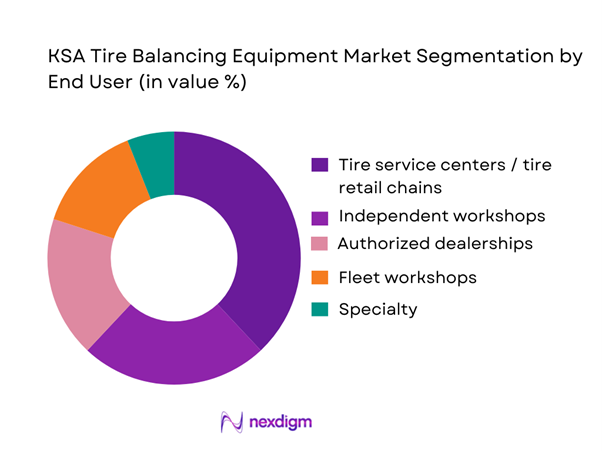
By End User
KSA Tire Balancing Equipment Market is segmented by end user into tire service centers, independent workshops, authorized dealerships, fleet workshops, and specialty/off-road & motorsport workshops. Tire service centers lead because they are the most balancing-intensive environments—balancing is bundled with tire changes, repairs, rotations, and alignment upsell workflows. Large tire retailers and multi-branch service networks also tend to refresh equipment on planned cycles to protect throughput and brand promise (fast service, fewer vibrations/returns). In addition, fleet accounts increasingly demand service SLAs and predictable downtime, which pushes tire service centers to maintain higher-capability balancers and keep backup units or faster service-response contracts—reinforcing this segment’s equipment purchasing power.
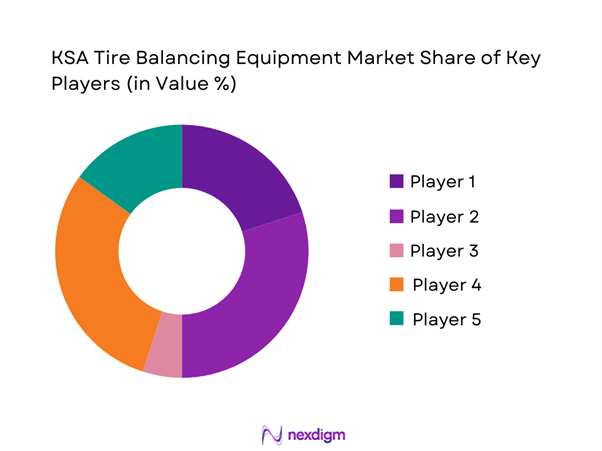
Competitive Landscape
The KSA Tire Balancing Equipment Market is moderately consolidated at the premium end (dealer groups and high-throughput tire chains) and more fragmented in the value segment (independent workshops), with competition centered on accuracy at speed, calibration stability, heavy-wheel capability, software guidance, and local after-sales reach. Procurement decisions are strongly influenced by distributor capability in KSA—especially installation, operator training, warranty turnaround time, and spare-part availability—rather than hardware alone.
| Company | Est. year | HQ | Core balancer portfolio strength | Heavy wheel capability (LCV/HCV) | Automation level | KSA channel model | After-sales coverage depth | Typical buyer fit |
| Hunter Engineering | 1946 | USA | ~ | ~ | ~ | ~ | ~ | ~ |
| Snap-on (Hofmann / John Bean portfolios) | 1920 | USA | ~ | ~ | ~ | ~ | ~ | ~ |
| Ravaglioli | 1958 | Italy | ~ | ~ | ~ | ~ | ~ | ~ |
| Corghi (Nexion Group) | 1954 | Italy | ~ | ~ | ~ | ~ | ~ | ~ |
| Bosch Automotive Aftermarket | 1886 | Germany | ~ | ~ | ~ | ~ | ~ | ~ |
KSA Tire Balancing Equipment Market Analysis
Growth Drivers
SUV-heavy fitment mix
Saudi Arabia’s vehicle parc is now large enough that even small shifts in fitment complexity translate into meaningful workshop throughput pressure. Registered and roadworthy vehicles reached ~ million at the end of the latest year, up from ~ million a year earlier, while vehicles registered as a new issue exceeded ~—a major flow of newer fitments into service bays that typically demand tighter balance quality (wider wheels, heavier assemblies, more sensitive NVH expectations). At the macro level, the economy’s scale supports sustained vehicle usage, indicating strong purchasing power and ongoing mobility demand that keeps tire replacement and wheel-service volumes elevated. In practical workshop terms, a larger active parc means more balancing events driven by tire changes, puncture repairs, rotations, and alignment jobs. This is amplified by licensing dynamics—first-time driving licenses exceeded ~, concentrated most heavily in Riyadh, followed by Makkah and the Eastern Region, which aligns with where multi-branch tire retail and dealership service networks are densest and where balancer utilization is structurally higher.
Larger rims and low-profile tires
Wheel balancing intensity rises when the operating fleet becomes newer and more performance-oriented, because lower-profile tires and larger wheel packages are less forgiving of small imbalance and road-force variation—showing up faster as customer complaints and “comeback” jobs. Saudi Arabia added over ~ newly registered vehicles in the latest year, expanding the pool of newer vehicles that generally carry modern wheel/tire packages and stricter ride-comfort expectations. In parallel, the installed base climbed to ~ million registered and roadworthy vehicles, creating a scale effect: even if only a fraction of annual service tickets require rebalancing, the absolute count of balancing cycles becomes large enough that bay productivity and repeatability (and therefore equipment capability) matter materially to workshop P&Ls and SLA adherence. Macro conditions reinforce this, with levels consistent with sustained demand for newer vehicle models, higher annual mileage for personal mobility, and premiumization of after-sales expectations in top cities. Inflation averaged ~ in the same period, helping keep consumer operating costs relatively stable and supporting continued vehicle use and service demand.
Challenges
Technician skill gap
Wheel balancing quality depends on operator behavior (centering method, wheel data entry, weight placement, verification run discipline) as much as the machine—so skill gaps translate directly into comebacks, rework, and customer dissatisfaction. Labor-market data indicates why this is a persistent operational challenge, with the Saudi unemployment rate at ~ and the Saudi employment-to-population ratio at ~—a context where workshops frequently rely on mixed-experience teams and face ongoing churn and rotation, making consistent skill levels hard to maintain across branches and shifts. Meanwhile, service demand keeps rising, with registered and roadworthy vehicles reaching ~ million and vehicles registered as a new issue exceeding ~, meaning more tire jobs are flowing into bays, often with newer vehicles where customers are less tolerant of vibration. Macro conditions support strong service volumes, aligning with high mobility and sustained vehicle usage that keeps workshop workloads elevated. With high bay utilization, even small technician errors compound into measurable downtime.
Calibration discipline
Calibration discipline is a structural challenge in high-throughput environments: machines drift, adapters wear, and repeatability declines—showing up as “balanced but still vibrating” outcomes that trigger rework. In Saudi Arabia, the scaling of road mobility increases the number of balancing cycles per machine, with registered and roadworthy vehicles reaching ~ million and newly registered vehicles exceeding ~, raising service volumes across tire retailers, dealer workshops, and independents. High utilization elevates the need for consistent preventive maintenance and periodic calibration, yet operational realities (queue pressure, technician turnover, spare-part lead times) often push calibration down the priority list until problems become visible through comebacks. Macro stability can paradoxically intensify this, supporting steady consumer demand and higher expectations—meaning workshops cannot hide calibration drift behind lower service volumes or lower customer sensitivity. Road safety indicators also raise the stakes for vehicle condition and workshop credibility, reinforcing the importance of disciplined service practices across the ecosystem.
Opportunities
Road-force or runout diagnostics attach
A major growth opportunity is the attach of advanced diagnostics (road-force, runout, wheel condition checks) alongside standard dynamic balancing, because these tools help workshops reduce repeat visits by identifying non-balance causes of vibration such as tire uniformity issues, bent wheels, and mounting problems. The KSA operating environment supports this, with serious traffic accidents exceeding ~, injuries exceeding ~, and fatalities exceeding ~—conditions that increase the operational importance of vehicle condition and heighten consumer and fleet sensitivity to stability, ride quality, and preventive maintenance outcomes. The market’s scale also supports upsell economics, with ~ million registered and roadworthy vehicles and more than ~ new registrations creating a large pool of vehicles where owners expect fix-it-right solutions after tire changes or vibration complaints. Macro context strengthens the willingness to pay for quality diagnostics, aligning with a customer base that increasingly values a definitive diagnosis over repeated balancing attempts, particularly in Riyadh, Jeddah, and the Eastern Region where service competition is strongest.
Touchless measurement upgrades
Touchless wheel measurement (automatic dimension capture without manual data entry) is a strong opportunity because it directly addresses two KSA realities: high service volumes and mixed technician skill levels. Saudi Arabia recorded over ~ new vehicle registrations and maintained ~ million registered and roadworthy vehicles, numbers that translate into sustained tire-service demand and daily queues in major city clusters. In that context, shaving seconds off each wheel through faster measurement and fewer input errors scales into meaningful throughput gains for multi-bay tire centers. Licensing dynamics reinforce volume growth, with first-time driving licenses exceeding ~ and high concentration in Riyadh, followed by Makkah and the Eastern Region, aligning with the densest networks of organized tire retail and dealership service centers where standardization investments are most common. Macro stability supports continued workshop investment cycles, creating a setting where service businesses can prioritize productivity and customer experience improvements rather than operating only in survival mode.
Future Outlook
Over the next five years, the KSA Tire Balancing Equipment Market is expected to grow steadily as workshops invest in higher-bay productivity, service standardization across branches, and automation to reduce dependency on technician skill variance. Fleet growth, last-mile logistics intensity, and continued expansion of organized tire service formats are likely to increase demand for fast-cycle, repeatable, calibration-stable wheel balancers. Based on Saudi Arabia’s wheel balancer revenue trajectory and long-run CAGR reported in a leading syndicated series, growth momentum remains favorable for advanced and fully automatic systems.
Major Players
- Hunter Engineering
- Snap-on
- Ravaglioli
- Corghi
- CEMB
- Sicam
- Hofmann
- John Bean
- Beissbarth
- HPA
- Launch Tech
- TECO
- Nussbaum
- SICE
Key Target Audience
- Head of After-Sales / Service Operations
- Head of Procurement
- Owners/General Managers
- Fleet Maintenance Directors
- Operations Heads
- Investments and venture capitalist firms
- Government and regulatory bodies
- Strategic sourcing leads
Research Methodology
Step 1: Identification of Key Variables
We build the KSA wheel-service ecosystem map (dealers, tire chains, independents, fleets, distributors, calibration and service providers) using structured secondary research and internal databases. The objective is to define the core demand variables—installed base of balancing bays, replacement cycles, and workshop throughput drivers.
Step 2: Market Analysis and Construction
We construct historical demand by triangulating workshop count by tier, balancing bay penetration, and typical equipment ASP bands by capability class. The model also accounts for procurement patterns (new installs versus replacements) and service-contract attachment that influences equipment refresh timing.
Step 3: Hypothesis Validation and Expert Consultation
We validate assumptions through CATIs with workshop owners, service directors at dealer groups, tire-chain operations managers, and local distributors and technicians. These interviews confirm real-world utilization rates, feature preferences (automation versus value), and after-sales pain points that shape brand choice.
Step 4: Research Synthesis and Final Output
We reconcile bottom-up build with distributor shipment signals, channel pricing checks, and procurement case evidence from major buyers. Final outputs include segment shares, competitive benchmarking, and a KSA-specific “what wins” playbook tied to channel execution and workshop economics.
- Executive Summary
- Research Methodology (Market definition & inclusion/exclusion for wheel balancers and balancing-adjacent kits, product taxonomy, unit-of-analysis, sizing framework, bottom-up demand build, top-down triangulation, primary interviews mix, pricing capture, validation, assumptions & abbreviations, limitations and sensitivity checks)
- Definition and Scope
- Market Genesis and Evolution
- Service-Bay Ecosystem Map
- Business Cycle and Buying Motions
- Supply Chain and Value Chain
- Product Architecture Primer

- Growth Drivers
SUV-heavy fitment mix
Larger rims and low-profile tires
Fleet uptime focus
Workshop classification and quality uplift
Customer comfort expectations and NVH reduction - Challenges
Technician skill gap
Calibration discipline
Accessories availability
Downtime cost
Price pressure from value imports - Opportunities
Road-force or runout diagnostics attach
Touchless measurement upgrades
Multi-branch standardization
Fleet depot professionalization
Service-contract monetization - Trends
Touchless measurement
Faster cycle-time software
Centerless clamping adoption
Digital job tracking
Training-as-a-service - Regulatory & Policy Landscape
- SWOT Analysis
- Stakeholder & Ecosystem Analysis
- Porter’s Five Forces Analysis
- Competitive Intensity & Ecosystem Mapping
- By Value, 2019–2024
- By Units Shipped, 2019–2024
- Installed Base and Active Bays, 2019–2024
- By Average Selling Price, 2019–2024
- Service and After-Sales Revenue Mix, 2019–2024
- By Technology Architecture (in Value %)
Entry digital
Videographic or laser-assisted
Touchless wheel measurement
Road-force or runout-capable
On-car balancers - By End-Use Industry (in Value %)
Passenger cars
SUVs
Light commercial vehicles
Heavy trucks and buses
Motorcycles and ATVs - By Technology Architecture (in Value %)
Maximum rim diameter handling
Maximum wheel width handling
Maximum wheel weight handling
Specialty oversized wheel readiness - By Technology Architecture (in Value %)
Cone-centric
Flange plate
Collet or quick-nut
Lug-centric adapters
Centerless clamping - By Technology Architecture (in Value %)
Manual data entry
Semi-automatic gauge arms
Automatic distance or diameter capture
Fully touchless measurement
Automatic weight-positioning guidance - By End-Use Industry (in Value %)
OEM dealerships
Tire retail chains
Independent garages
Fleet workshops
Body and paint plus mechanical hybrids - By Application (in Value %)
Authorized distributors
Multi-brand garage-equipment suppliers
Direct key-account supply
E-commerce or marketplace-led
Rental or lease with service bundles - By Application (in Value %)
Value or entry
Mid-market
Premium or OE-aligned - By Region (in Value %)
Central
Western
Eastern
Northern
Southern
- Market Share of Major Players
Go-to-Market and Channel Mapping - Cross Comparison Parameters (Vehicle-coverage breadth, Rim or wheel capacity headroom, Balancing accuracy and repeatability, Cycle time and throughput tools, Measurement method, road-force, Centering or clamping ecosystem and adapter availability, Connectivity or software and job-traceability features, KSA after-sales strength, spare parts, response SLA)
- Pricing Analysis
- Competitive Differentiation Levers
- Detailed Profiles of Major Companies
Hunter Engineering
MAHLE
Snap-on Equipment
Snap-on Equipment
Nexion Group
Nexion Group
CEMB
FASEP
Giuliano Automotive
SICE
Sicam
Butler Engineering
Mondolfo Ferro
Coats
- Demand and Utilization
- Purchasing Power and Budget Allocation
- Needs, Desires, and Pain Points
- Decision-Making Process
- Brand and Model Selection Criteria
- By Value, 2025–2030
- By Units Shipped, 2025–2030
- Installed Base and Active Bays, 2025–2030
- By Average Selling Price, 2025–2030
- Service and After-Sales Revenue Mix, 2025–2030


 Request a Sample
 Ask for Customization
 Get a Quote
 Enquire Now