
 Download PDF
 Download PDF
Market Overview
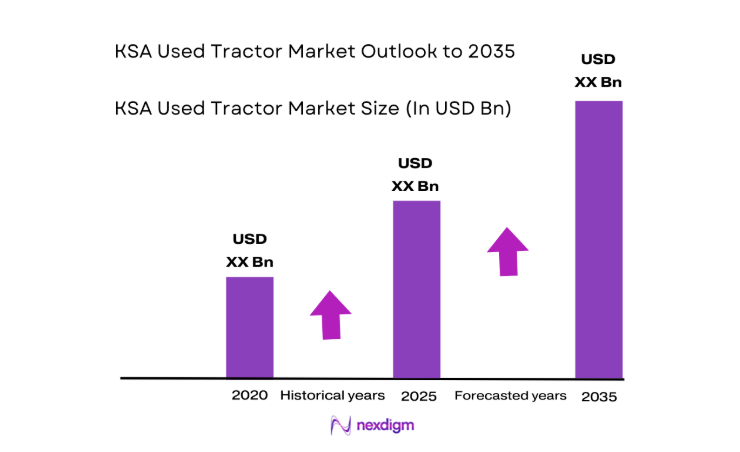
The KSA Used Tractor market current size stands at around USD ~ million, reflecting steady activity across agricultural, landscaping, and contractor-led demand channels. Transaction liquidity is supported by organized dealer networks and informal owner-to-owner exchanges, with refurbishing practices improving equipment usability cycles. Financing access through local banks and dealer-backed plans supports replacement decisions, while maintenance ecosystems sustain asset life extension. Import pathways for pre-owned machinery continue to influence availability across horsepower bands and drivetrain configurations nationwide.
Demand concentration is strongest around Riyadh, Qassim, Eastern Province, and Jazan, where irrigated farming clusters, greenhouse operations, and mixed-crop estates create sustained utilization. Logistics corridors connecting port-adjacent cities to inland farming belts improve equipment circulation. Dealer density and workshop availability reinforce ecosystem maturity, while policy emphasis on food security and water-efficient cultivation steers mechanization choices. Regional procurement practices favor accessible service coverage, reliable spare parts distribution, and rapid turnaround for seasonal field preparation and harvesting windows.
Market Segmentation
By Horsepower Range
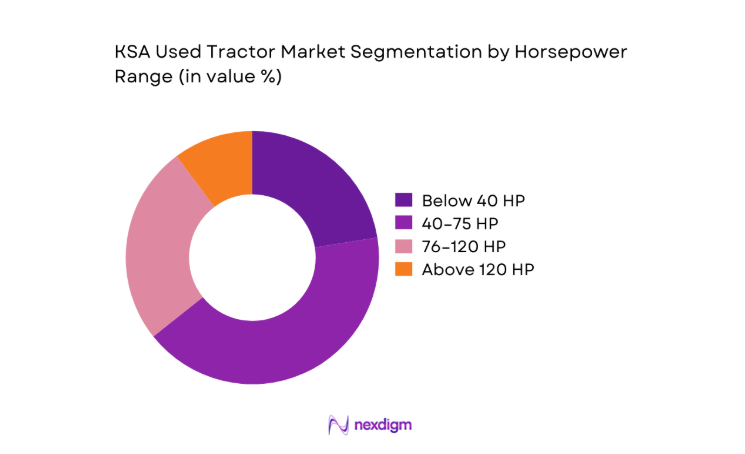
Demand concentrates in mid-range configurations due to versatility across row crops, greenhouse operations, and mixed-use contracting. Tractors between 40 and 75 HP balance fuel efficiency, implement compatibility, and maneuverability within fragmented plots common to peri-urban farms. Higher horsepower finds uptake in large estates and infrastructure-linked land development, while compact units remain preferred for horticulture and orchard work. Dealer refurbishment pipelines prioritize mid-range units because parts availability is broader and reconditioning cycles are predictable. Financing terms and resale liquidity further reinforce dominance of this segment, as buyers seek equipment that can transition across tasks through multi-implement utilization over extended seasons.
By Sales Channel
Authorized dealer resale dominates due to trust in inspection protocols, warranty options, and bundled service coverage. Independent dealers play a strong role in secondary cities, offering flexible pricing and localized support. Online marketplaces and auctions are growing, driven by improved logistics integration and price discovery, yet buyers still value physical inspection for older assets. Direct owner-to-owner transactions persist in rural clusters where community networks reduce search friction. Channel preference is shaped by access to spare parts, financing facilitation, and turnaround time for peak agricultural windows, which collectively favor structured dealer-led transactions over informal exchanges.

Competitive Landscape
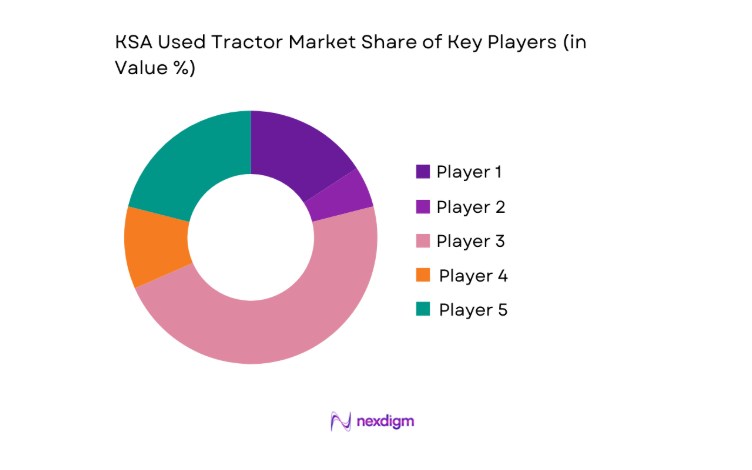
The competitive environment is shaped by authorized heavy equipment distributors with used equipment divisions, alongside regional dealers and diversified machinery traders. Differentiation centers on refurbishment depth, warranty coverage, spare parts availability, and service responsiveness across key agricultural belts.
| Company Name | Establishment Year | Headquarters | Formulation Depth | Distribution Reach | Regulatory Readiness | Service Capability | Channel Strength | Pricing Flexibility |
| Al-Bahar Heavy Equipment | 1937 | Dubai | ~ | ~ | ~ | ~ | ~ | ~ |
| Zahid Tractor | 1967 | Jeddah | ~ | ~ | ~ | ~ | ~ | ~ |
| Abdul Latif Jameel Machinery | 1945 | Jeddah | ~ | ~ | ~ | ~ | ~ | ~ |
| Kanoo Machinery | 1890 | Manama | ~ | ~ | ~ | ~ | ~ | ~ |
| Tamimi Commercial | 1953 | Dammam | ~ | ~ | ~ | ~ | ~ | ~ |
KSA Used Tractor Market Analysis
Growth Drivers
Mechanization needs driven by farm labor shortages
Agricultural labor participation has tightened due to urban migration patterns recorded in 2022 and 2023, while mechanization coverage expanded across irrigated clusters. Licensed farm operators increased mechanized field preparation days from 180 to 215 in 2024, supporting consistent utilization of tractors for plowing, seeding, and haulage. Public programs promoting water-efficient cultivation expanded controlled-environment acreage by 34 in 2025 across priority zones, increasing equipment deployment intensity. Equipment uptime targets of 290 operating days per year pushed buyers toward reliable refurbished assets. Vocational training throughput rose to 420 technicians in 2024, improving maintenance capacity and sustaining mechanization adoption in remote districts.
Expansion of greenhouse and commercial farming projects
Controlled-environment agriculture projects approved during 2023 and 2024 expanded operational footprints across peri-urban belts, increasing demand for compact and mid-range tractors for material handling and cultivation logistics. Project permits issued by agricultural authorities reached 612 in 2024, up from 487 in 2022, while drip-irrigated plots expanded by 1,840 hectares in 2025. Input distribution depots increased to 96 nodes nationwide, improving access to implements compatible with used tractors. Energy-efficient greenhouse complexes recorded 24-hour operational cycles during peak seasons, raising equipment utilization frequency and accelerating replacement cycles among operators prioritizing reliable secondary assets.
Challenges
Limited availability of certified quality-assured used tractors
Formal certification coverage for used agricultural machinery remains constrained, with only 14 accredited inspection centers operating in 2024 across major farming corridors. Average inspection throughput stood at 38 units per center per month in 2023, creating backlogs during peak procurement periods. Turnaround times extended from 7 to 19 days in 2025, delaying seasonal readiness for land preparation. Documentation completeness for service histories remains uneven, with verification rates below 60 across informal channels in 2024. Workshop capacity expansion approvals reached 9 new facilities in 2025, yet skilled inspector availability lags, constraining scale of quality-assured supply.
Parts availability and service coverage variability by region
Spare parts distribution nodes are unevenly distributed, with 23 hubs concentrated in three provinces during 2024, leaving remote clusters with average delivery lead times of 11 days versus 3 days in urban belts. Workshop density averages 1 facility per 4,800 square kilometers outside core regions, limiting response times during peak cultivation windows. Fleet downtime incidents reached 42 per 1,000 operating hours in 2023 due to parts shortages. Technician certification programs expanded training intakes to 310 in 2025, yet regional deployment remains uneven. Seasonal road access constraints further extend service response times during monsoon-affected southern zones.
Opportunities
Dealer-led refurbishment and certification programs
Structured refurbishment programs can standardize quality by expanding accredited inspection points from 14 in 2024 to 28 by 2025, reducing seasonal backlogs. Introducing graded certification tiers linked to service histories can improve buyer confidence and shorten procurement cycles from 19 days to 8 days. Workshop productivity gains of 22 units per month per facility are achievable through standardized reconditioning workflows adopted in 2023 pilot centers. Technician training cohorts expanded to 420 graduates in 2024, enabling regional deployment. Digital service logs implemented across 6 provinces in 2025 can improve traceability and accelerate warranty underwriting for refurbished equipment.
Growth of online auctions and digital marketplaces
Digital platforms recorded 1,260 verified listings in 2024, up from 740 in 2022, reflecting improved logistics integration and remote inspection protocols. Average listing-to-sale cycle compressed from 21 days to 12 days during 2025 pilot programs using standardized condition reports. Mobile penetration across farming households reached 92 in 2024, enabling wider adoption of remote bidding tools. Integration with regional transport networks expanded delivery coverage to 47 distribution points by 2025. Escrow-based settlement frameworks adopted by provincial authorities in 2023 reduced transaction disputes by 31 cases annually, improving buyer confidence in remote transactions.
Future Outlook
The market outlook remains constructive as policy emphasis on food security and water-efficient cultivation sustains mechanization intensity. Expansion of controlled-environment agriculture and contractor-led land development will reinforce demand for reliable secondary equipment. Digital channels and refurbishment standards are expected to mature, improving transparency and transaction velocity. Regional service networks will likely expand to address uptime expectations.
Major Players
- Al-Bahar Heavy Equipment
- Zahid Tractor
- Abdul Latif Jameel Machinery
- Kanoo Machinery
- Tamimi Commercial
- Saudi Diesel Equipment Company
- United Motors Heavy Equipment
- Al-Jomaih Equipment
- Al-Rushaid Equipment
- Al-Futtaim Auto & Machinery
- Mantrac Saudi Arabia
- United Equipment Trading Company
- Al-Bassami Heavy Equipment
- Al-Khodari Equipment
- Arabian Agricultural Services Company
Key Target Audience
- Large commercial farms and agribusiness operators
- Small and mid-sized farmers and cooperatives
- Agricultural contractors and land development firms
- Greenhouse and controlled-environment agriculture operators
- Municipal landscaping and public works departments
- Equipment dealers and refurbishment workshops
- Investments and venture capital firms
- Ministry of Environment, Water and Agriculture and Saudi Food and Drug Authority
Research Methodology
Step 1: Identification of Key Variables
Core variables were defined across horsepower bands, drivetrain types, age cohorts, channel structures, and service ecosystems. Regulatory parameters governing importation, refurbishment standards, and inspection protocols were mapped to operational realities. Utilization drivers across crop systems and greenhouse operations were incorporated to anchor demand-side variables.
Step 2: Market Analysis and Construction
Supply mapping covered dealer networks, refurbishment capacity, logistics corridors, and spare parts distribution. Demand-side constructs incorporated mechanization intensity, seasonal utilization cycles, and financing access. Channel performance was assessed through transaction velocity, inspection throughput, and service turnaround indicators across priority regions.
Step 3: Hypothesis Validation and Expert Consultation
Operational assumptions were tested with farm managers, workshop supervisors, logistics coordinators, and financing officers. Validation focused on downtime drivers, refurbishment productivity, certification bottlenecks, and regional service coverage constraints. Iterative feedback refined channel dynamics and utilization assumptions across seasons.
Step 4: Research Synthesis and Final Output
Findings were synthesized into coherent market structures, competitive positioning frameworks, and forward-looking opportunity pathways. Cross-validation ensured internal consistency across supply, demand, channel, and regulatory dimensions. Insights were translated into actionable narratives aligned with policy, operational, and investment considerations.
- Executive Summary
- Research Methodology (Market Definitions and grading standards for used tractors in KSA, Field interviews with used equipment dealers and farm cooperatives, Analysis of auction and resale transaction data across regions, Primary surveys of fleet owners and agricultural contractors, Import-export and customs data triangulation for used machinery, Dealer inventory audits and pricing benchmarks)
- Definition and Scope
- Market evolution
- Usage patterns across farm sizes and sectors
- Ecosystem structure
- Supply chain and channel structure
- Regulatory environment

- Growth Drivers
Mechanization needs driven by farm labor shortages
Expansion of greenhouse and commercial farming projects
Cost advantage of used tractors over new imports
Government support for agricultural productivity and food security
Growing secondary market facilitated by digital platforms
Fleet replacement cycles among large farms and contractors - Challenges
Limited availability of certified quality-assured used tractors
High maintenance costs for older equipment
Parts availability and service coverage variability by region
Price volatility linked to import restrictions and FX exposure
Low transparency in equipment condition and usage history
Seasonal demand fluctuations affecting dealer inventory turnover - Opportunities
Dealer-led refurbishment and certification programs
Growth of online auctions and digital marketplaces
Cross-border sourcing of used tractors from GCC markets
Financing and leasing solutions for small and mid-sized farms
Aftermarket service bundles and extended warranties
Aggregation of fragmented sellers into organized platforms - Trends
Rising preference for 4WD tractors for mixed terrain farming
Increased demand for mid-range horsepower segments
Digital price discovery and online listing adoption
Refurbishment and reconditioning as value-added services
Bundling implements with used tractor sales
Data-driven inventory management by large dealers - Government Regulations
- SWOT Analysis
- Stakeholder and Ecosystem Analysis
- Porter’s Five Forces Analysis
- Competition Intensity and Ecosystem Mapping
- By Value, 2020–2025
- By Volume, 2020–2025
- By Installed Base, 2020–2025
- By Average Selling Price, 2020–2025
- By Horsepower Range (in Value %)
Below 40 HP
40–75 HP
76–120 HP
Above 120 HP - By Drive Type (in Value %)
2WD
4WD - By Tractor Type (in Value %)
Utility tractors
Row crop tractors
Compact tractors
Orchard and specialty tractors - By Age of Tractor (in Value %)
Less than 5 years
5–10 years
11–15 years
More than 15 years - By Application (in Value %)
Crop farming
Livestock and dairy operations
Horticulture and plantations
Municipal and landscaping
Construction and infrastructure support - By Sales Channel (in Value %)
Authorized dealer resale
Independent used equipment dealers
Online marketplaces and auctions
Direct owner-to-owner transactions - By Region in KSA (in Value %)
Riyadh Province
Makkah Province
Eastern Province
Qassim
Asir and Jazan
- Market structure and competitive positioning
Market share snapshot of major players - Cross Comparison Parameters (Pricing competitiveness, Inventory depth and turnover, Geographic dealer coverage in KSA, Refurbishment and certification capabilities, Financing and leasing partnerships, After-sales service network, Spare parts availability, Digital sales and auction presence)
- SWOT Analysis of Key Players
- Pricing and Commercial Model Benchmarking
- Detailed Profiles of Major Companies
Al-Bahar Heavy Equipment
Abdul Latif Jameel Machinery
Zahid Tractor
Arabian Agricultural Services Company
Saudi Diesel Equipment Company
Tamimi Commercial
Al-Futtaim Auto & Machinery
Kanoo Machinery
United Motors Heavy Equipment
Al-Bassami Heavy Equipment
Al-Khodari Equipment
Al-Rushaid Equipment
Al-Jomaih Equipment
Mantrac Saudi Arabia
United Equipment Trading Company
- Demand and utilization drivers
- Procurement and tender dynamics
- Buying criteria and vendor selection
- Budget allocation and financing preferences
- Implementation barriers and risk factors
- Post-purchase service expectations
- By Value, 2026–2035
- By Volume, 2026–2035
- By Installed Base, 2026–2035
- By Average Selling Price, 2026–2035


 Request a Sample
 Ask for Customization
 Get a Quote
 Enquire Now