
 Download PDF
 Download PDF
Market Overview
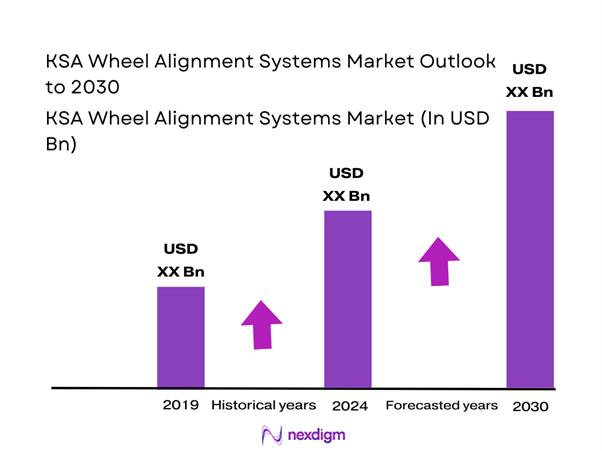
The KSA wheel alignment systems market is best tracked inside the broader automotive test equipment spend (workshop diagnostic + undercar measurement equipment), where wheel alignment testers are highlighted as a fast-growing product category. In the latest year, Saudi Arabia’s automotive test equipment market generated USD ~ million, while the year before saw ~ motor vehicles sold and the latest year reached ~ units—supporting higher alignment throughput, tire replacement cycles, and preventive maintenance demand across workshops.
Demand for wheel alignment systems concentrates in Riyadh, Makkah/Jeddah corridor, and the Eastern Province (Dammam–Khobar–Jubail) because these locations combine the densest vehicle parc, highest dealership/service-bay density, and fleet-led maintenance intensity (rental, logistics, last-mile, corporate fleets). In the latest year, registered vehicles in use exceeded ~ million, and newly registered vehicles exceeded ~ million, reinforcing sustained workshop capex cycles for faster, higher-accuracy alignment platforms—especially where multi-bay operations value uptime, standardized procedures, and ADAS-ready workflows.
Market Segmentation
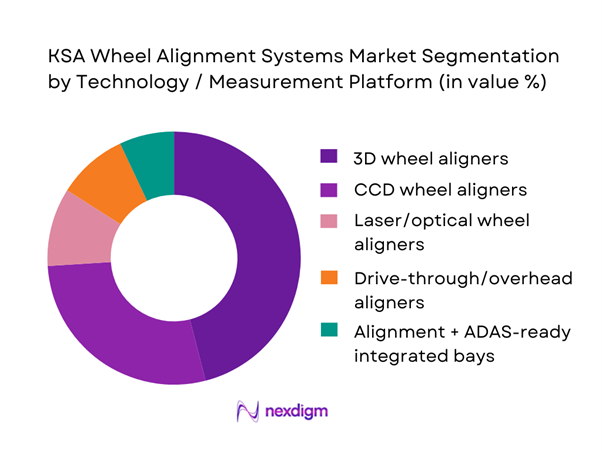
By Technology / Measurement Platform
Recently, 3D wheel aligners dominate new-install demand in KSA because they match the operating reality of high-throughput tire and service centers: faster setup, reduced clamp/runout sensitivity (depending on model), and easier standardization across multi-branch workshop networks. They also align with the market shift toward more complex suspensions, larger wheel sizes, and higher customer expectations around steering feel and tire life—especially in urban corridors with heavy daily mileage. Critically, workshops increasingly design alignment as part of an “under-car productivity cell” (inspection + alignment + balancing + tire service), where 3D solutions provide quicker operator onboarding and more consistent reporting formats—useful for fleet accounts and dealer groups seeking repeatable quality and audit trails.
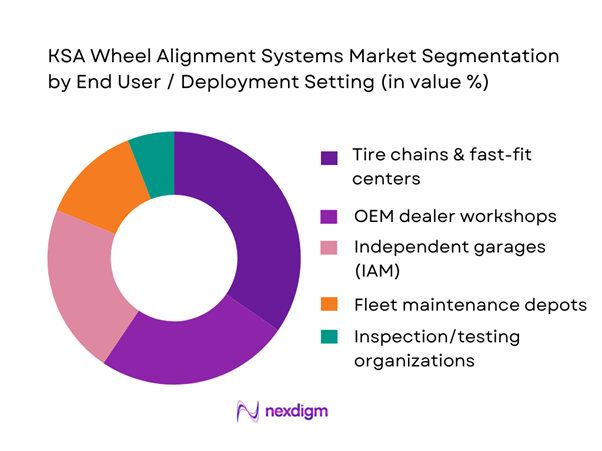
By End User / Deployment Setting
Tire chains & fast-fit centers typically lead installed-base additions because wheel alignment is tightly linked to tire replacement and balancing, making it a high-frequency add-on service with clear consumer value. In KSA’s high-mileage environment, tire wear management becomes a recurring need, and tire-focused operators monetize alignment through bundled packages, membership-style service offers, and standardized multi-branch workflows. These chains also refresh equipment more frequently than smaller independents to reduce bay cycle time and improve first-time-right outcomes. As registered vehicles and new registrations continue rising, tire chains benefit from consistent walk-in demand plus fleet contracts, which pushes them toward scalable, network-wide alignment standardization (training, SOPs, reporting templates, and service KPIs).
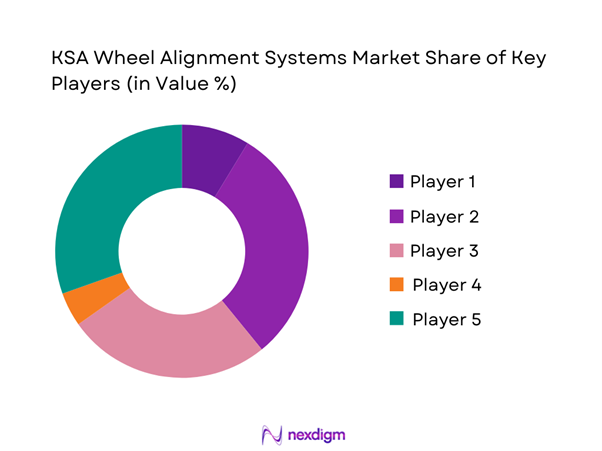
Competitive Landscape
KSA’s wheel alignment systems market is led by a mix of global workshop-equipment OEMs and multi-brand undercar specialists. Competitive advantage is shaped by alignment accuracy and speed, software/database cadence, ADAS-calibration adjacency, uptime/service coverage via local distributors, and the ability to standardize multi-bay operations (especially for tire chains, dealer groups, and fleets).
| Company | Est. Year | HQ | Core Wheel-Alignment Portfolio | ADAS Calibration Adjacency | Typical Install Footprint | Software & Vehicle Database Approach | Training / Enablement Model | After-Sales / Service Model |
| Hunter Engineering | 1946 | USA | ~ | ~ | ~ | ~ | ~ | ~ |
| Bosch (Automotive Equipment Ecosystem) | 1886 | Germany | ~ | ~ | ~ | ~ | ~ | ~ |
| John Bean (Snap-on Group) | 1925 | USA / Europe (brand origin) | ~ | ~ | ~ | ~ | ~ | ~ |
| MAHA | 1968 | Germany | ~ | ~ | ~ | ~ | ~ | ~ |
| Beissbarth | Legacy brand | Germany (Munich region) | ~ | ~ | ~ | ~ | ~ | ~ |
KSA Wheel Alignment Systems Market Analysis
Growth Drivers
Expansion of Vehicle Parc in KSA
Saudi Arabia’s vehicle parc expansion is structurally lifting wheel-alignment throughput because a larger “vehicles-in-use” base mechanically increases alignment-triggering events (tire changes, suspension wear, curb impacts, and post-repair geometry checks). The road transport stock shows passenger vehicles in use at ~ units and trucks in use at ~ units, while new vehicle registrations reached ~ (with ~ recorded in the prior reading), sustaining steady workshop demand for toe/camber/caster correction and printout documentation for fleets. This sits on a macro base of GDP at USD ~ trillion and population at ~, which supports continued mobility intensity, intercity movement, and service-sector scaling that translates into more alignment cycles per bay (especially in Riyadh–Makkah–Eastern Province corridors).
Rising Tire Replacement and Suspension Repair Frequency
Wheel-alignment frequency in KSA is pulled upward by the scale of tire turnover and suspension/steering interventions that follow high utilization, heat load, and road-surface shocks—each typically requiring alignment to stabilize tire wear and steering-centre. Saudi Arabia’s inbound flow of passenger-car tires alone is material: imports of new pneumatic tyres for passenger cars totaled ~ items, with import value USD ~ in the referenced trade year; this is a direct proxy for replacement volume that converts into alignment checks across tire shops and fast-fit bays. On-road safety statistics reinforce the repair stimulus: serious traffic accidents at ~ cases (with ~ recorded in the prior reading) and injuries at ~ (with ~ prior) are consistent with recurring undercarriage inspection and suspension/steering work that commonly ends in alignment, road-test, and “before/after” geometry reports. These service pulls sit within a macro context of GDP per capita at USD ~ and net migration at ~, supporting continued mobility needs and vehicle servicing cycles tied to resident and workforce movement.
Challenges
Calibration Discipline and Skilled Technician Shortage
Modern alignment systems reduce measurement time but still require disciplined setup (vehicle prep, runout compensation, correct clamp mounting, correct wheelbase/track selection, and consistent SOPs). The challenge in KSA is that demand is expanding faster than technician capability ramp-up in many workshop clusters, creating rework risk and inconsistent “first-pass” accuracy. The scale pressure is visible in throughput drivers: new vehicle registrations at ~ and driving licenses issued at ~ keep service volumes high, while the service ecosystem count of ~ current enterprises indicates a fragmented workshop universe where training consistency can vary widely. Safety workload adds more strain: serious accidents at ~ and injuries at ~ translate into repair jobs that require correct post-repair geometry—raising the cost of technician error. Against this, macro fundamentals—population at ~ and GDP per capita at USD ~—support demand, but also make technician quality a binding constraint: higher vehicle turnover and faster service expectations leave less room for trial-and-error calibration.
Price Pressure from Low-Cost and Grey Imports
A key operational challenge for wheel-alignment system vendors and workshop owners is competitive price pressure from low-cost imports and grey channels, which can compress budgets for genuine spares, software updates, calibration tools, and certified installation. Saudi Arabia’s import landscape is broad and active, and workshop equipment/parts supply chains are import-exposed; even in adjacent precision components, trade data illustrates sizeable inbound flows that can fragment quality tiers (for example, for parts/accessories categories, recorded quantities run into ~ kg with trade value USD ~ for a precision-accessory heading). In a high-throughput vehicle market—passenger vehicles in use at ~ and trucks in use at ~—downtime and misalignment comebacks quickly become visible to customers, but grey procurement can still proliferate when workshops are optimizing short-term capex. Macro conditions—GDP at USD ~ trillion and inflation indicator reading at ~—support spending ability overall, yet don’t prevent procurement trade-offs when a market has many small operators and intense local competition on turnaround times and ticket volumes.
Opportunities
ADAS-Ready Alignment Bay Deployment
An actionable growth opportunity is upgrading alignment lanes into ADAS-ready service cells (flat-floor discipline, correct lighting, sensor-safe workflow, and post-repair verification steps) so workshops can capture higher-complexity jobs without relying on future projections. The current addressable base is already large: new vehicle registrations at ~ (with ~ prior) are continually refreshing the parc with newer platforms that more often carry steering-angle dependencies and sensor-driven stability systems, increasing the share of repairs where alignment output needs to be consistent and documented. Repair stimulus remains high: serious accidents at ~ and injuries at ~ sustain collision and suspension jobs where alignment is a prerequisite step before any calibration-adjacent checks are credible. The macro layer supports workshop capex appetite: GDP at USD ~ trillion and GDP at USD ~ trillion indicate a large economy where organized service formats can scale standardized bays across cities. In practice, ADAS-ready lanes become a differentiation lever—fewer comebacks, faster handover, and stronger fleet/dealership acceptance—driven by today’s parc turnover and repair volumes rather than forward-looking market-size claims.
Multi-Bay Scaling in Tire and Fast-Fit Chains
A second opportunity is multi-bay scaling—deploying standardized alignment lanes across branch networks and tuning operations for peak throughput (queue management, standardized checklists, unified printout templates, and centralized QC). The “why now” is supported by current demand-scale indicators: passenger vehicles in use at ~ and trucks in use at ~ create continuous alignment demand across private, fleet, and LCV segments, while driving licenses issued at ~ and renewals at ~ show a large, active driving base that keeps service lanes busy. The supply-side scaling canvas also exists: ~ current enterprises in the broad repair/trade umbrella indicates a dense competitive field where chains can win by standardizing cycle time and reducing variance in alignment quality between branches. Macro foundations—population at ~ and GDP per capita at USD ~—support high mobility intensity and a customer base that values faster turnaround and predictable service outcomes. Multi-bay rollout therefore reflects current operating reality (high parc, dense service points) rather than requiring future market-size arguments.
Future Outlook
Over the next cycle, KSA wheel alignment systems demand is expected to strengthen as workshops modernize for higher throughput, tighter quality control, and more sensor-rich vehicle platforms. The market’s growth path is reinforced by rising vehicle parc and registrations, workshop network expansion in major metros, and a shift toward productivity-driven bay design (alignment as a repeatable, reportable service line). The strongest momentum is expected in 3D platforms, drive-through concepts for high-volume sites, and alignment workflows that are ADAS-aware and documentation-ready.
Major Players
- Hunter Engineering
- Snap-on / John Bean
- Bosch
- MAHA
- Beissbarth
- Ravaglioli
- Corghi
- Hofmann
- CEMB
- HPA
- Launch Tech
- Rotary
- Continental
- Nexion Group
Key Target Audience
- Tire chains & fast-fit operators
- OEM dealer groups & authorized service networks
- Independent workshop groups / workshop franchises
- Fleet owners and in-house maintenance depots
- Automotive equipment distributors / garage-equipment integrators
- Leasing & rental operators
- Investments and venture capitalist firms
- Government and regulatory bodies
Research Methodology
Step 1: Identification of Key Variables
We map the KSA wheel alignment ecosystem across equipment OEMs, importers/distributors, tire chains, dealer workshops, IAM garages, and fleet depots. Desk research consolidates technology types, buying triggers, service models, and compliance needs to define the core variables influencing adoption.
Step 2: Market Analysis and Construction
We compile historical demand indicators tied to vehicle parc growth, new registrations, tire replacement intensity, and workshop expansion. A bottom-up build estimates equipment deployment by site type (dealer, chain, IAM, fleet), then cross-checks with shipment/installation patterns and distributor throughput.
Step 3: Hypothesis Validation and Expert Consultation
Hypotheses on technology shifts (3D vs CCD), replacement cycles, and ADAS-adjacent demand are validated via structured interviews with KSA distributors, workshop managers, and fleet maintenance heads. These inputs refine assumptions around utilization, bay economics, and procurement triggers.
Step 4: Research Synthesis and Final Output
Findings are triangulated across company disclosures, distributor feedback, workshop process mapping, and secondary references to finalize segmentation, competitive positioning, and future outlook. The synthesis emphasizes actionable implications for OEMs, channel partners, and multi-site workshop operators.
- Executive Summary
- Research Methodology (Market Definitions and Scope Boundaries, Assumptions and Exclusions, Abbreviations, Data Triangulation Logic, Top-Down Market Sizing Approach, Bottom-Up Installed-Base and Bay-Count Approach, Primary Interview Framework with Dealers, Tire Chains, Independent Garages, Fleet Operators and Equipment Distributors, Pricing and ASP Normalization Logic, Channel Mapping Framework, Competitive Benchmarking Framework, Limitations and Sensitivity Checks)
- Definition and Scope
- Market Genesis and Evolution of Wheel Alignment Technologies in KSA
- Role of Wheel Alignment in Workshop Economics and Service Profitability
- Business Cycle and Demand Seasonality
- Ecosystem Structure and Value Chain Overview

- Growth Drivers
Expansion of Vehicle Parc in KSA
Rising Tire Replacement and Suspension Repair Frequency
Dealership Network Expansion and Workshop Modernization
Fleet Professionalization and Preventive Maintenance Adoption
Integration of Alignment with ADAS Calibration Requirements - Challenges
Calibration Discipline and Skilled Technician Shortage
Price Pressure from Low-Cost and Grey Imports
Workshop Space Constraints and Bay Optimization Issues
Uptime Dependency on Local Spare Parts Availability
Environmental Stress Impact on Sensor Accuracy - Opportunities
ADAS-Ready Alignment Bay Deployment
Multi-Bay Scaling in Tire and Fast-Fit Chains
Penetration into Heavy Vehicle and Bus Alignment
Service Contracts, AMC and Software Licensing Expansion
Connected Diagnostics and Data-Driven Workshop Optimization - Trends
Shift Toward 3D and High-Speed Alignment Systems
Cloud-Based Vehicle Specification Databases
Digital Job Cards and Alignment Report Automation
Touchless Alignment and Drive-Through Concepts
AI-Assisted Measurement and Error Reduction - Regulatory & Policy Landscape
- SWOT Analysis
- Stakeholder & Ecosystem Analysis
- Porter’s Five Forces Analysis
- Competitive Intensity & Ecosystem Mapping
- By Value, 2019–2024
- By Volume, 2019–2024
- Installed Base and Replacement Cycle, 2019–2024
- Average Selling Price Trends, 2019–2024
- By Fleet Type (in Value %)
Passenger Cars
SUVs and Light Trucks
Light Commercial Vehicles
Medium and Heavy Commercial Vehicles
Buses and Specialty Vehicles - By Application (in Value %)
Authorized Dealership Workshops
Tire and Fast-Fit Chains
Independent Garages
Fleet Maintenance Workshops
Inspection and Testing Lanes - By Technology Architecture (in Value %)
3D Camera-Based Alignment Systems
CCD Sensor-Based Alignment Systems
Laser and Optical Alignment Systems
Touchless or Drive-Through Alignment Systems
Portable and Mobile Alignment Solutions - By Connectivity Type (in Value %)
Standalone Offline Systems
PC-Based Systems
Cloud-Connected Alignment Platforms
Workshop DMS-Integrated Systems
Remote Diagnostics Enabled Systems - By End-Use Industry (in Value %)
Automotive Retail and Dealerships
Automotive Aftermarket Services
Logistics and Fleet Operations
Government and Municipal Fleets
Public Transport Operators - By Region (in Value %)
Central Region
Western Region
Eastern Region
Southern Region
Northern Region
- Market Share Snapshot by Value, Volume and Installed Base
Competitive Positioning Matrix - Cross Comparison Parameters (Installed Base in KSA, Alignment Cycle Time per Vehicle, Measurement Repeatability and Accuracy, Vehicle Database Update Frequency, ADAS Integration Readiness, Local Spare Parts Availability and Lead Time, Calibration and Metrology Support Model, Warranty Terms and Uptime SLA Practices)
- Pricing and Commercial Models
- Route-to-Market and Service Network Benchmark
- Detailed Company Profiles
Hunter Engineering
John Bean
Hofmann
Beissbarth
Ravaglioli
MAHA
Corghi
CEMB
Launch Tech
Rotary Lift
BendPak
Nussbaum
TEXA
SICE
Tecalemit
- Demand and Utilization Patterns
- CAPEX Budgeting and Approval Structures
- Decision-Making Unit Mapping
- Operational Pain Points and Rework Drivers
- Brand and Distributor Selection Criteria
- By Value, 2025–2030
- By Volume, 2025–2030
- Installed Base Expansion and Replacement Demand, 2025–2030
- Average Selling Price Trends, 2025–2030


 Request a Sample
 Ask for Customization
 Get a Quote
 Enquire Now